Recovery or Rejection for $LRCX?🚨 Recovery or Rejection for NASDAQ:LRCX ?
Lam Research is up 10%+ on strong earnings & guidance—but it’s testing a key S/R zone!
🔹 Bullish above $76.70—watch for momentum 🚀
🔹 Bearish if rejected—potential pullback 📉
Big move incoming—what’s your read? 👀
LONG

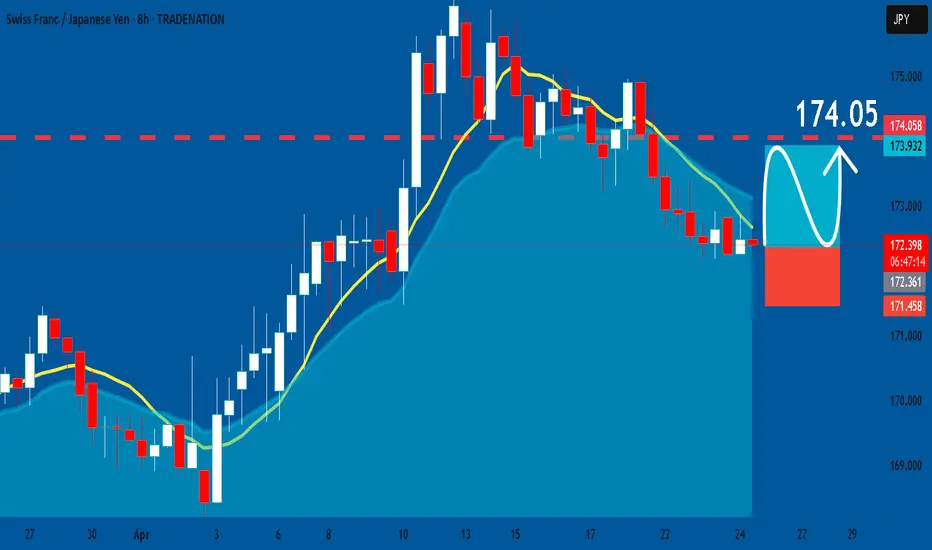
CHFJPY: Long Trade with Entry/SL/TP
CHFJPY
- Classic bullish pattern
- Our team expects retracement
SUGGESTED TRADE:
Swing Trade
Buy CHFJPY
Entry - 172.36
Stop - 171.45
Take - 174.05
Our Risk - 1%
Start protection of your profits from lower levels
Disclosure: I am part of Trade Nation's Influencer program and receive a monthly fee for using their TradingView charts in my analysis.
❤️ Please, support our work with like & comment! ❤️
EURUSD: Will Start Growing! Here is Why:
The recent price action on the EURUSD pair was keeping me on the fence, however, my bias is slowly but surely changing into the bullish one and I think we will see the price go up.
Disclosure: I am part of Trade Nation's Influencer program and receive a monthly fee for using their TradingView charts in my analysis.
❤️ Please, support our work with like & comment! ❤️

ETHUSD Will Go Up From Support! Long!
Take a look at our analysis for ETHUSD.
Time Frame: 8h
Current Trend: Bullish
Sentiment: Oversold (based on 7-period RSI)
Forecast: Bullish
The market is testing a major horizontal structure 1,754.52.
Taking into consideration the structure & trend analysis, I believe that the market will reach 1,966.56 level soon.
P.S
Overbought describes a period of time where there has been a significant and consistent upward move in price over a period of time without much pullback.
Disclosure: I am part of Trade Nation's Influencer program and receive a monthly fee for using their TradingView charts in my analysis.
Like and subscribe and comment my ideas if you enjoy them!

Coinbase Bullish/Bearish?Coinbase moves in line with cryptocurrencies and their trading volume. As we anticipate a potential upward trend, the volume is increasing, which is a positive sign for Coinbase. Currently, like many other cryptocurrencies, we are at a resistance level and are waiting for a breakout. If the breakout is successful, short-term targets between $220 and $250 are realistic. Should we break through the $250 level, further price targets in the range of $500 to $600 could be expected.

DXY Is Bullish! Buy!
Please, check our technical outlook for DXY.
Time Frame: 15m
Current Trend: Bullish
Sentiment: Oversold (based on 7-period RSI)
Forecast: Bullish
The price is testing a key support 99.109.
Current market trend & oversold RSI makes me think that buyers will push the price. I will anticipate a bullish movement at least to 99.404 level.
P.S
Overbought describes a period of time where there has been a significant and consistent upward move in price over a period of time without much pullback.
Disclosure: I am part of Trade Nation's Influencer program and receive a monthly fee for using their TradingView charts in my analysis.
Like and subscribe and comment my ideas if you enjoy them!

USD/CAD BUYERS WILL DOMINATE THE MARKET|LONG
Hello, Friends!
We are now examining the USD/CAD pair and we can see that the pair is going down locally while also being in a downtrend on the 1W TF. But there is also a powerful signal from the BB lower band being nearby indicating that the pair is oversold so we can go long from the support line below and a target at 1.387 level.
Disclosure: I am part of Trade Nation's Influencer program and receive a monthly fee for using their TradingView charts in my analysis.
✅LIKE AND COMMENT MY IDEAS✅

Adobe: Trend started in Feb 2016, revisiting the trend Possible break down to $282 or if the trend hold, shoots to the upside. Possible earnings catalyst or tariff relief.

Daily BTC OverviewThe daily chart in its simplest form can be broken down into this range. Since President Trumps inauguration, BTC has declined from a range high of $108,000 back to the lows of $74,500 closing the FVG caused by the US election rally. After a double bottom Bitcoin mean reverted back to the range midpoint which to me is the most important area on the entire chart because it decides if the bull run can continue or if it dies.
I like to keep a close eye on the 200 EMA on multiple timeframes but the 1D is important to gauge the momentum of the move. As the US election results came in a massive push away from this moving average causes the level to steepen in its climb showing strength. Since BTC spent quite some time in the top half of the range the 1D 200 EMA flattens out signaling a loss of momentum, once this level does become flat it no longer provides support. For a bullish cycle to be just that ideally the corrective moves do not spend too much time below this level before expanding above and beyond it once again starting the next leg of the move. A persistent move down below causes a rollover and the cycle looks to be over with a bear market beginning.
Bullish scenario - The correction is over and BTC consistently posts HH's & HLs bringing the 1D 200 EMA up with price and continues the previous bullish trend. I would want to see the retest of the midpoint be successful and then move to reclaim the next local high before targeting range high. The bull market correction looks to be over and bullish continuation resumes.
Bearish scenario - This move is nothing more than a LH, BTC wicks the supply above midpoint, swing fails back under and continues to make LH's & LL's back down to range low where the 1D 200EMA will have now rolled over providing more of a resistance level. The bear market looks to have begun.
I am not here to make a call on where BTC is going next as I do not have that answer, but I do have to plan for each eventuality and that is what I have done here from a TA pint of view. Now it is entirely possible that Geo-political news or an exchange hack etc throws TA out of the window and I have to rethink the plan but in a strictly chart structure perspective this is how I see it.
The indicator "TRADING ENVIRONMENT+V1.0" used in the Idea post is now publicly available for use, give it a try and leave your thoughts and suggestions on the post, thank you.

doge buy midterm "🌟 Welcome to Golden Candle! 🌟
We're a team of 📈 passionate traders 📉 who love sharing our 🔍 technical analysis insights 🔎 with the TradingView community. 🌎
Our goal is to provide 💡 valuable perspectives 💡 on market trends and patterns, but 🚫 please note that our analyses are not intended as buy or sell recommendations. 🚫
Instead, they reflect our own 💭 personal attitudes and thoughts. 💭
Follow along and 📚 learn 📚 from our analyses! 📊💡"

AUDUSD Potential UpsidesHey Traders, in today's trading session we are monitoring AUDUSD for a buying opportunity around 0.63600 zone, AUDUSD is trading in an uptrend and currently is in a correction phase in which it is approaching the trend at trend at 0.63600 support and resistance area.
Trade safe, Joe.

Gold: Correction Before Another ATH?Hey Traders, in today's trading session we are monitoring XAUUSD for a buying opportunity around 3220 zone, Gold is trading in an uptrend and currently is in a correction phase in which it is approaching the trend at 3220 support and resistance area.
Trade safe, Joe.

GBPAUD Will Explode! BUY!
My dear friends,
Please, find my technical outlook for GBPAUD below:
The instrument tests an important psychological level 2.0776
Bias - Bullish
Technical Indicators: Supper Trend gives a precise Bullish signal, while Pivot Point HL predicts price changes and potential reversals in the market.
Target - 2.0844
About Used Indicators:
Super-trend indicator is more useful in trending markets where there are clear uptrends and downtrends in price.
Disclosure: I am part of Trade Nation's Influencer program and receive a monthly fee for using their TradingView charts in my analysis.
———————————
WISH YOU ALL LUCK

Ethereum - CME Gap fill before going up ?Ethereum has formed a classic CME Gap between $1,707 and $1,765, following a strong breakout. CME gaps, especially over the weekend, are statistically likely to be filled before the next major move.
We’re watching for a retest of this gap zone with a potential bounce at the lower boundary, creating a solid long entry opportunity.
Entry: 1,710–1,725 (inside the CME gap)
TP1: 1760
TP2: 1800
TP3: 1900
SL: 1,667 (below gap & invalidation of bullish structure)
Like and support us for more such idea.
Cheers
GreenCrypto

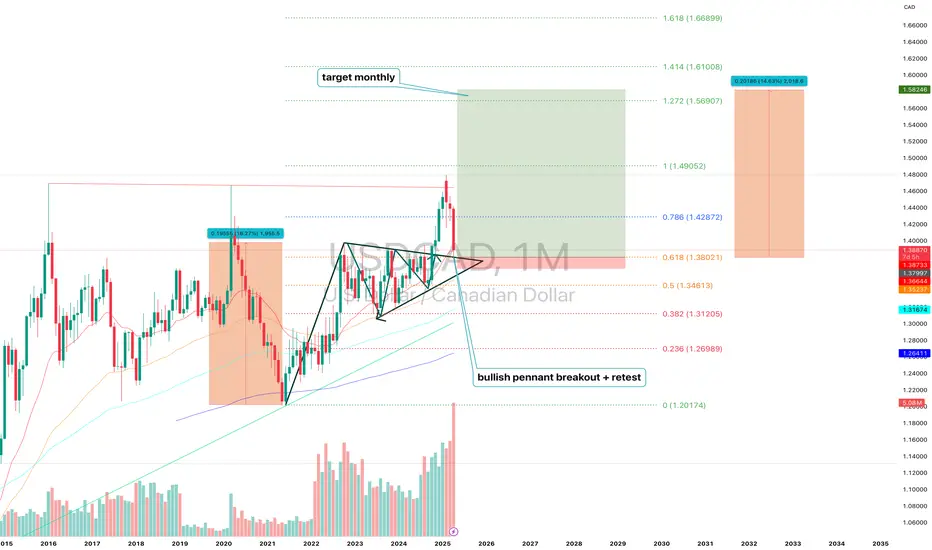
USDCAD (1M) Bullish Pennant Structure and H ProjectionUSDCAD (1M) — Technical and Fundamental Analysis: Bullish Pennant Structure and H Projection
On the monthly chart of USDCAD, a bullish pennant structure has been formed and confirmed with a breakout followed by a clean retest of the upper boundary. The price broke out of the consolidation zone with momentum and is currently holding above the key support at 1.3802. The structure remains active: the first target based on the projected move is 1.4905. If the impulse continues and the market structure remains intact, extended targets lie at 1.5690 (1.272), 1.6100 (1.414), and 1.6689 (1.618) Fibonacci expansions. Technically, the 1.3802 level (0.618 retracement) is the critical support. If this zone holds, the bullish scenario remains valid. The nearest resistance is 1.4287 (0.786), and a confirmed break above this level would likely trigger the next phase toward 1.49. Volume increased during the breakout, confirming strong buyer interest.
Fundamentally, the setup is supported by diverging monetary policies: the Bank of Canada has signaled a more dovish stance due to slowing inflation and economic softness, while the Federal Reserve remains more neutral and cautious about rate cuts. In addition, oil prices — a key factor for the Canadian dollar — are under pressure, weakening the CAD further. Broader macro uncertainty and the global demand for USD as a reserve and safe-haven asset continue to support the dollar, strengthening the USDCAD pair.
Conclusion: As long as the price holds above the 1.38 zone and confirms above 1.4287, the bullish structure remains in play with a target of 1.4905 and potential extensions to 1.5690–1.6100.
LINK/USDT Potential UpsidesHey Traders, in today's trading session we are monitoring LINK for a buying opportunity around 14.6 zone, LINK/USDT is trading in an uptrend and currently is in a correction phase in which it is approaching the trend at 14.6 support and resistance area.
Trade safe, Joe.

EURNZD What Next? BUY!
My dear subscribers,
This is my opinion on the EURNZD next move:
The instrument tests an important psychological level 1.9047
Bias - Bullish
Technical Indicators: Supper Trend gives a precise Bullish signal, while Pivot Point HL predicts price changes and potential reversals in the market.
Target - 1.9308
My Stop Loss - 1.8907
About Used Indicators:
On the subsequent day, trading above the pivot point is thought to indicate ongoing bullish sentiment, while trading below the pivot point indicates bearish sentiment.
Disclosure: I am part of Trade Nation's Influencer program and receive a monthly fee for using their TradingView charts in my analysis.
———————————
WISH YOU ALL LUCK

GBPNZD: Bulls Will Push
Looking at the chart of GBPNZD right now we are seeing some interesting price action on the lower timeframes. Thus a local move up seems to be quite likely.
Disclosure: I am part of Trade Nation's Influencer program and receive a monthly fee for using their TradingView charts in my analysis.
❤️ Please, support our work with like & comment! ❤️

GOLD: Bullish Continuation & Long Trade
GOLD
- Classic bullish formation
- Our team expects growth
SUGGESTED TRADE:
Swing Trade
Buy GOLD
Entry Level - 3326.0
Sl - 3316.8
Tp - 3356.6
Our Risk - 1%
Start protection of your profits from lower levels
Disclosure: I am part of Trade Nation's Influencer program and receive a monthly fee for using their TradingView charts in my analysis.
❤️ Please, support our work with like & comment! ❤️

GOLD Is Very Bullish! Long!
Here is our detailed technical review for GOLD.
Time Frame: 2h
Current Trend: Bullish
Sentiment: Oversold (based on 7-period RSI)
Forecast: Bullish
The market is trading around a solid horizontal structure 3,329.08.
The above observations make me that the market will inevitably achieve 3,396.74 level.
P.S
Please, note that an oversold/overbought condition can last for a long time, and therefore being oversold/overbought doesn't mean a price rally will come soon, or at all.
Disclosure: I am part of Trade Nation's Influencer program and receive a monthly fee for using their TradingView charts in my analysis.
Like and subscribe and comment my ideas if you enjoy them!

USDJPY Is Going Up! Buy!
Take a look at our analysis for USDJPY.
Time Frame: 9h
Current Trend: Bullish
Sentiment: Oversold (based on 7-period RSI)
Forecast: Bullish
The market is testing a major horizontal structure 141.912.
Taking into consideration the structure & trend analysis, I believe that the market will reach 145.882 level soon.
P.S
The term oversold refers to a condition where an asset has traded lower in price and has the potential for a price bounce.
Overbought refers to market scenarios where the instrument is traded considerably higher than its fair value. Overvaluation is caused by market sentiments when there is positive news.
Disclosure: I am part of Trade Nation's Influencer program and receive a monthly fee for using their TradingView charts in my analysis.
Like and subscribe and comment my ideas if you enjoy them!

EURUSD The Target Is UP! BUY!
My dear subscribers,
My technical analysis for EURUSD is below:
The price is coiling around a solid key level - 1.1418
Bias - Bullish
Technical Indicators: Pivot Points High anticipates a potential price reversal.
Super trend shows a clear buy, giving a perfect indicators' convergence.
Goal - 1.1465
About Used Indicators:
By the very nature of the supertrend indicator, it offers firm support and resistance levels for traders to enter and exit trades. Additionally, it also provides signals for setting stop losses
Disclosure: I am part of Trade Nation's Influencer program and receive a monthly fee for using their TradingView charts in my analysis.
———————————
WISH YOU ALL LUCK

USDCHF Is Very Bullish! Buy!
Here is our detailed technical review for USDCHF.
Time Frame: 3h
Current Trend: Bullish
Sentiment: Oversold (based on 7-period RSI)
Forecast: Bullish
The market is approaching a significant support area 0.807.
The underlined horizontal cluster clearly indicates a highly probable bullish movement with target 0.824 level.
P.S
The term oversold refers to a condition where an asset has traded lower in price and has the potential for a price bounce.
Overbought refers to market scenarios where the instrument is traded considerably higher than its fair value. Overvaluation is caused by market sentiments when there is positive news.
Disclosure: I am part of Trade Nation's Influencer program and receive a monthly fee for using their TradingView charts in my analysis.
Like and subscribe and comment my ideas if you enjoy them!
