GOLD - Price can make correction and then continue to growHi guys, this is my overview for XAUUSD, feel free to check it and write your feedback in comments👊
Price broke out from the lower wedge line and started climbing with confidence, building momentum step by step.
After bouncing off the $3215 zone, it pushed higher and touched the wedge resistance without major rejection.
The current candle formation shows signs of slowing down, hinting at a possible short-term pullback ahead.
Despite that, the structure remains bullish, and buyers are likely to defend local support if the price dips slightly.
With the breakout zones holding firm, I expect Gold to make a correction and then resume the upward path.
My target is set at $3500, where the upper wedge boundary might once again act as key resistance.
If this post is useful to you, you can support me with like/boost and advice in comments❤️
LONG

USOIL Will Move Higher! Long!
Take a look at our analysis for USOIL.
Time Frame: 12h
Current Trend: Bullish
Sentiment: Oversold (based on 7-period RSI)
Forecast: Bullish
The market is testing a major horizontal structure 63.114.
Taking into consideration the structure & trend analysis, I believe that the market will reach 68.050 level soon.
P.S
Overbought describes a period of time where there has been a significant and consistent upward move in price over a period of time without much pullback.
Disclosure: I am part of Trade Nation's Influencer program and receive a monthly fee for using their TradingView charts in my analysis.
Like and subscribe and comment my ideas if you enjoy them!

GOLD Is Very Bullish! Long!
Please, check our technical outlook for GOLD.
Time Frame: 1h
Current Trend: Bullish
Sentiment: Oversold (based on 7-period RSI)
Forecast: Bullish
The price is testing a key support 3,327.58.
Current market trend & oversold RSI makes me think that buyers will push the price. I will anticipate a bullish movement at least to 3,360.10 level.
P.S
The term oversold refers to a condition where an asset has traded lower in price and has the potential for a price bounce.
Overbought refers to market scenarios where the instrument is traded considerably higher than its fair value. Overvaluation is caused by market sentiments when there is positive news.
Disclosure: I am part of Trade Nation's Influencer program and receive a monthly fee for using their TradingView charts in my analysis.
Like and subscribe and comment my ideas if you enjoy them!

BCT CMEWe are have 2 target
1) 86850
2) 83200
Friday close in 4h sibi, I think this Sunday NWOG open price down and looking stops lvl 83.200
We are see below 4h bisi after week vi, I think price need move first this area for create sales candle and after hunt 86.850 above NWOG 7 March
I search buy in this two pd area
Lets see what happen after open exchanges

XRP on the go!Hello TradingView Family / Fellow Traders. This is Richard, also known as theSignalyst.
📈 Medium-Term: XRP has been in a correction phase trading within the falling wedge marked in red.
📍 As it retests the lower bound of the channel — which perfectly intersects with the orange demand zone and the $1.5 round number — I’ll be looking for short-term longs.
🚀 For the bulls to take over in the long term and kick off the next bullish phase, a breakout above the red structure at $2.26 is needed.
Which scenario do you think will happen first — and why?
📚 Always follow your trading plan regarding entry, risk management, and trade management.
Good luck!
All Strategies Are Good; If Managed Properly!
~Rich

Ripple Breakout and Potential RetraceHey Traders, in today's trading session we are monitoring Ripple for a buying opportunity around 1.9800 zone, XRP was trading in a downtrend and successfully managed to break it out. Currently is in a correction phase in which it is approaching the retrace area at 1.98000 support and resistance area.
Trade safe, Joe.

NG1! BUYERS WILL DOMINATE THE MARKET|LONG
NG1! SIGNAL
Trade Direction: long
Entry Level: 3.247
Target Level: 3.717
Stop Loss: 2.932
RISK PROFILE
Risk level: medium
Suggested risk: 1%
Timeframe: 1D
Disclosure: I am part of Trade Nation's Influencer program and receive a monthly fee for using their TradingView charts in my analysis.
✅LIKE AND COMMENT MY IDEAS✅

AUD/CHF BULLISH BIAS RIGHT NOW| LONG
Hello, Friends!
Bullish trend on AUD/CHF, defined by the green colour of the last week candle combined with the fact the pair is oversold based on the BB lower band proximity, makes me expect a bullish rebound from the support line below and a retest of the local target above at 0.522.
Disclosure: I am part of Trade Nation's Influencer program and receive a monthly fee for using their TradingView charts in my analysis.
✅LIKE AND COMMENT MY IDEAS✅

SPY Trading Opportunity! BUY!
My dear subscribers,
My technical analysis for SPY is below:
The price is coiling around a solid key level - 526.40
Bias - Bullish
Technical Indicators: Pivot Points High anticipates a potential price reversal.
Super trend shows a clear buy, giving a perfect indicators' convergence.
Goal - 554.18
My Stop Loss - 512.11
About Used Indicators:
By the very nature of the supertrend indicator, it offers firm support and resistance levels for traders to enter and exit trades. Additionally, it also provides signals for setting stop losses
———————————
WISH YOU ALL LUCK

TESLA: Expecting Bullish Continuation! Here is Why:
The analysis of the TESLA chart clearly shows us that the pair is finally about to go up due to the rising pressure from the buyers.
❤️ Please, support our work with like & comment! ❤️

BITCOIN - Price can little correct and then make impulse upHi guys, this is my overview for BTCUSDT, feel free to check it and write your feedback in comments👊
Recently price broke through the $79500 zone after a long phase of flat consolidation and sharp shakeout.
Once bulls reclaimed control, price formed a clean breakout and started building structure inside a wedge.
Momentum carried the price upward, with buyers defending each local dip and creating a stair-step rise.
Now BTC is moving steadily inside the wedge pattern, holding the lower trendline with no strong rejection.
Price is slowly grinding toward the key resistance around $88500, where volatility might return.
If this tempo holds, I expect BTC can grow higher and tag the $91000 points in the next impulsive leg.
If this post is useful to you, you can support me with like/boost and advice in comments❤️

Euro may correct to support area and then rebound upHello traders, I want share with you my opinion about Euro. Looking at the chart, we can see that the price started its growth from the buyer zone between 1.0730 - 1.0785 points, where the price found strong support near the lower boundary of the broadening wedge. After bouncing off that zone, Euro gained momentum and made an impulsive move upward, breaking through the resistance line and establishing a bullish trajectory. Once the pair overcame the 1.1265 level, which is now acting as current support, the price entered a period of consolidation inside the support area between 1.1310 - 1.1265 points. This zone is showing signs of strength again, with the price attempting to stabilize above it. The overall structure continues to respect the boundaries of the broadening wedge, with higher highs and higher lows confirming bullish control. At the moment, EUR is correcting slightly after reaching local highs and is approaching the support area again. A healthy pullback toward 1.1310 - 1.1265 would be in line with the pattern and could trigger the next bullish impulse. Given the ongoing upward structure, the strong support area, and the clear wedge formation, I expect Euro to continue growing toward the upper wedge boundary near 1.1555 points, which is my current TP1. Please share this idea with your friends and click Boost 🚀

CADJPY My Opinion! BUY!
My dear subscribers,
This is my opinion on the CADJPY next move:
The instrument tests an important psychological level 102.92
Bias - Bullish
Technical Indicators: Supper Trend gives a precise Bullish signal, while Pivot Point HL predicts price changes and potential reversals in the market.
Target - 103.71
My Stop Loss - 102.57
About Used Indicators:
On the subsequent day, trading above the pivot point is thought to indicate ongoing bullish sentiment, while trading below the pivot point indicates bearish sentiment.
Disclosure: I am part of Trade Nation's Influencer program and receive a monthly fee for using their TradingView charts in my analysis.
———————————
WISH YOU ALL LUCK

USDCAD: Growth & Bullish Continuation
Looking at the chart of USDCAD right now we are seeing some interesting price action on the lower timeframes. Thus a local move up seems to be quite likely.
Disclosure: I am part of Trade Nation's Influencer program and receive a monthly fee for using their TradingView charts in my analysis.
❤️ Please, support our work with like & comment! ❤️

AUD/NZD LONG FROM SUPPORT
Hello, Friends!
AUD/NZD pair is in the downtrend because previous week’s candle is red, while the price is clearly falling on the 6H timeframe. And after the retest of the support line below I believe we will see a move up towards the target above at 1.083 because the pair oversold due to its proximity to the lower BB band and a bullish correction is likely.
Disclosure: I am part of Trade Nation's Influencer program and receive a monthly fee for using their TradingView charts in my analysis.
✅LIKE AND COMMENT MY IDEAS✅

NZDCHF Will Go Up! Long!
Please, check our technical outlook for NZDCHF.
Time Frame: 1h
Current Trend: Bullish
Sentiment: Oversold (based on 7-period RSI)
Forecast: Bullish
The market is approaching a key horizontal level 0.489.
Considering the today's price action, probabilities will be high to see a movement to 0.492.
P.S
We determine oversold/overbought condition with RSI indicator.
When it drops below 30 - the market is considered to be oversold.
When it bounces above 70 - the market is considered to be overbought.
Disclosure: I am part of Trade Nation's Influencer program and receive a monthly fee for using their TradingView charts in my analysis.
Like and subscribe and comment my ideas if you enjoy them!

EURUSD Is Bullish! Buy!
Please, check our technical outlook for EURUSD.
Time Frame: 12h
Current Trend: Bullish
Sentiment: Oversold (based on 7-period RSI)
Forecast: Bullish
The market is approaching a key horizontal level 1.093.
Considering the today's price action, probabilities will be high to see a movement to 1.114.
P.S
We determine oversold/overbought condition with RSI indicator.
When it drops below 30 - the market is considered to be oversold.
When it bounces above 70 - the market is considered to be overbought.
Disclosure: I am part of Trade Nation's Influencer program and receive a monthly fee for using their TradingView charts in my analysis.
Like and subscribe and comment my ideas if you enjoy them!

Solana has just made an upward moveSolana has just made an upward move due to liquidation levels. At the $140 level, we will most likely see a brief downtrend again, after which we will set the price target at $174. Based on historical data, this timing would also make sense, and it aligns with the liquidation levels from futures positions.

USDJPY – Strong Bounce Incoming from Key Support?Price has tapped into a major support zone that’s held strong since early 2024. With confluence from the Fibonacci 0.618–0.65 retracement overhead, we could see a sharp bullish reversal targeting that region.
🟧 Strong support – historically reactive
📈 Potential bullish reversal in play
📊 Fib confluence at 152 – key reaction area
⏳ Watching for confirmation signs before entry
A clean structure here—could turn into a solid mid-term long setup.
Thoughts? Reversal or continuation lower?

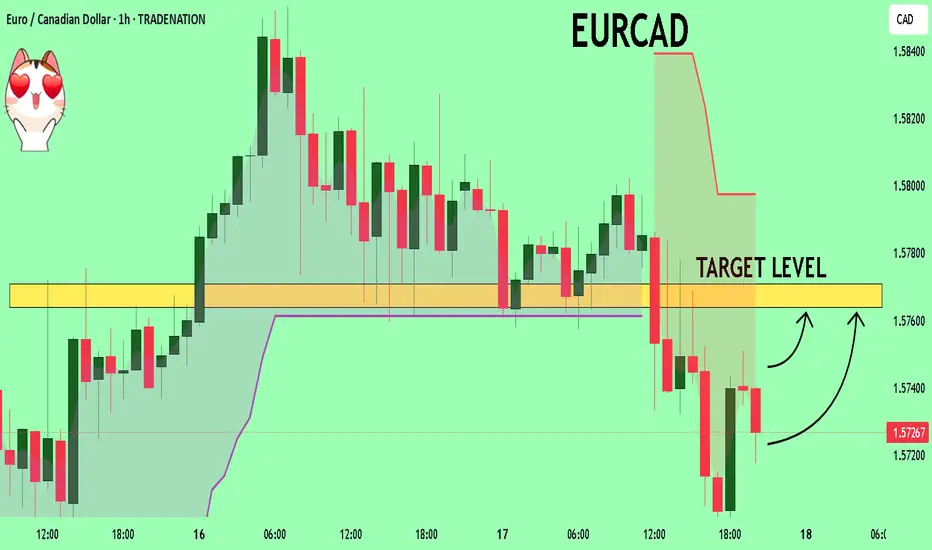
EURCAD What Next? SELL!
My dear followers,
I analysed this chart on EURCAD and concluded the following:
The market is trading on 1.5726 pivot level.
Bias - Bearish
Technical Indicators: Both Super Trend & Pivot HL indicate a highly probable Bearish continuation.
Target - 1.5763
About Used Indicators:
A super-trend indicator is plotted on either above or below the closing price to signal a buy or sell. The indicator changes color, based on whether or not you should be buying. If the super-trend indicator moves below the closing price, the indicator turns green, and it signals an entry point or points to buy.
Disclosure: I am part of Trade Nation's Influencer program and receive a monthly fee for using their TradingView charts in my analysis.
———————————
WISH YOU ALL LUCK
GOLD On The Rise! BUY!
My dear friends,
My technical analysis for GOLD is below:
The market is trading on 3327.7 pivot level.
Bias - Bullish
Technical Indicators: Both Super Trend & Pivot HL indicate a highly probable Bullish continuation.
Target - 3342.3
Recommended Stop Loss - 3320.2
About Used Indicators:
A pivot point is a technical analysis indicator, or calculations, used to determine the overall trend of the market over different time frames.
Disclosure: I am part of Trade Nation's Influencer program and receive a monthly fee for using their TradingView charts in my analysis.
———————————
WISH YOU ALL LUCK

DXY Is Bullish! Buy!
Take a look at our analysis for DXY.
Time Frame: 9h
Current Trend: Bullish
Sentiment: Oversold (based on 7-period RSI)
Forecast: Bullish
The market is on a crucial zone of demand 99.408.
The oversold market condition in a combination with key structure gives us a relatively strong bullish signal with goal 101.388 level.
P.S
Please, note that an oversold/overbought condition can last for a long time, and therefore being oversold/overbought doesn't mean a price rally will come soon, or at all.
Disclosure: I am part of Trade Nation's Influencer program and receive a monthly fee for using their TradingView charts in my analysis.
Like and subscribe and comment my ideas if you enjoy them!

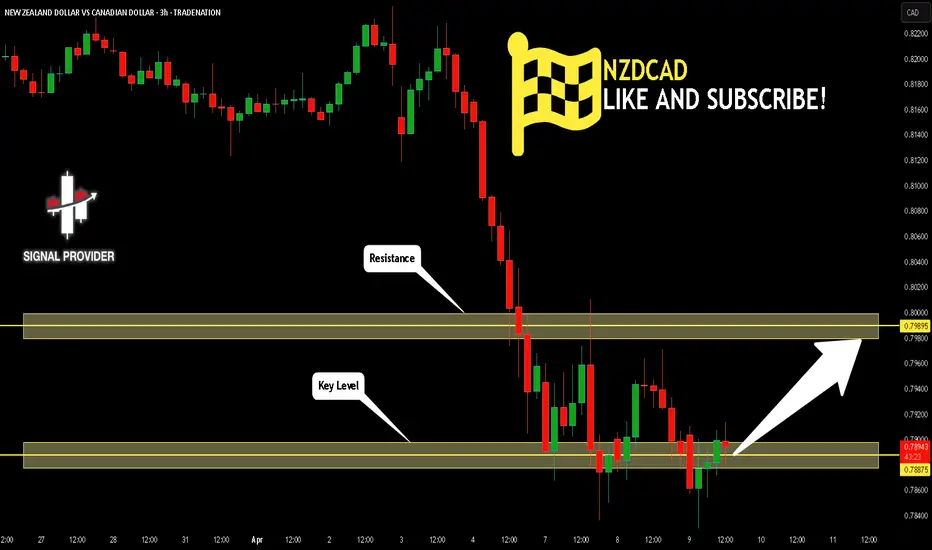
NZDCAD Is Going Up! Buy!
Take a look at our analysis for NZDCAD.
Time Frame: 3h
Current Trend: Bullish
Sentiment: Oversold (based on 7-period RSI)
Forecast: Bullish
The market is on a crucial zone of demand 0.788.
The oversold market condition in a combination with key structure gives us a relatively strong bullish signal with goal 0.798 level.
P.S
Please, note that an oversold/overbought condition can last for a long time, and therefore being oversold/overbought doesn't mean a price rally will come soon, or at all.
Disclosure: I am part of Trade Nation's Influencer program and receive a monthly fee for using their TradingView charts in my analysis.
Like and subscribe and comment my ideas if you enjoy them!