$AVAAI Looks Ready to Explode — Don’t Blink!$AVAAI looks locked in for the next leg up.
After a clean breakout from the previous resistance zone, the price is now forming a solid base above its classic bullish structure.
The trendline’s been respected. Buyers stepped in early.
Volume’s healthy. Structure’s is strong.
In my view, the chart is screaming continuation.
$0.095 and $0.11 could come faster than expected.
Don’t blink, this move could get explosive.
DYOR, NFA
#ALTSEASON #CRYPTOMOJO_TA
Longposition

GBPUSDIn our price range, we enter a long position if there is an entry trigger. We should also check the news time.

PHDC Loading for a Massive Breakout – Hidden Bull Flag Inside!Palm Hills (PHDC) is gearing up for a powerful move! 📈
After months of respecting a clean ascending channel, price just bounced perfectly off lower support.
📊 Indicators flashing green:
StochRSI bullish cross ✅
MACD turning positive ✅
Squeeze Momentum showing early pressure build-up ✅
I’m buying between 6.70–6.85 EGP with a tight stop at 6.50 EGP.
🎯 Targets:
TP1: 7.50 EGP
TP2: 8.00–8.20 EGP
A clean breakout above 7.00 EGP could trigger explosive upside. Watch closely! 🚀
(DYOR – Not financial advice)

BTC long ideaBTC just touched the 4H trendline, also price looks like reversing since already stuck around this level for 12 hours. TP Daily liquidity at 98700-800. Swing tp 106.900.
Als matched with my 0.66 fib level, been sticking around there the whole day.

Long on USD/AUDI am longing USD/AUD from 1.5750
Target 1 - 1.6050
Target 2 - 1.63
I believe we have completed an Elliot wave structure and expect to see upside from this location.
In addition, the stochastic RSI on the daily time frame is oversold.

Novo Nordisk's The recent drop in Novo Nordisk's stock price is attributed to several factors. A key issue is the company’s struggle to meet the surging demand for its weight-loss drugs, such as Wegovy. Although demand remains strong, investors are concerned about Novo Nordisk's ability to scale up production and deliveries, which is creating downward pressure on the stock.
Additionally, some recent financial results failed to meet Wall Street expectations. Despite revenue growth in key product categories, overall revenues in some reports came in below forecasts. This underperformance has contributed to a negative investor sentiment.
However, analysts emphasize that Novo Nordisk's core products remain in high demand, and the company has significant long-term growth potential if it addresses its supply chain and production challenges

EURNZD LongMy Bais is taking a long around 1.84-1.83 price range after the liquidity has been taken out around 1.88-1.87. Long-term opportunity

surpassing the old peak, gold price will reach above 3400 soon⭐️GOLDEN INFORMATION:
Gold price (XAU/USD) resumes its upward momentum, climbing to a fresh all-time high around $3,375 during Monday’s early Asian session, as markets reopen following the extended holiday weekend. The surge comes amid renewed investor appetite for safe-haven assets, fueled by ongoing geopolitical tensions and lingering uncertainty surrounding US President Donald Trump’s aggressive tariff agenda.
With fears mounting over the broader economic fallout from escalating trade conflicts, gold has soared over 25% year-to-date. “In today’s environment of intensifying tariff ambiguity, slowing global growth, sticky inflation, and rising geopolitical risks, the strategic case for increasing gold exposure has never been stronger,” noted analysts at UBS, emphasizing a shift toward diversification away from US assets and the US Dollar.
⭐️Personal comments NOVA:
Big increase, gold price continues to rise thanks to tariff momentum
⭐️SET UP GOLD PRICE:
🔥SELL GOLD zone : 3404- 3406 SL 3409 scalping
TP1: $3395
TP2: $3380
TP3: $3370
🔥SELL GOLD zone : 3415- 3417 SL 3422
TP1: $3405
TP2: $3390
TP3: $3370
🔥BUY GOLD zone: $3357 - $3355 SL $3350
TP1: $3365
TP2: $3380
TP3: $3405
⭐️Technical analysis:
Based on technical indicators EMA 34, EMA89 and support resistance areas to set up a reasonable BUY order.
⭐️NOTE:
Note: Nova wishes traders to manage their capital well
- take the number of lots that match your capital
- Takeprofit equal to 4-6% of capital account
- Stoplose equal to 2-3% of capital account

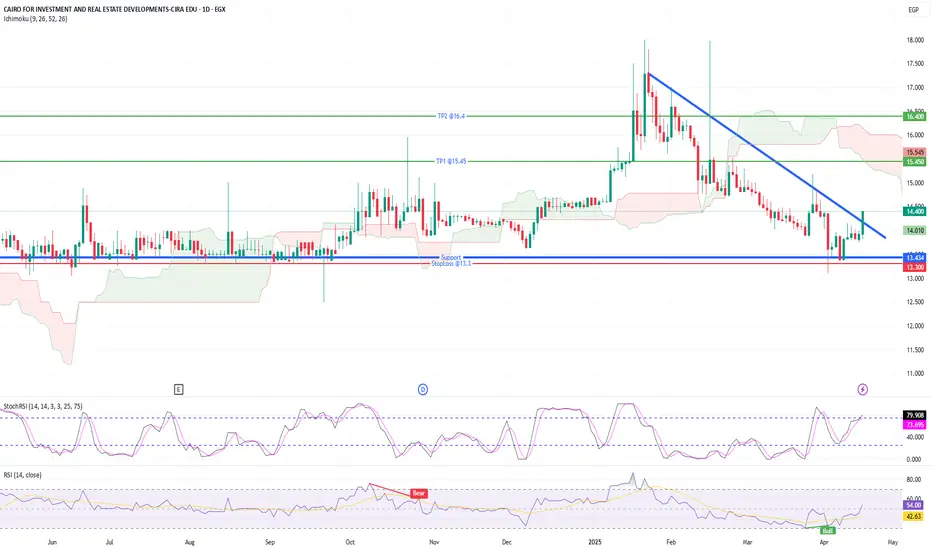
CIRA EDU | Breakout Brewing After Rate Cut – Eyes on 16.80 EGP! CIRA is showing early signs of a bullish reversal just as Egypt's Central Bank slashes bond interest rates by 2.5%. With a fresh MACD bullish crossover and rising momentum, the stock is pushing off key support and aiming for the top of the Ichimoku cloud.
Momentum: Price just broke out of a short-term consolidation zone
Ichimoku Cloud: Price is trying to break upward but still under the cloud → neutral to mildly bullish
Stochastic RSI: Entering overbought territory (above 80)
RSI: Around 42–43 → still has upside room
MACD: Gave a bullish crossover, histogram flipped green → early bullish signal
🟢 Entry: 14.40 EGP
🎯 TP Levels: 15.45 / 16.4
🔻 SL: 13.3
The education sector tends to thrive in lower rate environments, and with strong dividend growth and improving EBITDA, CIRA could be a hidden gem for short- to medium-term traders.
Bitcoin forms cup and handle pattern it can go upBitcoin forms cup and handle pattern it can go up it can go above 50500

E-Finance Breakout: Trendline Breach Signals Fresh Upside PotentE-Finance (EGX) has just broken out of a descending trendline on the weekly chart, supported by momentum indicators turning bullish. The Ichimoku cloud shows that the price is attempting to re-enter bullish territory. With the MACD turning positive and the Squeeze Momentum shifting green, this breakout may be the start of a medium-term rally.
📌 Trade Plan
📥 Entry Zone: Between 17.50 – 18.25 EGP (current price or on a slight dip)
🎯 Take Profit Targets:
TP1: 19.85 EGP (upper Ichimoku cloud resistance)
TP2: 24.00 EGP (previous support-turned-resistance zone)
🛑 Stop Loss: Below 16.50 EGP (under recent swing low & trendline)
⏱️ Time Horizon: Medium-term (4–8 weeks)

AstraMicro ,1Dpattern looks Nic e and Ready to Breakout , Nifty is also Bullish
wait for upper Trendline to Breakout
risk according to your capacity and aim 1:2 in Every Trade so that you would be in Profitable
aim for 30% min
Follow for More Swing ideas like this

Dhanuka ,1DPattern Is looking very good for Breakout , Nifty is also Supporting also all the stocks for Bullish Breakouts , This Is best time to enter in breakout stocks .
Consider Only those stocks that seems Technically strong with Good Volume Breakouts and Strong close .
Risk According to your capacity and aim for 40% and Risk upto 4-5% for this trade , Mainly you have to give the Room to Fluctuate the Stock , according to this flucations you have to decide your Stop loss .
Take Only A+ Setups , so that your Accuracy Should Be High and Returns also High
Follow for more Swing Ideas Like this

OYAKC - Monthly // Decision Month - LONG TERM LEVELSI believe that this month is decision month for OYAKC.Either 600 days accumulation or 600 days ATHs. Any TURP problem could occur in Turkey so check the levels.
Monthly Close below 25.6 - SL
I'll be buying it till 2030.
DYOR.

CHFJPY LIVE TRADE EDUCTIONAL BREAKDOWN LONGThe Japanese yen is expected to strengthen by approximately 7% against the US dollar, according to Morgan Stanley.
This prediction comes as a response to potential weakening economic data and the increasing likelihood of a US recession due to recent reciprocal tariff announcements.
Morgan Stanley’s team, which includes Koichi Sugisaki and David Adams, suggests two long yen trades with revised targets.
First, they recommend shorting USD/JPY at 146.40 with a target of 135, down from the previous target of 145, and a stop at 151. The second recommendation is to short CHF/JPY at 171.30 with a target of 160 and a stop at 180.

NVDA TO $176 BY JUNE THEN $1000 END OF YEARNVDA to $176 by June Then $1000 End of Year: A Bold Thesis
Key Points
It seems likely that NVDA could reach $176 by June 2025, supported by strong AI market trends and upcoming earnings, but reaching $1000 by year-end is highly speculative and controversial.
Research suggests Elliott Wave analysis shows a potential bullish trend, but specific price targets like $1000 lack broad analyst support.
The evidence leans toward significant growth potential due to NVDA's leadership in AI and new product launches, yet such aggressive targets involve high uncertainty.
Current Price and Market Context
As of April 9, 2025, NVDA's closing price on April 8 was $96.30, with pre-market trading at $98.22. This reflects recent volatility, with a 52-week range from $75.61 to $153.13. The stock's performance is tied to its dominance in AI and GPU markets, which are experiencing robust growth.
Analysis for $176 by June
Reaching $176 by June 2025, an 83% increase from $96.30, is ambitious but plausible. Upcoming earnings on May 28, 2025, estimate an EPS of $0.93 and revenue of $43.34 billion, with potential beats driving price surges. Elliott Wave analysis suggests NVDA may be completing a corrective phase, with a falling wedge pattern indicating a possible upward breakout, supporting short-term targets around $176.
Analysis for $1000 by Year-End
The prediction of $1000 by December 2025, a 940% increase, is highly speculative. While some analyses, like a Forbes article, suggest NVDA could see a tenfold rise by 2026 due to the Blackwell architecture, most analyst targets range from $170 to $235. This target lacks broad support and involves significant market and fundamental risks.
Unexpected Detail: Stock Split Impact
An unexpected factor is NVDA's 10-for-1 stock split in June 2024, adjusting prices from over $1,000 to current levels, making historical comparisons complex. This split aligns the $1000 target with post-split valuations, but achieving it requires unprecedented growth.
Survey Note: Detailed Analysis of NVDA's Potential Price Surge to $176 by June and $1000 by Year-End
Introduction
NVIDIA Corporation (NVDA), a leader in graphics processing units (GPUs) and artificial intelligence (AI), is currently trading at approximately $96.30 as of April 9, 2025, based on the closing price from April 8, with pre-market activity showing a slight uptick to $98.22. This analysis explores the feasibility of NVDA reaching $176 by June 2025 and an ambitious $1000 by the end of the year, leveraging Elliott Wave theory and other validated analytical methods. Given the stock's recent performance and market context, we examine technical patterns, fundamental catalysts, and long-term growth potential.
Current Market Position and Historical Context
NVDA's stock has shown volatility, with a 52-week range from $75.61 to $153.13, and a year-to-date change of -11.36% over the past week and -12.23% over the past month, per recent data. The all-time high was $153.13 on January 6, 2025, indicating significant upside potential from current levels. The market capitalization stands at $2.35 trillion, with a beta of 2.40, reflecting high volatility. Key financial metrics include an EBITDA of $83.32 billion and an EBITDA margin of 63.85%, underscoring strong profitability.
A critical context is the 10-for-1 stock split in June 2024, which adjusted share prices from over $1,000 to current levels, making historical comparisons complex. This split, detailed in a CNBC article (Nvidia announces 10-for-1 stock split), was aimed at making ownership more accessible, aligning with the user's post-split price targets of $176 and $1000.
Metric Value
Closing Price (Apr 8) $96.30 USD
Pre-Market Price (Apr 9) $98.22 USD
52-Week Range $75.61 - $153.13 USD
Market Cap $2.35T USD
Beta (1Y) 2.40
Earnings Next Report May 28, 2025, EPS Estimate $0.93, Revenue Estimate $43.34B USD
Last Quarter EPS $0.89 (estimated $0.85, +4.96% surprise)
Dividend Yield (TTM) 0.04%
Elliott Wave Analysis: Technical Insights
Elliott Wave theory, a method identifying market psychology through wave patterns, suggests NVDA may be in a corrective phase, potentially completing wave (4) of a larger five-wave structure. Recent analyses, such as those on TradingView (NVIDIA Stock Chart), indicate a falling wedge or ending diagonal formation, often signaling a reversal and start of an upward trend. This could support a move to $176 by June, as wave (5) projections often extend to 1.618 times wave (1), potentially aligning with such targets.
Specific Elliott Wave analyses, like those from ElliottWave-Forecast (Elliott Wave Expects New All Time High), suggest NVDA has completed corrections and is resuming higher, with wave counts indicating impulsive rallies. However, these analyses lack explicit price targets reaching $1000, focusing more on trend continuations.
Short-Term Target: $176 by June 2025
Reaching $176 by June 2025, an 83% increase from $96.30, is ambitious but supported by several factors. The earnings report on May 28, 2025, is a critical catalyst, with estimates for EPS at $0.93 and revenue at $43.34 billion. Given NVDA's history of beating estimates, as seen in the last quarter with EPS of $0.89 against an estimate of $0.85, a strong report could drive significant price appreciation.
Technical indicators, such as a breakout from the falling wedge, align with this target. Analyst price targets, ranging from $125 to $220 with an average of $177.19 per Zacks (NVIDIA Price Target), also support the possibility, with some forecasts reaching $235.92 (NVDA Forecast). However, achieving this in two months requires sustained bullish momentum and favorable market conditions.
Long-Term Target: $1000 by Year-End 2025
The prediction of $1000 by December 2025, a 940% increase from current levels, is highly speculative. Most analyst forecasts, such as those from MarketBeat (NVIDIA Stock Forecast) and TipRanks (Nvidia Stock Forecast), range from $170 to $235, far below $1000. However, a Forbes article from May 25, 2024 (Nvidia Stock Tops $1,000), suggests NVDA could see a tenfold rise by 2026 due to the Blackwell architecture, potentially supporting a $1000 target by late 2025 if growth accelerates.
Blackwell, a new GPU architecture, is expected to enhance NVDA's AI and data center offerings, potentially driving revenue growth. CoinCodex forecasts a high of $260.32 by December 2025 (NVIDIA Stock Forecast), still below $1000, indicating the target is outlier and involves significant risk. Market volatility, competition, and macroeconomic factors, such as tariff impacts noted in CNN reports (NVDA Stock Quote), add uncertainty.
Fundamental Catalysts and Risks
NVDA's fundamentals are strong, with consistent revenue growth and high EBITDA margins. The company's expansion into AI, autonomous systems, and supercomputers, as noted in LiteFinance (Nvidia Stock Price Prediction), supports long-term growth. However, short-term corrections due to overvaluation or market sentiment, especially around tariff concerns, pose risks.
X posts, such as one from @1000xStocks (X post), highlight NVDA's EPS growth reflecting AI monetization, suggesting bullish sentiment, but lack specific $1000 targets. Another from @ravisRealm (X post) notes adding positions at lower prices, indicating confidence but not supporting the $1000 target.
Conclusion
While reaching $176 by June 2025 is plausible with strong earnings and technical breakouts, the $1000 target by year-end is highly speculative, lacking broad analyst support and requiring unprecedented growth. Investors should monitor earnings reports, product launches like Blackwell, and market trends, while employing risk management strategies given the high uncertainty.

SP500: Is This the 2025 Correction? Or Just Another Bounce?Looking at the weekly chart of the S&P 500 with RSI and key support trendlines, it’s clear we’ve entered a historically important level.
🔍 Context:
2020 → COVID Crash, RSI bottomed 💥
2022 → Bear Market, RSI again flagged a major drop 📉
2023 → Healthy correction, price respected trendline support
2025? → RSI flashing oversold, price testing the long-term trendline again.
📊 RSI is approaching the same low levels as the previous two macro shocks — is this a signal of another reversal opportunity? Or could this time be different?
🚨 If we break below this trendline convincingly, it could open the door for a deeper bear leg. But if we hold, we might just see another bounce-back rally like in 2020 and 2022.
📈 Watch for confirmation:
A strong bounce with bullish RSI divergence = potential long
Breakdown + volume spike = more downside ahead
Let’s see if the trendline holds up — it has for 5 years… 👀
#SP500 #Correction #BearMarket #RSI #TechnicalAnalysis #MarketUpdate #2025Outlook #StockMarketIdeas

$NVDA | A Double Bottom in the Making? We’re spotting the early structure of a double bottom pattern forming on NASDAQ:NVDA — a classic bullish reversal signal. After a steep decline, price action is showing signs of stabilization, testing support twice, and trying to recover from the lows.
But there’s a catch...
📌 No confirmation yet.
The neckline still needs to be broken with strong momentum to validate this formation and trigger potential upside.
⚠️ Today’s tariff-related news could be the catalyst. A strong reaction may either confirm the breakout or invalidate the pattern entirely.
What to watch:
Break above the neckline with volume = potential entry ✅
Failure + breakdown = more pain to come ❌
This is a key technical level. Stay sharp and let price action lead the way.

New ATH , GOLD is comming 3173⭐️GOLDEN INFORMATION:
US President Donald Trump dismissed expectations that the new tariffs would target only a select group of nations with the largest trade imbalances, declaring on Sunday that reciprocal tariffs would apply universally. This announcement, coupled with the existing 25% duties on steel, aluminum, and auto imports, has intensified fears of an escalating global trade war.
Additionally, investors are increasingly convinced that the economic slowdown triggered by these tariffs will pressure the Federal Reserve (Fed) to resume rate cuts, despite persistent inflation concerns. As a result, Gold has surged to a fresh record high, marking its strongest quarterly performance since 1986.
⭐️Personal comments NOVA:
The backdrop of everything from technical to political and economic is supporting the increase in gold prices in the first quarter of 2025. Gold prices have the highest growth in history.
⭐️SET UP GOLD PRICE:
🔥 ATH : SELL 3162 - 3164 SL 3169
TP: 3155 - 3140 - 3127
🔥BUY GOLD zone: $3093 - $3091 SL $3086
TP1: $3100
TP2: $3110
TP3: $3120
⭐️Technical analysis:
Based on technical indicators EMA 34, EMA89 and support resistance areas to set up a reasonable BUY order.
⭐️NOTE:
Note: Nova wishes traders to manage their capital well
- take the number of lots that match your capital
- Takeprofit equal to 4-6% of capital account
- Stoplose equal to 2-3% of capital account

EURUSD Buy Position 31 March 2025I am looking for buying opportunities on FOREXCOM:EURUSD chart. EUR is going well. On the other websites, they think about that EURUSD is going to hit 1.08550 level. I am also agree with them.
Time is a weapon. Be careful.
dzhvush

#API3USDT is showing signs of recovery📉 LONG BYBIT:API3USDT.P from $1.1236
⚡️ Stop loss $1.1030
🕒 Timeframe: 1H
✅ Overview BYBIT:API3USDT.P :
➡️ The chart shows a gradual shift from a downtrend to possible reversal after forming strong support around $1.0680.
➡️ Price is currently attempting to break above the key resistance zone $1.1234–$1.1236, which also marks the potential LONG entry point.
➡️ Volume Profile indicates high trading activity above, with the Point of Control (POC) at $1.2541 — suggesting room for upside movement if breakout holds.
➡️ Bullish volume spikes suggest growing buyer interest.
➡️ Stop loss set at $1.1030, just below recent consolidation lows.
📍 Important Note:
Do not rush the entry!
Wait for a clear hold above $1.1236 before entering the LONG — entering too early may expose you to fakeouts.
🎯 Take Profit Targets:
💎 TP 1: $1.1362
💎 TP 2: $1.1544
💎 TP 3: $1.1707
⚡ Plan:
➡️ Watch for breakout confirmation above $1.1236
➡️ Enter LONG after volume or candle confirmation
📢 Consider partial profit at TP1 and move SL to breakeven for risk-free management.
🚀 BYBIT:API3USDT.P is showing signs of recovery — if the price holds above the entry zone, further upside is expected!

Reciprocal tariffs - gold continues to rise✍️ NOVA hello everyone, Let's comment on gold price next week from 03/31/2025 - 04/04/2025
🔥 World situation:
Gold prices surged on Friday, reaching a new all-time high of $3,086 as uncertainty surrounding US trade policy and an uptick in the Federal Reserve's (Fed) preferred inflation gauge fueled demand for the safe-haven metal. Following this, market sentiment suggests growing confidence that the Fed will implement two rate cuts in 2025. At the time of writing, XAU/USD trades at $3,079, up 0.79%.
Investor sentiment remains cautious as markets brace for April 2, dubbed “Liberation Day” by US President Donald Trump, who has signed an executive order imposing a 25% tariff on all imported automobiles. This move has sparked global reactions, particularly from Canada and the European Union (EU), both of which are preparing retaliatory measures in response to the tariffs.
🔥 Identify:
Gold price moves up, early April will continue to explode to NEW Ath
🔥 Technically:
Based on the resistance and support areas of the gold price according to the H4 frame, NOVA identifies the important key areas as follows:
Resistance: $3100, $3132, $3150
Support : $3002, $2957
🔥 NOTE:
Note: Nova wishes traders to manage their capital well
- take the number of lots that match your capital
- Takeprofit equal to 4-6% of capital account
- Stoplose equal to 2-3% of capital account
- The winner is the one who sticks with the market the longest

breakout - gold price rebounds 3045⭐️GOLDEN INFORMATION:
Gold prices remained stagnant late in the North American session, constrained by a rebound in the US Dollar Index (DXY), which initially dipped to 104.18 before recovering. The turnaround came after the White House confirmed that President Donald Trump would unveil new automobile tariffs around 22:00 GMT. As of writing, XAU/USD is trading at $3,019, showing little change.
Despite reports from The Wall Street Journal suggesting that Trump may introduce limited tariff measures, including on automobiles, bullion traders struggled to find momentum. Meanwhile, the DXY, which measures the Greenback against a basket of six major currencies, climbed 0.32% to 104.55, further weighing on gold’s appeal.
⭐️Personal comments NOVA:
Gold price recovers, breakout of H1 frame. With the latest 25% car tax policy, gold price reacts strongly and increases again.
⭐️SET UP GOLD PRICE:
🔥SELL GOLD zone: $3045 - $3047 SL $3052
TP1: $3038
TP2: $3030
TP3: $3020
🔥BUY GOLD zone: $3023 - $3021 SL $3016
TP1: $3030
TP2: $3040
TP3: $3057
⭐️Technical analysis:
Based on technical indicators EMA 34, EMA89 and support resistance areas to set up a reasonable BUY order.
⭐️NOTE:
Note: Nova wishes traders to manage their capital well
- take the number of lots that match your capital
- Takeprofit equal to 4-6% of capital account
- Stoplose equal to 2-3% of capital account
