STILL BULLISH 2019! LONG TERM CHART OF BTC! RELAX, I HAVE PROOF!Hello everyone! I have a fresh, juicy idea straight from the trees, its even greater than all my previous posts put together, and I mean it. However, I agree its tiresome to read, and I don't want every post to be like this, but this one is an exception because I have something really important to say.
As you know I have a habit of writing very long posts, I have too many thoughts in my mind, and I usually jam them all into 1 post, which is not good for you guys, so what I'll do in the future is write each idea separately and focus straight to the point.
This post will be looking at the entire history of BTC, from start to finish. We'll be looking at this chart from a birds eye view to truly understand the big picture of BTC. The future is bright and awaits us with many more phenomenal things to come, its exciting times, I can't stress that enough.
TECHNICAL POINTS
For reference, here's the legend for my chart:
Blue lines = Long term support & resistance
Pink lines = Short term support & resistance
Green patch = Bull market
Red patch = Bear market
Grey patch = Consolidation phase
Purple dotted line = BTC halvings
Black line = DNM Support
What you're seeing is a long term chart of BTC, I changed the view to log instead of auto, with this change we can clearly see that there is a massive yet gradual uptrend. We're bouncing off trend line supports and resistances on the weekly, the entire chart is going on an uptrend. If you look at the RSI, its telling us the same exact story. I don't see anything going to 0 here.
It can only go up, there's literally no indicator saying that we're heading down, this is why I'm extremely confident, if anyone tells you otherwise, ask them for proof, which they probably don't have, because they're most likely "when moon lambo kids" who don't understand a thing about markets. I'm not saying I'm 100% right, but if you disagree with me, then by all means feel free to challenge my idea, I'm always open to a civilised conversation, write what you guys think in the comments.
MARKET CYCLES
The entire history of BTC looks astounding, and it only gets better from here. If you just look at the chart, you can see patterns that are very repetitive and predicatable, in a very good way. What you're seeing is just the beginning of BTC.
Just like any market, BTC goes through cycles, we're currently on the 4th cycle, and its going to do the same thing as before. You see, every cycle goes through 3 stages, the grey stage, green stage, and red stage.
If you look at very start of the chart, BTC starts off as grey, which is known as the consolidation stage, its going through a build up moment. After the grey stage, the price gradually goes up, and transitions to the green stage, thus starting a bull run.
Once it reaches an all time high, it will create a resistance. The price will then pull back, cooling down from ATH and then begin its next phase, the bear market, also known as the red stage. The red stage is the end of every cycle.
So it goes grey, green, and red, and it repeats itself in that sequence, just like traffic lights, think of the market cycles as traffic lights. Its done the same thing 3 times in the past 10 years, we're currently in the 4th cycle as mentioned previously.
As of today, we're still in the grey stage, and according to my calculations, the grey stage will end at around October, Q4. Once October ends, we will see new highs, the market sentiment will change and we'll see a bull market emerging, this is the proof I'm talking about. You have to ask yourself, name me one bear market that wasn't followed by a bull market?
FUNDAMENTAL POINTS
To spice up my analysis, I'm going to talk about the fundamental side of things. You see, the purple dotted lines in the chart shows the date of the BTC halvings, every time there's a halving, a bull run triggers, fundamentally. Mining rewards get halved every 4 years, that means supply becomes low and scarce, causing the demand to increase, when demand increases, price increases. The coin is hard coded in the system to make itself explode every 4 years.
There's one more fundamental point I want to make, its about the black line. Now, say what you want about bitcoin but what I'm about to tell you is a hard cold fact, there's no denying this. BTC's history is infamous. Cyber criminals used BTC to buy and sell drugs, as well as other illegal goods and services back in the early days of silk road, and is still being used to this very day except operated with a different marketplace. With that said, 5% of the total market cap of BTC is used for the dark net markets. BTC's dominance is currently $93,639,254,464, and 5% of that is $4,681,962,723, if you divide that by the circulating supply, you get 5% of the current price.
For reference, Here's my formula:
(BTC Dominance * 0.05) / (Circulating Supply) = Price of BTC in the Dark Net Economy
This is where the black line support comes from, and its price is sitting on a support line of $264, when people say BTC is going to 0, they have absolutely no clue, its hilarious, they're just speaking from emotion with no solid evidence. Its literally impossible for it go to 0 when there's an underground economy happening right under our noses. If bitcoin magically dies, criminals will still use it with or without you, thus creating that black line for themselves. The Dark Net has been around for a very long time, good luck trying to take it down, because the FBI can't do it either.
So there you have it, my TA and FA in one post. I place my bets on October, thats the timeframe I see when we transition into a bull market, I can't really put a price tag on it now but I know the next bull market is going to be insane, like literally mentally insane. The facts and figures are all there, its up to you to guess what you want the price to be, and it doesn't really matter because we're all going to be rich either way.
Thank you for your time ladies and gentlemen, I wish you all a fantastic day!
Twitter: @cyber_stocks
Discord: CyberStocks#9378
Join my favourite community on discord: discord.gg
Feel free to support me, any help is appreciated. All funds will directly support my personal finances, and most importantly, my mission of building an online brand :)
BTC Donations: 1AuZiofHSqM5gV1ttxUddNovDhEtHgMUgA
Longtermanalysis

Bitcoin Elliot wave analysis (Monthly outlook)In the chart I drove Elliot wave count on Monthly timeframe.
If wave count turns out to be correct, we might be in wave 4 at the moment. Strong support could be seen only at 1200-1400$ range.
If you look closely, we are forming U shape temporary bottom. Looking at MACD (-777.014) we might also see it bottoming out. Looking from psychological perspective it would also make sense to have a huge swing in BTC price action. If we indeed are slowly climbing towards 6k(ish), Fear of missing out would kick in and a lot of bulls could be trapped on the way up. Moreover, we would have enough energy to pierce through 2018 December low and land on Monthly support, which could be seen in chart.
I know it's a long way to go and we need to brake many levels before we could see 5800-6100$
Anyway, this is my take on Monthly Bitcoin price action.
Trade safely, good luck! BITSTAMP:BTCUSD

SP500 at end of growth? huge collapse to come? Long term vision When I fit the chart in the Fibonacci sequence, I conclude that it exactly fits in the sequence as how I show it here and as how my experience has learned me that charts behave concerning the Fibonacci sequence.
- The price went up from '0' to 700 points between 1980 and 1996 = Fibonacci 0% to 78,6%
- Than the price went further to 1200 points between 1996 and 2012 = Fibonacci 78,6% to 61,8%
- The growth continues further to 1600 points between 2012 and 2013 = Fibonacci 61,8% to 50%
- The growth continues further to 1900 points between 2013 and 2014 = Fibonacci 50% to 38,2%
- The growth continues further to 2300 points between 2014 and 2017 = Fibonacci 38,2% to 23,6%
- And the price broke 23,6% so it will continue rising till the sequence has ended!! and that is 3000 points!
> What will happen when 3000 points is reached? There are two options:
1: The price keeps on rising. Than potential = 4800 points !
2: The price collabs and retraces. Than potential = to fall back to 2300 / 1900 / 1600 / 1200 / 700
TARGET 1 NOW: 3000 points and take profit. So, short- term is LONG!
THAN WAIT
THAN MAKE A NEW PLAN: LONG OR SHORT for the long- term
Thank you for following and Succes with trading !
Richard from Rich.Exclusive.Trading

EURUSD H&S Right Shoulder FormingWith the Head and Shoulders pattern clearly making itself known, the signal to sell will be clear after price hits and respects the 1.19500 to 1.21000 zone as resistance, just like the left shoulder did. For now price and future of this pair is bullish and from there on out we will be looking to ride the price down.

[USD/CAD] Potential scenario Momentum up is not that strong, resistance is quite strong which means price is likely to reject and drop off.
This is what might happen:
- Price goes to 1.31
- Rejects at 1.31 and goes to 1.30, then 1.29 and further target to 1.275.

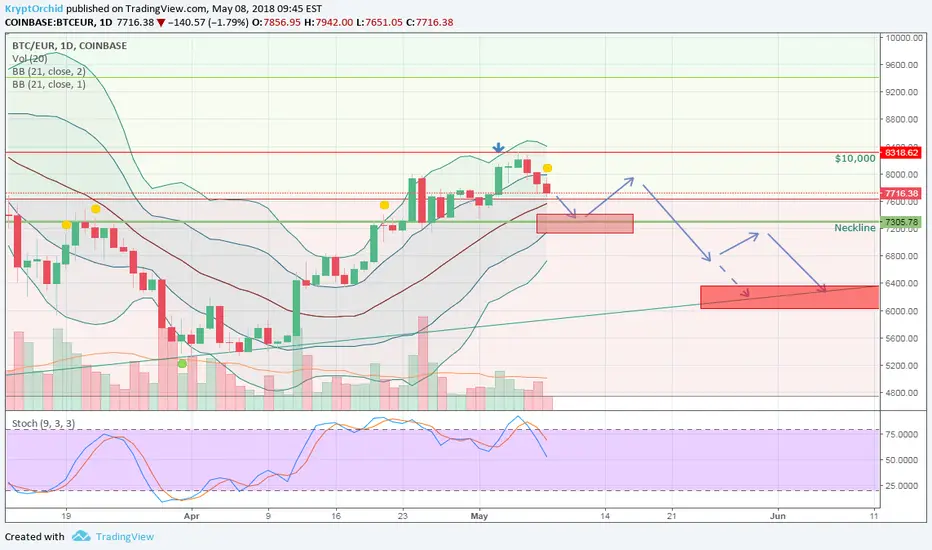
How deep are we going? I think deeper than many expect...I have now been thinking since the 12th that a retest of that Marabozu was needed before we could move higher. I did not expect to go as high, and I am highly suspicious of the neck-breaking pace of sentiment change in the space. Too many loudly bullish peeps out there for my liking, and this is an indicator as good as any other so I keep thinking this could turn into a lower low if the bears have it, and judging by the low volumes there are a lot of people waiting or hodling. I noticed today that the daily RSI has once more dropped below 60 which was a level we had failed to pierce since the 20th of Dec until this latest rise. This might signal a continuation of the downtrend.
The red area is the potential neckline of a H&S that would provide some symmetry and the outcome of that could result in either a retrace to the 0.5 fib of the recent leg up from the lows or a bounce back above $10k.
However, if we break down below that with force, we could continue to the pink box which would go some way to retracing that Marabuzo clearing the 0.236 fib and touching the long-term trendline in place since Jul 2017 on a linear scale. This would provide us with a stronger platform to punch through the $10k barrier. I am acutely aware of the parallels with the past and this scenario would provide an amazing launching pad to repea the 2013/14 pattern so we can head for higher highs before retracing all the way to the bottom trend line again.
The bearish case here is that we are retracing to the low trendline before we can reach ATHs again which is potentially $4,500.

Likely further downward correction at neckline...We're currently testing the 23.6% Fib support level, which if broken can cause the price to fall to the neckline. The second shoulder shouldn't top the first one. A further correction downward could face two possibilities, a rebound around the 2 stdev Bollinger band followed by a retracement once the 1 stdev Bol Band is hit, or straight to the lower trend line.
Retesting important long term channel resistance!
Just waiting to see if retests resistance one more time before entering in a short position.
SL 1.26000
going to let TP run until exhausted

S51! @ daily @ will auto shares outperfom `17 (after recovery) ?Take care
& analyzed it again
- it`s always your decission ...
(for a bigger picture zoom the chart)
Best regards
Aaron
