Technical vs. Fundamental Analysis: Finding a BalanceLooking to make more holistic investment decisions, but not sure how? Understanding the difference between technical and fundamental analysis and how to incorporate both is an essential step to accomplishing holistic investing. Today we will explore how finding a balance between these pillars of trading can help you navigate the complex world of investing.
The Importance of Finding a Balance
Finding the right balance between technical and fundamental analysis can be the key to successful investing. By combining the two approaches, traders gain a comprehensive understanding of a stock's potential, taking into consideration both the short-term market trends and the long-term value.
When it comes to investing, it's important to have a complete view of the market. Relying solely on technical analysis may leave you susceptible to missing out on crucial information about a company's financial health and growth prospects. Similarly, relying purely on fundamental analysis may cause you to overlook short-term market trends that could impact the stock's price in the near future, potentially leading to poor entries and exits.
A balanced approach allows you to leverage the strengths of both technical and fundamental analysis, providing you with a more complete picture of the investment opportunity at hand. So, whether you're a short-term trader or a long-term investor, finding the sweet spot between technical and fundamental analysis can help maximize your chances of making a profitable investment.
Understanding Technical Analysis
Technical analysis focuses on analyzing historical price and volume data to predict future price movements. Traders using this approach often rely on chart patterns, indicators, and trendlines to identify buy and sell signals.
Chart patterns, such as triangles, head and shoulders, and double tops/bottoms, provide insights into potential price reversals or continuations. These patterns are formed as a result of the collective actions of market participants and can signal impending price movements. However, when using price patterns it is critical to understand the statistical odds of success for completion of the pattern. Price patterns can be subjective to the trader's skill and overall directional bias, so traders should combine price patterns with other forms of technical analysis.
Indicators, such as moving averages, Relative Strength Index (RSI), and Bollinger Bands, help traders identify overbought or oversold conditions, measure the strength of a trend, and spot potential entry or exit points. When indicators are combined to form a robust and complementary system traders gain a wealth of information about the near-term health of an underlying asset. It is critical to note that no indicator system is perfect and will not guarantee you a 100% success rate. However, when paired with proper risk mitigation, psychology, and supporting forms of technical analysis, using indicators can lead to long-term success.
Trendlines are used to analyze the direction and strength of a stock's price movement. Drawing trend lines connecting the highs or lows of a stock's price can help identify support and resistance levels, price channels, and potential trend reversal areas.
Support and resistance zones are price levels on a chart that indicates where trends are likely to pause or reverse. Support is a zone where a downtrend pauses due to demand, while resistance is a zone where an uptrend pauses due to supply. These zones are based on market sentiment and human psychology, shaped by emotions such as fear, greed, and herd instinct. Traders tend to congregate near these zones, strengthening them. Support levels indicate a surplus of buyers, while resistance levels indicate a surplus of sellers. It's important to note that these levels are not exact numbers but rather "zones" that can be tested by the market.
Understanding how these tools work and how to interpret their signals is crucial for technical analysis. It allows traders to make intuitive decisions based on historical price patterns and market dynamics. However, it's important to note that technical analysis has its limitations.
Limitations of Technical Analysis
While technical analysis can provide valuable insights into a stock's potential price movements, it's important to recognize its limitations. Technical analysis is primarily focused on historical data and patterns, which may not always accurately predict future price movements.
Market sentiment, news events, and other external factors can significantly impact a stock's price, often rendering technical analysis less effective. If you don't believe me, just look at the price charts for the last four years. Try to pinpoint major world or domestic events such as the start of the pandemic or the Fed's hawkish shift. Additionally, technical analysis does not take into account the intrinsic value of a company, which is a key consideration in fundamental analysis.
Therefore, relying solely on technical analysis to make investment decisions may leave you vulnerable to market uncertainties and potential pitfalls. This is where fundamental analysis comes into play.
Understanding Fundamental Analysis
Fundamental analysis involves examining a company's financials, industry trends, and market conditions to determine its intrinsic value. Investors who lean towards fundamental analysis believe that a company's true worth is reflected in its financial strength and growth potential.
Key factors considered in fundamental analysis include a company's revenue and earnings growth, profit margins, debt levels, competitive positioning, and management team. By analyzing these factors, investors can assess whether a company is undervalued or overvalued, and make investment decisions accordingly. Most, if not all of this information is readily available on the internet, but it can take some digging to find all the information one would need. There is also a wide range of financial-related indicators readily available on TradingView.
Fundamental analysis also takes into account macroeconomic factors, such as interest rates, inflation, and government policies, which can impact the overall market and the performance of individual stocks.
How to Conduct Fundamental Analysis
Conducting fundamental analysis involves a thorough examination of a company's financial statements, such as its income statement, balance sheet, and cash flow statement. These statements provide insights into a company's revenue, expenses, assets, liabilities, and cash flows.
Analyzing financial ratios, such as the price-to-earnings (P/E) ratio, return on equity (ROE), and debt-to-equity ratio, helps investors assess a company's financial health and profitability. Much of this information is available on TradingView under the financials tab. TradingView has done an excellent job of making a majority of the aforementioned financial data available, right at your fingertips.
Industry analysis is another important aspect of fundamental analysis. Understanding the industry dynamics, competitive landscape, and market trends can provide insights into a company's growth potential and its ability to outperform its peers. There is a plethora of this information online, and diligence in your research will make a world of difference.
By combining financial analysis with industry analysis, investors can gain a deeper understanding of a company's overall prospects and make more informed investment decisions.
Finding a Balance Between Technical and Fundamental Analysis
Finding the right balance between technical and fundamental analysis requires a thoughtful approach. Here are some strategies to help you integrate the two approaches:
Start with fundamental analysis: Begin by analyzing a company's financials and industry trends to assess its long-term growth potential. This will provide you with a solid foundation for your investment decisions.
Use technical analysis for timing: Once you've identified a promising investment opportunity based on fundamental analysis, use technical analysis to refine your entry and exit points. Technical indicators and chart patterns can help you identify optimal times to buy or sell a stock.
Consider the bigger picture: While technical analysis focuses on short-term market trends, it's important to consider the long-term value of a company. Evaluate the fundamental factors that can impact a company's growth potential and use technical analysis as a tool to validate your investment thesis.
Keep an eye on market sentiment: Market sentiment can influence stock prices in the short term. By staying informed about news events, economic indicators, and market trends, you can better understand the context in which technical and fundamental analysis are operating.
By finding a balance between technical and fundamental analysis, you can better manage your investment decisions that take into account both short-term market dynamics and long-term value. This balanced approach can help you navigate the complex world of investing and maximize your chances of success.
In conclusion, understanding the difference between technical and fundamental analysis is crucial for making theoretically sound investment decisions. By finding a balance between the two approaches, you can gain a comprehensive understanding of a stock's potential, considering both the short-term market trends and the long-term value. So, whether you're a short-term trader or a long-term investor, incorporating both technical and fundamental analysis can help provide a better view and maximize your chances of making profitable investment decisions.
Happy Trading!
Longterminvesting

Bullish BTC count Elliott Wave - Time AnalysisThis is my bullish count for BTC !
Volume has to kick in very soon in this 3 wave!
After that a sideways 4th wave and a final shot to $200.000 in a 5th wave

Weekend idea 2: DCM Shriram can rise, investing can be idea wiseDCM Shriram Ltd. is a diversified company with business in agriculture, chemicals, plastics, cement, textiles and energy services. DCM Shriram CMP is 938.55.
The Negative aspects of the company are MFs are decreasing stake. The positive aspects of the company are No debt, zero promoter pledge, FIIs increasing stake, improving annual net profit, and Improving cash from operations annually.
Entry can be taken after closing above 969. Targets in the stock will be 1016 and 1066. The long-term target in the stock will be 1119. Stop loss in the stock should be maintained at Closing below 853.
The above information is provided for educational purpose, analysis and paper trading only. Please don't treat this as a buy or sell recommendation for the stock. We do not guarantee any success in highly volatile market or otherwise. Stock market investment is subject to market risks which include global and regional risks. We will not be responsible for any Profit or loss that may occur due to any financial decision taken based on any data provided in this message.

Weekend Idea 1: HDFC Bank rising from the bottom, can blossom. HDFC Bank Ltd. is engaged in providing a range of banking and financial services including retail banking, wholesale banking and treasury operations. It is one of the top banks in the country. HDFC Bank Ltd CMP is 1532.10.
The Positive aspects of the company are Low debt, zero promoter pledge, FIIs increasing stake, MFs increasing stake, improving annual net profit, and Improving cash from operations annually.
Entry can be taken after closing above 1536. Targets in the stock will be 1605, 1641 and 1675. The long-term target in the stock will be 1719 and 1758. Stop loss in the stock should be maintained at Closing below 1400.
The above information is provided for educational purpose, analysis and paper trading only. Please don't treat this as a buy or sell recommendation for the stock. We do not guarantee any success in highly volatile market or otherwise. Stock market investment is subject to market risks which include global and regional risks. We will not be responsible for any Profit or loss that may occur due to any financial decision taken based on any data provided in this message.

Tata Motors on Weekly Chart Looking Good for Mid Term InvestmentAre you looking for a Breakout Stock? It's right here.
What - Tata Motors on Weekly Chart
Why - Just Broke Out of Resistance.
How - I used Fibonacci Retracement to spot Exact Levels.
What's your view on this? Please share.
Contact 8130724243 for Stock Market Courses from NSE Academy. We are affiliated with Empirical F&M Academy and NSE Academy.
Hope this post adds valuable insights to your trading/investment journey.
Don't forget to share with your friends. (*Bcz as your friends join you will have someone like-minded with whom you can share and discuss and bring clarity to your learning and life.*)
***
Disclaimer:
Please note that this is only for Study Purpose and not a recommendation.
So please do your own research before investing in market.
#BreakoutStock #TradingStrategies #StockMarket #Nifty #chartpatterns #indicators

📈 AEGISCHEM: A Promising Investment OpportunityHello, traders!
Today, we're focusing on NSE:AEGISCHEM . Here's what's happening:
📈 Steady Upside Movement: AEGISCHEM is on a consistent upward trajectory, forming higher highs and showing signs of strength.
🔝 Breaking Previous Highs: It recently broke its previous high, which is a significant development.
🔍 Retest Opportunity: Currently, it's retracing and coming down to retest the support from the parallel channel, and I've marked a potential long position on the chart for your reference.
🚫 Not Guaranteed: However, keep in mind that trading is about high-probability entries, not guarantees. While this opportunity has great potential, always perform your due diligence.
🕰️ Investment Perspective: This isn't just a short-term trading play; it's an opportunity with investment potential. Take a closer look and consider your investment strategy.
📌 Important Note: This isn't a definitive investment recommendation. Make informed decisions and manage your risk appropriately.
🤔 Your Strategy: What's your take on AEGISCHEM? Are you considering it for your investment portfolio? Share your insights with us!
🚀 Stay Informed: Keep following for more trading and investment insights.
Best regards,
Alpha Trading Station 🌟

ARBITRUM Long term plan #NFAARB/USDT HTF or long TERM full plan based upon monthly & weekly time frame #NFA #DYOR

Ready to load some SOL on the coming monthsLooking for buying opportunities around $24 to $20. In case of a weekly close below $20 the price can drop to the next support at the $13,5 area. Very small chance to close below $12, in that case the bottom should be at $5 and i will go all in.
MACD shifting to the upside and RSI broke the diagonal resistance.
set alarms and DCA your way in.
HODL time: 3 to 12 months depending on where the bottom will form.

Why Bitcoin won't drop from hereHello Traders and Investors,
My name is Philip and I am a German swing-trader with over 4 years of trading experience.
I only trade the higher timeframes, preferably the monthly chart, because this allows me to capitalize on the major market swings.
I view trading as a long term game over the next 20 years which will help me to build massive wealth - it is not a get rich quick scheme.
-------------------------------------------------------------------
Today I want to share with you my outlook on Bitcoin:
In the beginning of 2023 Bitcoin perfectly retested the previous cycle high of 2018 and already perfectly rejected this key structure level towards the upside. Since we had a cross support at the $17.000 level, there is a very low chance of Bitcoin breaking below this level at all.
-------------------------------------------------------------------
Most of the people always follow the quick money. But the quick money is never the big money.
They think that making 5% a month consistently is reasonable, which is one of the reasons why so many traders fail.
The only think which you can control is your risk, everything else is unknown.
Keep your long term vision!

Nailing Market Bottoms with Precision! 🎯📉Cryptocurrency markets are notorious for their volatility, making it challenging to identify the perfect entry points, especially during bearish cycles. However, a game-changing tool has emerged, the Investor Tool BTC Indicator, renowned for its remarkable accuracy in pinpointing true market bottoms. In this post, we'll explore the incredible capabilities of this indicator and its astounding track record of never missing the mark. Its next target? A staggering $150,000 per Bitcoin!
Cracking the Code: Investor Tool BTC Indicator
The Investor Tool BTC Indicator is a cutting-edge tool designed to decipher market sentiment and identify optimal entry points.
What sets this indicator apart is its exceptional accuracy in recognizing the true bottom of a bearish cycle.
Unveiling the Power: How It Works
The Investor Tool BTC Indicator employs a complex algorithm that considers various market factors, sentiment analysis, and historical data.
Its unique methodology filters out market noise, providing crystal-clear signals during uncertain times.
The Unparalleled Track Record: Never Misses the Mark
Perhaps the most astonishing aspect of the Investor Tool BTC Indicator is its impeccable track record.
Historically, it has accurately identified market bottoms without fail, instilling confidence in traders and investors.
Setting Sights on the Future: $150,000 per Bitcoin!
With its uncanny ability to call market bottoms, the Investor Tool BTC Indicator has set its next target: a jaw-dropping $150,000 per Bitcoin.
Traders and investors are watching closely, eagerly anticipating this remarkable price milestone.
Leveraging the Indicator: A Game Plan
Timing: Keep a watchful eye on the indicator's signals and act swiftly when it identifies a market bottom.
Risk Management: Despite its accuracy, always employ sound risk management strategies to protect your investments.
Continuous Monitoring: Stay updated with the indicator's signals and be ready to adapt to changing market conditions.
In conclusion, the Investor Tool BTC Indicator has revolutionized the way we approach cryptocurrency trading by consistently identifying market bottoms with unparalleled precision. As it sets its sights on the ambitious target of $150,000 per Bitcoin, traders and investors are eager to capitalize on its next remarkable prediction. Remember to combine this tool with comprehensive analysis and prudent risk management for a well-rounded trading strategy. 🚀💰🚀

Apple #Apple stock is at 178.30-180.
In 2021 this price range - act as support
In my opinion it's a good deal to invest in #Apple right now, Christmas is coming, a lot of guys will buy new #iPhone15 and #iPhone15Pro
Pushing the price down from 197.07 to current price of 178 is a corrective action that will push the price higher as long as 171 -172 will act a serious support area
#stockmarkets #StocksToBuy #StocksInFocus #StockToWatch

$PYR Range & ChannelBeen trading NASDAQ:PYR (Vulcan-Forged) around this channel and range for several months now. Just thought I'd share (hi poker)
As of right now, strictly looking at PA, looks like a deviation on the upper channel until proven otherwise.
I have been & will continue to accumulate a large spot bag over the next 4-6 months (avg. entry is around $3.05, looking to buy more <$3 later this year) with the goal of selling this above $50 sometime over the next 2 years.
As always, let's see.

SUBEX, 1DSubex has given good breakout on both long and short time frame.
Good base formation at 30-32 level. stock can move towards 39 and 40.
If it sustains can go further towards 50-60.
Volumes are building and something good can be announced soon.
Company has lot of sectors including AI, Blockchain, security, tele communiction.
One should visit company site to understand more about company dynamics
It is only for education purpose not a recommendation.

The EMA200 on BTC's Weekly TF: A Simple Yet Powerful IndicatorIn the fast-paced world of crypto trading, it's easy to get caught up in a web of complex charts and countless indicators. While there's value in detailed analysis, sometimes less is more. This is particularly true for long-term investors, who often benefit from a more streamlined approach. One such straightforward yet impactful tool is the EMA200 on Bitcoin's weekly chart.
Why Higher Timeframes Matter
For those who invest with a longer time horizon, higher timeframes offer a clearer, less noisy view of the market. While day traders dissect every minute movement, long-term investors are more interested in overarching trends. In this regard, the weekly chart serves as a reliable guide.
The Significance of EMA200
As of now, Bitcoin is nearing its EMA200 on the weekly chart for the first time since March. This is a key moment for a couple of reasons:
Bullish Outlook: If Bitcoin stays above the EMA200, we could be looking at another bullish rally, similar to what happened last June.
Bearish Outlook: On the flip side, if it falls below this line, we might be entering a bearish phase, much like the period from June 2022 to early 2023.
The Power of Simplicity
The EMA200 simplifies complex market dynamics into a single, easily understandable metric. While lower timeframes can be influenced by short-term volatility, indicators on higher timeframes like the weekly chart have a greater impact on long-term price trends.
Risk Management & Disclaimer
Navigating the volatile crypto market requires a disciplined approach to risk management. It's not just about capitalizing on opportunities, but also about preserving your investment during uncertain times.
Please note that these are my personal observations and not financial advice. Always do your own research and consult a financial advisor before making investment decisions. However, you might want to consider following me for more of my observations
Happy trading, and may the trend be with you!

Bitcoin:Monthly chart ViewHi guys.
Hope you have had perfect trades.
In this idea i will share you some TA perspectives about
Bitcoin Longterm reactions according to historical datas.
As you can see each time the price reached the MA50 , made a
trough below it and then come back above.
Now we can se in Monthly chart that after price shaped
a Bottom under MA50 , it tries to come back above with a
Bullish Engulfing pattern.
after that we surpass MA50 with another white candle and now ,
Unfortunately we have some frauds in market.
(China Evergrande Group bankruptcy and Tesla sold
millions of BTC).
So in my opinion after a few weeks , Bitcoin start to continue
its smoothed run and go towards 36000.
its the level we will see at the end of 2023.
after that...
Lets see what will happen and dont predict far futures :)
If you like my opinion please tell me yours in comment.
Thank you all my friends

XAUUSD SHORTXAUUSD The Big Short is on the way expecting more down trend on gold thıs comıng week after a pullpack

INDIACEM buy for long term
NSE:INDIACEM for Long Term Buy above 193 , average till 188
Technical :
Entry Candle close above 193, average till 188
SL 180
T1 205
T2 223
T3 241
Trendline Breakout
RSI Bullish Divergence
Consolidated and created strong base

AAPL Longterm viewI’m looking for buying some shares at 160$,
as you can see, sellside liquidity was taken, which is my first confirmation, my second confirmation is displacement above the previous, i would like to see it retrace to 160$ or lower, which sits below 0.5 fib AKA discount zone, anything there is buying zone for me.
This is purely technical analysis, since i believe in this stock.

Indian Railway Finance CorporationCompany is a funding arm of the Indian Railways for mobilizing funds from domestic and overseas Capital Markets. IRFC is a Mini
Ratna I and Schedule A Public Sector Enterprise under the admin control of Ministry of Railways, Govt. of India.
Clientele: Company extends loans to other entities of MoR, viz., Rail Vikas Nigam Ltd and IRCON International Limited.
We should take a little quantity at very decent dip. But RSI indicating stock trading in over bought zone so we should wait to take fresh entry till cool of the stock. It is my point of view according my analysis it is not any recommendation so be safe and do your study before the investing.
#longterm #Fundamental #technical #Penny stock #PSU

LTC: LONG TERM VIEW! BEST BUYING ZONE!!Hello everyone, if you like the idea, do not forget to support it with a like and follow.
Welcome to the new LTC update.
Today is LTC's halving and this might be the sell-the-news event. According to the chart, it is forming a symmetrical triangle in the weekly time frame and rejecting the resistance zone of $100-$120. I'm expecting it to drop more from here.
IMO, the best buying area for LTC is around the $60-$70 level. We have support here and also here the lower line of the symmetrical triangle lies.
Once it breaks out from this symmetrical triangle a new bullish rally starts for LTC and do not expect this before a proper bull run.
Hope this chart helps you. If you like this idea then do support it with like and follow.
Also, share your views in the comment section.
Thank You!

The Power of Dollar-Cost AveragingThe Power of Dollar-Cost Averaging: Building Wealth Gradually
Introduction
In the world of investing, there's a powerful strategy that enables individuals to build wealth over time without the need for market-timing skills or significant capital: dollar-cost averaging (DCA). This method involves investing a fixed amount of money at regular intervals, regardless of market conditions. In this blog post, we will explore the concept of dollar-cost averaging and how it can be a valuable tool for building wealth gradually and with discipline.
Understanding Dollar-Cost Averaging
Dollar-cost averaging is a disciplined investment approach that involves investing a fixed dollar amount in a particular asset or investment vehicle on a scheduled basis, such as weekly, monthly, or quarterly. The key feature of DCA is that the same amount is invested consistently, regardless of whether the asset's price is high or low.
The Power of Consistency
Reducing Market Timing Risk: Dollar-cost averaging eliminates the need to time the market, which is notoriously difficult even for seasoned investors. By investing regularly, you spread your purchases over different market conditions, reducing the risk of making ill-timed investments.
Taking Advantage of Market Volatility: DCA allows you to purchase more shares when prices are lower and fewer shares when prices are higher. Over time, this strategy can lead to a lower average cost per share.
Embracing Disciplined Investing: Dollar-cost averaging promotes disciplined investing habits. It encourages you to stay committed to your investment plan regardless of short-term market fluctuations.
Building Wealth Gradually
Regular Contributions: Set a consistent schedule for investing, such as monthly or quarterly contributions. This habit ensures that you continually add to your investments over time.
Automate Your Investments: Automate the investment process by setting up automatic transfers from your bank account to your investment account. This reduces the temptation to deviate from your plan.
Stay the Course: Remain patient and steadfast during market ups and downs. Stick to your dollar-cost averaging plan, as its true power lies in its long-term impact.
The Magic of Compounding
Dollar-cost averaging harnesses the magic of compounding, where reinvested returns generate additional returns over time. The longer you maintain your dollar-cost averaging plan, the more significant the compounding effect on your wealth.
Conclusion
Dollar-cost averaging is a time-tested and straightforward strategy for building wealth gradually and with consistency. By investing regularly and without the need to time the market, you can overcome the pitfalls of emotional decision-making and take advantage of market volatility.
Embrace the power of dollar-cost averaging as your ally in wealth-building, and watch your investments grow steadily over the years. Remember, the key to success is to start early, stay committed, and let the power of compounding work its magic on your journey toward financial prosperity.
Happy investing, and may your disciplined efforts lead to a brighter financial future!

The Power of PatienceThe Power of Patience: Long-Term Investing
Introduction
In the fast-paced world of investing, where market volatility and hype can easily sway decisions, there's one timeless lesson that stands the test of time: the power of patience in long-term investing. In this blog post, we will explore the significance of adopting a long-term investment approach and the benefits it offers to investors who embrace patience as their ally in wealth-building.
Understanding Long-Term Investing
Long-term investing is an investment strategy focused on holding assets for an extended period, typically years or even decades, to capitalize on the power of compounding and ride the wave of the market's long-term growth. Unlike short-term trading, which aims for quick gains, long-term investing takes a patient and steady approach, emphasizing fundamental analysis and faith in the underlying value of assets.
The Benefits of Patience in Long-Term Investing
Harnessing the Power of Compounding: Patience allows investors to benefit from the magic of compounding, where investment returns generate additional returns over time. Compounding can significantly amplify wealth accumulation, especially when reinvesting dividends and capital gains.
Weathering Market Volatility: Financial markets are inherently volatile, with short-term fluctuations driven by various factors, including economic news and geopolitical events. By staying patient and maintaining a long-term perspective, investors can ride out market fluctuations without being swayed by short-term noise.
Reducing Transaction Costs: Frequent trading incurs transaction costs, such as brokerage fees and taxes, which can eat into returns. Long-term investors minimize these costs by holding assets for more extended periods, leading to better overall returns.
Opportunity to Invest in Growth: Long-term investors have the luxury of being less concerned about short-term market movements. This freedom allows them to invest in growth-oriented assets and industries with the potential for substantial long-term gains.
Benefiting from Dividends: Patience pays off when it comes to dividend investing. Many established companies offer regular dividends to shareholders. By holding on to these stocks for the long term, investors can enjoy a consistent income stream.
Keys to Successful Long-Term Investing
Invest in Strong Fundamentals: Focus on companies with solid financials, strong management teams, and a competitive advantage in their industries. Fundamental analysis provides insights into the long-term viability of potential investments.
Diversify Your Portfolio: Diversification is a critical risk management tool. Spread your investments across different asset classes, sectors, and geographies to reduce the impact of individual asset volatility on your portfolio.
Avoid Emotional Decision-Making: Emotions can lead to impulsive decisions in the face of market fluctuations. Stay committed to your long-term investment plan and avoid making knee-jerk reactions to short-term market movements.
Regular Portfolio Review: While long-term investing involves holding assets for years, it's essential to periodically review your portfolio's performance and reassess your investment thesis.
Conclusion
Long-term investing with patience as its cornerstone is a time-tested strategy that has proven successful for countless investors over the years. By embracing the power of compounding, weathering market volatility, and staying committed to sound investment principles, patient investors have the potential to build substantial wealth and achieve their financial goals.
So, take a deep breath, adopt a long-term perspective, and let the power of patience work its magic on your investment journey. Happy investing!

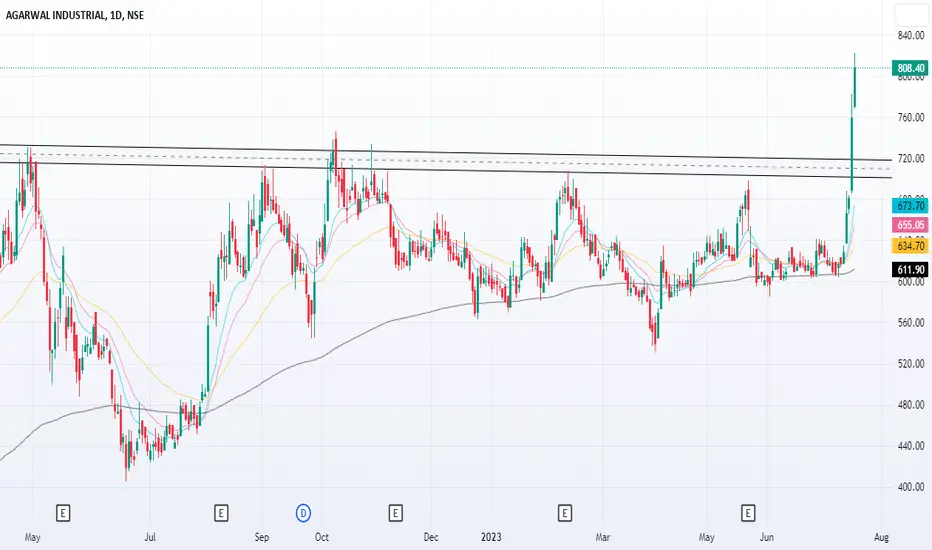
Agarwal Ind looks goodAgarwal Industries looks strong.
I missed entry into it, and hence will wait for a good entry point.
This stock is good for long term as portfolio as well.