LRCUSD heating up! $8.00 on sight!Loopring (LRCUSD) has seen the strongest rise of the top 100 market cap coins in the past 24hours and is currently testing not only the 1D MA100 (green trend-line), which has been intact since January 08, but also the horizontal Resistance that is holding since January 20.
I've posted the very same LRC chart about two months ago and seems to be coming to fruition:
The last time a similar Resistance level was tested, was during the previous Accumulation Phase of November - December 2020. Once the Resistance broke (accompanied by a 1D MA50/100 Bullish Cross), LRCUSD had a very aggressive two-day rally and entered a strong 1.5 month bullish stretch. Even the 1D RSI sequences of today and then seem fairly similar.
Technically, if the price breaks those two Resistance levels, and since LRC has been trading within a Fibonacci Channel since early 2020 that has been making each High on the higher Fibonacci extension level, then the natural long-term target would be the 2.5 Fib ext. However we often see a tendency to face Resistance on the previous Higher Highs trend-line and that currently is the Fib 2.0 ext. We thus view the $8.00 - $10.00 range as a realistic long-term target zone.
--------------------------------------------------------------------------------------------------------
Please like, subscribe and share your ideas and charts with the community!
--------------------------------------------------------------------------------------------------------
LRC

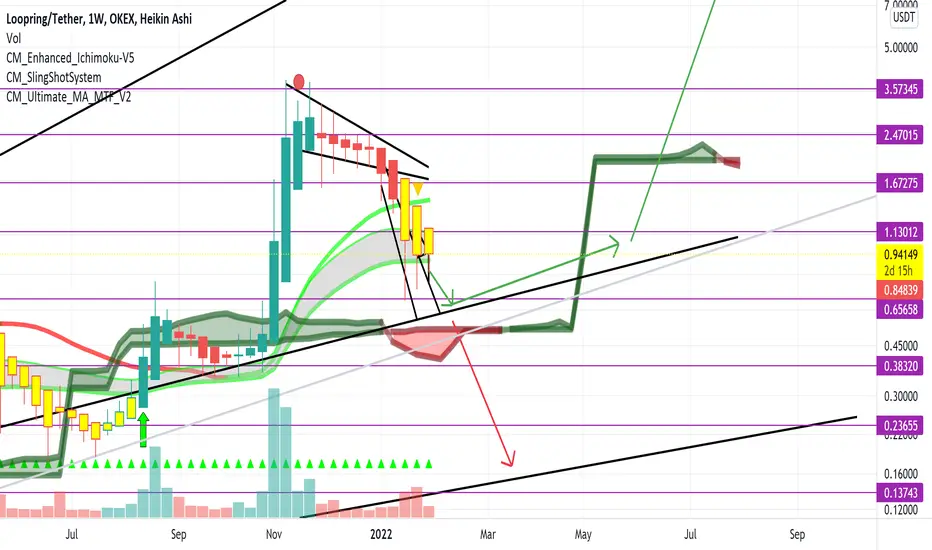
Loopring LRC token price predictionLoopring LRC token price prediction as per me, this buy is a trap for the buyers, so there is rejection here and it will drop from here even it has huge volume.

LRC USDT Binance - go to the 3-4 USDT at this 10-20 days part 2LRC USDT Binance - go to the 3-4 USDT at this 10-20 days part 2 what do you think about it?

LRC is on the Fibonacci area! Long should take overThe best price to take a safer Long position is around the last reaction area.
As you may see at my chart, we need to be patient a little while before Long take over.
Good luck and follow for more!

LRC/USDT BUYING SETUP LONGLRC Retest resistance become support after breakout Descending Triangle pattern
MACD Showing Bullish crossover on Daily
Potential continue upward movement 🚀
Target mentioned in the chart
Stoploss : $0.78
Risk : 5%

LRC/USDTesting/tracking elliot wave theory. Please do not trade off idea without S/L. Not financial advice.
Link to previous chart:
We went further down than the predicted yellow line and way deep into the price territory of wave (1). It seems that LRC has bottomed out and we should be accumulating here for a bit. The white line might play out and be similar to the previous accumulation period. The time will be a lot less imo as there is much more hype around the coin this time.

LRC.Usdt (Y22.P1.E1).Reversal signal Hi All,
We have early signs that BTC can be reversing to a bullish stance and its coincides with this structure to break out bullish.#LRC #Loopring
We have the resistance trend line breakout + the structure and we have the fib level.
All giving some potential bullish stance.
Please give me like and share.
Regards,
S.SAri

Buying and Selling Area for LRCLRC is getting hot !
Apreciate doble strongest support MA 1000 with past strong resistance.
You may enter in the green zone !

A new cycle, up to 900%On weekly chart, COINBASE:LRCUSD has been downing over 80% from ATH on Nov 2021. This pullback is the same last times and rally after that.
So we have a big chance to take profit at least 70% and risk 20%, of course.
The extended target at around $7.
Time will tell
If you like my idea, help me by hit a button like. Appreciate!

LRC I stepped away for a bit and came back to my chart with some slightly different outlooks and ideas.
Still think we will touch trend once more, and I dont think we will repeat history and drop below trend before resuming an uptrend. Some people are calling for 50 cents, we cant see that, but we do think the next month will be red-ish/sideways.
Seems to me like august will be the area to resume a bull trend and until then we slowly creep upwards under 2 dollars..


LRCLike previous posts - look at larger picture.
LRC close to coming back to major trend.
'oversold' on low volume, close to reversal and a great time to long.
I am expecting lrc to be back at 4 dollars this august, maybe even sooner if they finish product on time.

LRCLrc continues to breakdown over and over - even with all the good news.
My sentiment stays the same and am Still looking for a return to large tend at 60ish cents.

Loopring set to blast (if not then invalidation is close)Loopring #LRC has sold off sharply and now has returned to its support. The chart tapped the diagonal trendline three times. Three taps have preceeded major increases in value in the past for example for ATOM or ETH. Idea is invalidated if chart closes below its recent daily low. Best wishes

LRC possible Ascending TriangleHello Traders and Happy Valentines Day!
I hope you all enjoyed the Super Bowl game! I am from Detroit so this was great for me as it is probably the closest we will get to seeing a Super Bowl! Thanks Stanford, you deserve it!
Analyzing Loopring we are hoping to see a formation of an ascending triangle. The last swing down presented a small amount of bullish divergence on the MFI on a daily time frame which often sends the price in the opposite direction reversing the trend.
Of course this is only possible if the lower ascending trend line holds and price bounces from this line growing above the top resistance and holding it as support. Trading this pattern you’d want to look for volume growth of buyers coming in every time the price bounces off the lower ascending line. You can enter this trade in two areas. Both labeled on the chart. Entering at the bottom of the structure at the first labeled entry will get you a greater risk to reward within the trade. Adding to your trade after the break of the upper resistance is how I generally approach this pattern.
One thing to note is this pattern will often present a false breakout of the top of the pattern as shown here. Keep this in mind when measuring the target which is just the distance of A to B added to the top of the pattern when and where the price breaks out.
Generally this pattern is a continuation pattern yet, can be found in reversals also.
Best luck with this trade and I hope this information has helped you understand this pattern better.
Savvy

LRC/USDT - Pending sell order #FUTURES x20Pending sell order.
After reaching the price of 0.9295, open a position for 2% of the deposit, with 20x Leverage
Target and stop loss indicated on the chart

LRCSmall hourly formation potential to break if it does looks like a head and shoulders, which would take us to 1.6x area.
If not we come back to the base.

LRC USDT Binance - go to the 3-4 USDT at this 10-20 daysLRC USDT Binance - go to the 3-4 USDT at this 10-20 days

Lrc trendsWe still haven't come back to touch major trend yet. Everyone feels very bullish right now, but we Still have a strong possibility of rejection here.

LRC Potential Formation ?LRCUSDT | 4H Timeframe
Scenario potential, all things being equal.
Follow @cryptonkidd for my picks and trades.

LRCETHmonster obv bullish divergence forming
nearing completion around here
id expect a volotile move up (rocket emoji)
when this thing moves up out from that downtrend :)
zk rollupseason?

Take profits @0.92 or @1.05 or SL @0.81LRC has been confirmed as partner to GME, though this news has not caused any massive moves whatsoever. I sense a huge dump incoming, people being disappointed by the lack of a reaction to such an important event.
But what do I know? I'm nobody. Don't take this as advice because you can't sue me.
I hope it increases at least between TP1 and TP2, though I see no future past TP2.

Weekly Still HoldingWeekly still holding right now.
Looking for good news to bump this up.... but we are still waiting on Bitcoin. It looks more and more like we are waiting for bitcoin to give the thumbs down for more pain.. or two thumbs down for max pain (Full bear market).