#LTC/USDT#LTC
The price has been moving in a descending triangle since the beginning of 2022
We are about to break that downward channel
And also the moving average broke 100 upwards
Current price 70.77
First goal 88.14
The second goal is 113.45
LTCUSDT

Ltc 20% ProfitLtc has surges 20% profit after hitting our marked fvg area. A perfect example of bullish FVG.

LTC/USDT 8HInterval Chart ReviewHello everyone, let's look at the LTC to USDT chart taking into account the 8H time frame. As we can see, the price is moving above the local upward trend line.
Going further, you can see the price fighting in a strong resistance zone from $102.33 to $115.12, when we break out of this zone, we can see an increase to the resistance level of $131.40.
Looking the other way, you can see the first support at the level of $91.29, the next strong support is at the level of 77.73, and then it is worth defining the zone from $68.23 to $56, which previously held the price.
Looking at the RSI indicator, we see that it is moving towards the upper limit, with room to make another upward move, but at this point it is worth being cautious before a potential rebound. However, the STOCH indicator bounces from the upper limit and subsequent raises result in a higher price movement.

LTCUSDT 1W LONG📈Hi all. Timeframe 1 week. LTC is fluttering in the accumulation channel near key support. There is a pressure applied to the resistance of the triangle. A decline to the 52.39 zone is unlikely, so I am considering recruiting to the spot from the current ones. Also long/futures during channel breakdown/retest. Marked goals and levels on the chart.

LTC/USDT - Long term view | Buy now and HODL #LTC/USDT #Analysis
Description
---------------------------------------------------------------
+ The LTC price has decisively broken out from the resistance line and is now heading towards the next resistance level.
+ In the previous bull run, we observed a similar pattern that resulted in substantial profits for traders.
+ I anticipate a comparable pattern emerging in this bull run, indicating the potential for significant profits with this trade.
---------------------------------------------------------------
VectorAlgo Trade Details
------------------------------
Entry Price: 102
Stop Loss: 62
------------------------------
Target 1: 142
Target 2: 180
Target 3: 226
Target 4: 389
------------------------------
Timeframe: 1W
Capital Risk: 1-2% of trading capital
Leverage: 3x
---------------------------------------------------------------
Enhance, Trade, Grow
---------------------------------------------------------------
Feel free to share your thoughts and insights.
Don't forget to like and follow us for more trading ideas and discussions.
Best Regards,
VectorAlgo

Wanna Hold and Wait? Allright, #LTCLTC was a dead coin for a long while despite the fact that it's one of the most valued products on the market.
After the recent LTC Halving, LTC Destroyed most of its investors. I was one them and I've been waiting since the last crash (17 August).
Time for vengeance is about to come. Wait until it closes above 106 in a daily time frame.
Buy and wait.
Targets: 124,8-161,4.
Good Luck To Us All.

LTC BIG TARGETLTC is at a verge to breakout , if it breaks i have marked the target clearly and we may see up 50% Pump soon in this #DYOR

Ltc ideaLtc chart is very bullish from couple of days and it did breakout of previous high and formed bullish structre now. Thats ehy i will look for long oppertunity. I got my long long oppertunity in fvb+ob area which is marked onto the chart. Whats your opinion?

LITECOIN! Potential Inverse Head and Shoulders on 1HR Timeframe.LTC showing an interesting pattern on 1hr timeframe. Making an inverse head and shoulders with neckline in $87 level. Break above $87 it might run up to $97, i'll set my final tp at $95. Hopefully bitcoin approves this. #NFA

LTC | 3 Digits Again LTC/USDT has shown a significant breakout above the trendline resistance on the 4-hour timeframe. This breakout suggests a potential bullish move in the short term, possibly ranging between 15% to 30%. It's important to note that these observations are not financial advice, and it's recommended that you conduct your research (DYOR - Do Your Own Research) and consider all factors before making any trading decisions.

Litecoin Reversal: Case for a Bearish Head and Shoulders PlayHello everyone, I'd like to share with you my current outlook on the Litecoin market, based on the technical analysis of the LTC perpetual futures contract. I've identified a formation that prompts some caution: a potential Head and Shoulders pattern that's taking shape on the daily chart.
This technical indicator is traditionally interpreted as a precursor to a bearish reversal. You can see here the central peak, which is higher—that's the head—and the two other peaks, roughly at the same height, are the shoulders. This pattern is confirmed by decreasing volume, which bolsters my belief in an upcoming trend reversal.
Therefore, my strategy will be to set up a short position as soon as we see a convincing breakdown of the support level, which is just below the current price. I've set my downside target at around 60 USD, down from the current level of about 97 USD. This potential profit zone is clearly marked here in red.

LTC IS READY FOR A MASIVE MOVE!🚀CRYPTOCAP:LTC has recently bounced from its long-term support level which has held for 1900 days, as indicated by historical price interactions. It has broken out of the symmetrical triangle pattern and is currently being it, with $78 serving as support. In the past, when it previously broke out, it bounced around 500%, so we can expect a similar move this time too.
During this anticipated movement, it's important to note that there will be resistance at the $135 level, as well as the all-time high (ATH).
#DYOR #NFA

Cryptolean Litecoin LTC UpdateIn the daily LTCUSD chart, in the beginning of the week, Litecoin had a fake-out to below $80.43 into the daily range zone.
However, it recovered strongly, re-confirming $80.43 as a support.
The current price action in Litecoin is very interesting as it is testing the key daily resistance of $88.82-$92.07.
A bullish break-out of $92.07 is needed to have a rally towards $100.
A bearsih rejection of the key daily resistance of $88.82-$92.07 will lead to a re-test of $80.43.

LTC is forming a Head and Shoulders patternLTC is rising to the $95-$100 price range to form a Head and Shoulders pattern in the D1 time frame.
If the scenario is correct, LTC will then fall to the $55-$68 area or lower

Dinosaur Coins - LTC, IOST, ENJ and ICX - BIG Move ComingMartyBoots here. I have been trading for 17 years and I am here to share my ideas with you to help the Crypto space. The Bull market is here
Dinosaur Coins - LTC, IOST, ENJ and ICX - BIG Move Coming
If you understand market structure then you would see that these coins have great potential for a move higher . The all look to be setting up for a move in the near future . The bull market is here so do not sleep on these coins .
Please watch the video for more information

LTCUSDT Elliott Waves Analysis (Investment idea)Hello friends.
Please support my work by clicking the LIKE button👍(If you liked). Also i will appreciate for ur activity. Thank you!
Everything on the chart.
Closest target: 200 - 400 - 800
Main(investment) target zone: 750 - 1000$
Cancellation of setup - decreasing under 40
RR: 1 to ~20
risk is justified
Good luck everyone!
Follow me on TRADINGView, if you don't want to miss my next analysis or signals.
It's not financial advice.
DYOR!

[LTCUSDT] - very similiar scenario🔥LTC raised 600% in previous bull run after breakout .
we can notice in weekly chart that the same scenario repeat it's self.
successfull retest must be considerd to get 400% up.
so must keep it in ur watchlist.
don't forget to support us with ur like, comment and follow for more updates🎯

LTC down $50-$55 or $35-$45According to historical data, I fear that LTC will return to the 35-45 USD or 50-55 USD zone. What do you think about this?

LTCUSD 1WLTC ~ 1W 📈
#LTC Make purchases in stages from here, minimum target 25%. 🔼 Bulls will continue to Dominate as long as price is above this Resistance Line.

LTC: buy-low .. sell-high📊Analysis by AhmadArz:
🔗"Uncover new opportunities in the world of cryptocurrencies with AhmadArz.
💡Join us on TradingView and expand your investment knowledge with our five years of experience in financial markets."
🚀Please boost and💬 comment to share your thoughts with us!

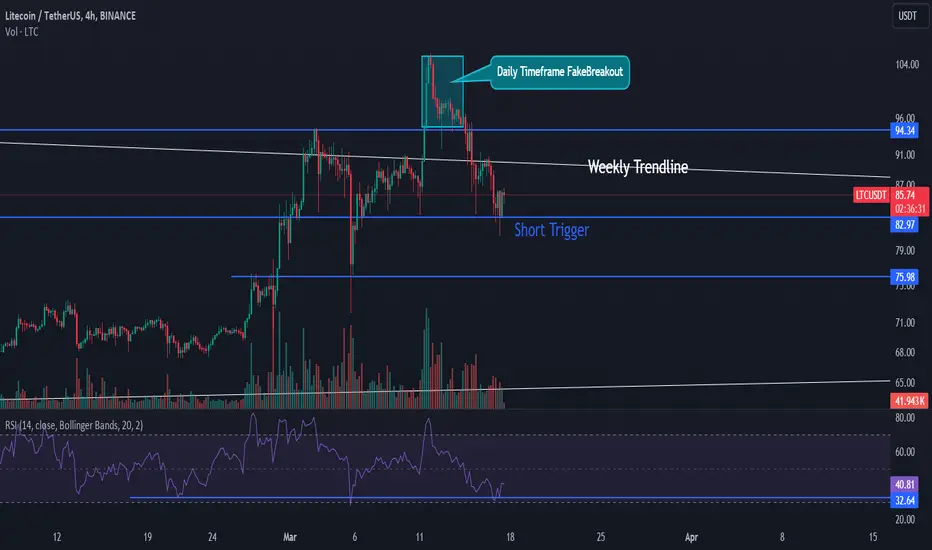
📈LTC Analysis: Short Position Opportunity in Volatile Market🔥🔍Today, we are focusing on analyzing LTC for future prospects. It's worth noting that it's Monday, typically associated with lower market volume and increased market volatility.
🔒On the 4-hour timeframe, we find ourselves within a trading range, with the resistance ceiling at $94.34 and the support floor at $82.97. A recent rejection from the upper boundary suggests that sellers have more strength compared to buyers. Thus, initiating a short position could be a more secure move.
📉In case the $82.97 support level is breached, entering a short position with a target price of $75.98, accompanied by a well-defined stop-loss, could offer a minimum risk-reward ratio of 2.
💎The SMA7 indicator has converged with the price, potentially signaling further downward momentum. If the SMA7 fails to maintain the trend, we'll wait for confirmation from the SMA25. Failure on both indicators may lead to a sideways movement, possibly retesting the upper boundary of the trading range. 📊In the recent downtrend, the volume of red candles has diminished compared to the initial wave. While this could be attributed to the typically lower trading activity on Sundays, a resurgence in volume from tomorrow onwards is essential. Failure to observe increased volume could indicate weakness in the trend.
💥 Additionally, the RSI oscillator provides a critical support level at 32.64. Simultaneous breach of the $82.97 support level and the RSI support could serve as another confirmation for a short position.
❌In conclusion, vigilance is paramount today. If the short position trigger is breached or if setting a large stop-loss to avoid unnecessary risk or setting too small a stop-loss to quickly hit the target, it's crucial to maintain a balanced approach.
🧠💼It's important to acknowledge the inherent risks in futures trading, with the potential for margin calls if risk management is neglected. Always adhere to strict capital management principles and utilize stop-loss orders, ensuring that the initial target offers a risk-to-reward ratio of 2.
Cryptolean Litecoin LTC Update Litecoin found a support at $80.43, the key daily support zone, and we see a bullish reaction from this level.
A bullish reversal from $80.43 is likely, assuming we see bullishness back in CRYPTOCAP:BTC , and will result in a move to re-test $88.82-$92.07.
A bearish break-out of $80.43 will push #LTC price lower towards $73.31, however the price action may be slow and choppy.
Intraday Chart
The LTCUSDT 4-Hour chart is neutral and moving to the key intraday resistance at $87.89.
A bearish rejection of $87.89 will lead to Litecoin price declining to $80.29, the key intraday support.
A bullish break-out of $87.89 will push price to re-test $91.97 and, possibly, higher to $96.84-$100.31, where the price action will be very important.
Support once read!
Thank you.

LTC: Double bottom reversal coming!The price of LTC has formed a double bottom, and we may soon witness a big breakout to the upside! If you're looking to trade LTC at the moment, here's a quick setup that you might find helpful!
The idea is: Buy when the price breaks above 106$ and take profits at the levels shown in the chart.
Targets:
1. 112$
2. 120$
3. 120$
-------------------------------------------
About our trades:
Our success rate is notably high, with 10 out of 11 posted trade setups achieving at least their first target upon a breakout price breach (The most on TW!). Our TradingView page serves as a testament to this claim, and we invite you to verify it!
