Lumen

XLM USDNotice the pattern I've mapped out and the similarities we're seeing. Not just in the pattern but the moving averages and the volume as well.
This move we have coming is going to be BIG. Don't sleep on this one.
HODL, STRENGTHEN POSITIONS AND PROFIT!
This is not financial advise and I'm not a financial advisor. DYOR before you invest in anything.
Please like, comment & follow!
Thanks

XLMUSD completing bullish Gartley | Upto 108% profit possibilityHi friends, hope you are well and welcome to the new update on Stellar.
On 2-day, the price action of XLM the is completing the final leg of bullish Gartley and soon it will be entered the potential reversal zone. There is also a good support of 50 simple moving average beneath the buying zone.
Possible profit and loss ratio:
This trade has a huge profit possibility up to 108%, and the loss possibility is only 23%.
Note: Above idea is for educational purpose only. It is advised to diversify and strictly follow the stop loss, and don't get stuck with trade.
For exact buy and sell targets for this trade, and other harmonic trading signals you can join:
www.patreon.com

Stellar PatternSpinning top on D1.
important to notice that pattern and finish this daily candle to analyse more and try to detect a way.
Happy Tr4Ding !

XLMUSD: Example of Long TradeThe price bounced from the support zone. RSI confirmed the price reversal. If the price breaks the local downtrend line, it will be a bullish signal in the direction of the main bullish trend.
Here is an example of a possible long trade.
Disclaimer!
This post does not provide financial advice. It is for educational purposes only! You can use the information from the post to make your own trading plan for the market. But you must do your own research and use it as the priority. Trading is risky, and it is not suitable for everyone. Only you can be responsible for your trading.

XLM/USD Lumen-StellarXLMUSD is now inside the triangle. If the important level of 0.087 is broken and consolidated above, we will see a good upward movement to 0.10+.
Why XLM can grow? If we look at the XLM / BTC chart, we can see how the historical low price was reached. A falling wedge has also formed at the bottom, which we broke yesterday with an upward movement. We are now above the support line. Volumes are growing, investments are in progress.
Best regards EXCAVO

XLM/BTCFalling wedge - one of the bottom options
All-time low
Volume - $144,702,998
XLMUSDT D1
good potential for growing
1H
Best regards EXCAVO

#XLM promising long-term#XLM is essentially a Ripple derivative. The tasks are the same, the execution is more interesting in terms of code, there is even an admixture of the possibility of using Lumen as a platform for ICO🍯In general, the situation with long-term investment is identical🕵🏻♂️

XLMUSD A Move Upto $0.115 Is Expected In Next Few DaysHey, friends hope you are well and welcome the new update on Stellar.
The price action of Stellar has started the completion of handle and after this completion, the formation of Inverse Cup & Handle pattern will be completed. The XLM has also a strong price level resistance at $0.115. Therefore the rally can be up to this level.
On daily chart the price action of XLM was moving in a down channel. Recently the price action broke out the resistance of this channel. But the volume is very low. Therefore the price action is retesting the previous resistance as support. In the meanwhile, the priceline of Stellar has also crossed up exponential moving averages with the time period of 10 and 21. And EMA 10 is also crossing up the EMA 21. Now these EMAs and the bull cross between them can be helpful for the priceline to start the next rally to the up side.
On the same daily chart it can be observed that previously the priceine of Lumens broke down the simple moving averages with the time period of 25, 50, 100 and 200. Now the price action has broken out the 25 SMA and moving with 200 SMA. The SMA 50 is also moving down to form a death cross with 200 simple moving average that can be coz of more sell off.
On the long term weekly chart, the price action of Lumens is like to have a very nice bounce from the support of a rising wedge pattern. Here the support of 50 SMA can be seen exactly at the same level where the XLM has the support of wedge. The 25 simple moving average is moving up to form a bull cross with 100 SMA and this bull cross is the reason that the sell off is not getting increased due to upcoming death cross between 50 SMA and 200 simple moving average on daily chart. If we take a look at the MACD indicator then it has started turning bullish. The stochastic oscillator has also entered in oversold zone. Now if the stochastic will also give bull cross from here the price action can turn strong bullish. Then we can expect the rally in next few days upto the resistance of rising wedge. This resistance is at almost $0.115.
Conclusion:
The price action has very good supports from daily to weeky chart. However the breakout from the channel on daily chart is not backed by the strong volume. Therefore the price action is re-testing the previous resistance as support. Incase of failure in re-testing the price action may re-enter in previous channel. However sofar I am expecting a rally upto $0.115 in next few days.

XLMBTC - Consolidation in historical support zoneIt takes a long time and the current range has been able to support the price well. MAs and oscillators have promising signs on 4H and 1D.


XLM/USDStellar XLMUSD
Forming falling wedge - reveral pattern
RSI- oversold
Target 23.6-38.2% level fibonnacci
Best regards EXCAVO


XLM - Stellar XLMUSD moving inside the uptrend channel. We touched the support line of the channel and start growing with volume.
Also, inside this channel, we can see the formation of an inverted head and shoulders.
Best regards EXCAVO

XLM Upgrade but the same idea)) So as we can see nthng changed.
Still we are going up through correction.
Keep your i on the first prize.
BTC will show us a dirrection.

XLM The same idea as previous So. News was hot. Btc went higher as expected. So thats why i wrote in small cap alts @warning@ and @waiting for news@
So thats it! news is. We will se high price. and a correction on btc. Then alts sale. Be ready to Buy.
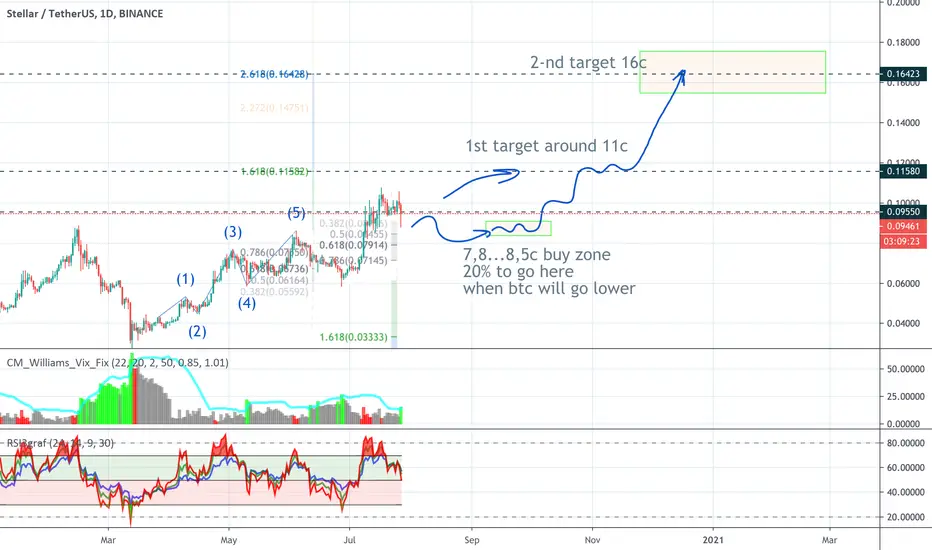
XLM REMIND/ Next move is soonTarget 11.3 + ....
i draw prev a mid range waves to 16+ cents.
but first 11.3 +
waiting.

Stellar Lumen XLMForming a bullish symmetrical triangle
I see growth potential up to 1200-1400 satoshi first
Best regards EXCAVO

Why Stellar Lumens Turning More Bullish Than BitcoinHi friend hope you are well today we will try to understand by the Stellar is turning more bullish than Bitcoin as the XLM has recovered more than BTC. If we take a look at the daily chart of XLM then it can be easily observed that after the drop from Feb to March 2020 the price action moved 196% from the lowest to highest price level. On the other side if we watch the Bitcoin daily chart then after this drop we can notice that the priceline of BTC rallied 161% from the lowest to highest price level.
XLM is more bullish even on small time period chart:
Now if we switch to the small time period hourly chart then we can see that after the recent drop the Stellar has recovered 13% but on the other hand the Bitcoin has recovered 9%. Moreover after this 9% recovery the Bitcoin price action is dropping down again. As we have the second bearish appeared on this small time period chart.
The basic reason of Stellar to turn more bullish is this pattern:
The main and the basic reason behind this difference of bullish move between XLM and Bitcoin are the patterns that are formed on the long-term charts by the both cryptocurrencies.
First we will take a look at the price action of Lumens. Here I would like to recall the patterns that I have published in my previous articles of Stellar, that it has formed very big bullish BAT pattern on monthly chart. If we move back in 2017 we can observe that same as like this pattern a big bullish BAT was formed on the weekly chart. And from the potential reversal zone of previous BAT the priceline of XLM took a very powerful bullish divergence and produced more than 4000% gains. Now if we watch the current pattern that has been formed on the monthly chart by the Settal is more bigger than the previous pattern that was formed back in 2017.Therefore we can expect more powerful rally than the previous move. However as per Fibonacci sequence the realistic targets can be 0.382 to 0.786 Fibonacci projection of A to D leg of this bullish BAT pattern. And the targets are from $0.23 to $0.41 this is also very massive profit as these targets shows up to 600% profit possibility.
If we take more closer look on the price action then it can be easily observed that even after the recent recovery rally of more than 196% the price action is still moving at the bottom of the potential reversal zone or buying zone of this bullish BAT. Therefore the Stellar has more capacity to move up in order to reach the sell targets or the Fibonacci projection area of this pattern.
The big bullish pattern of Bitcoin:
On the other hand we can see that on the same monthly chart the Bitcoin has formed very big bullish harmonic Gartley pattern. And after this recovery rally the Bitcoin has entered in the sell zone or the Fibonacci projection of this pattern. Therefore there are more chances that the Bitcoin may start a correction rally or it may move sideways at this level.
The similar channels:
Now I would like to take you again on daily chart where the XLM and Bitcoin both have formed similar up channels. First we will take a look at the up channel that has been formed by the price action of Stellar. Then we can see that the price action has reached at the support of the channel and at this time we have a very weak bullish candlestick appeared that is indicating that the bears are losing control and the price action might move up from here. But on the other side if we see the Bitcoin’s channel then after hitting at the resistance of the channel the price action is moving down and so far it is not reached at the support. Therefore there is more space for the price action of Bitcoin to drop more down. And there are chances that the Bitcoin will drop more down to reach at the support. And in the meanwhile the XLM would move sideways with the support of the channel and we can see that as it is an up channel so if the price action will move with the support then it will be automatically moved up with the upward movement of support.
Conclusion:
The XLM can move sideways at this level as it has already reached at the support of the channel. On the other side the Bitcoin can drop more to reach at the support of the channel. On the long term the Stellar can be more bullish than Bitcoin as the harmonic pattern of the XLM is bigger than the harmonic pattern of the Bitcoin that has been formed on the monthly chart.
Note: This idea is education purpose only and not intended to be investment advice, please seek a duly licensed professional and do you own research before any investment.

Stellar XLM After we'd reached the top of the horizontal channel which is the accumulation zone, XLM went down and now we are at the 61.8% Fibonacci level.
Stellar grew in correlation with Bitcoin. During the last weeks, only two coins were growing paired with bitcoin - DGB and XLM.
In my opinion, we are still in the zone of accumulation. After we'll break the resistance line we can see a very big upward movement and it will be a new bullish cycle.
Best regards EXCAVO

