Hacking the Fibonacci I drew the RED RAY LINES to extend right when the RED and YELLOW Fib Ratio lines cross. Notice the price reacts around the RED RAY lines. I have done it on 20 other charts and this phenomenon is consistent, they will be hit. The tops are amazing, they are only tops if they have never been hit before
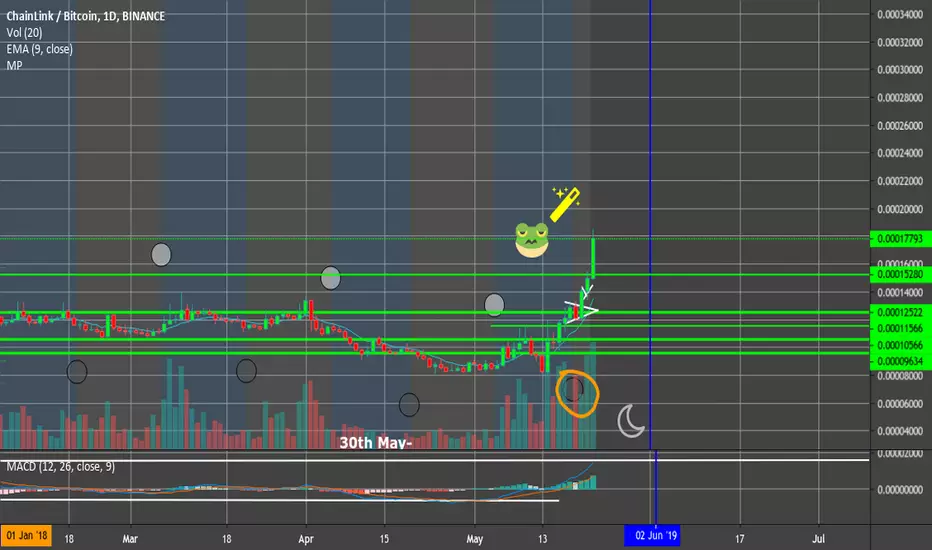
Magic

POMO3 LTA, Fibonacci, MA200, MA 50 e pequena div.RSI intradayAtivo próximo a 0.2 de Fibo, caso haja mais volume de compra do que de venda, podemos buscar 0.5 ou 0.6 de fibo.
R:R 3:1
RSI: Bull divergence em 120m.
Média Aritmética de 200 períodos (Azul) e Média Aritmética de 50 períodos (Amarela) em 720m estão neutras.
IBOV X POMO3 Gráfico Diário.
Mês de junho não teve um fechamento muito agradável para os compradores.
Esse conteúdo é apenas informativo, não é uma sugestão de investimento

FED and Shoulders - Massive Bear Setup in Stock Indices Amid depression-level unemployment, the stock market is nearing all-time highs. But how and why?
THE FED!
The Federal Reserve is funneling money into corporations via buying corporate bonds. Corporations then take this money and buy their own stock, hopefully netting out those who can see the writing on the wall.
The average age of a Baby Boomer is 66 - retirement time!
How do we retire a generation when the stock market is at 2000-2008 levels or lower? The FED indirectly provides the liquidity with printed dollars. Boomers will not think about putting Trump back in this November if they go into retirement without cash.
For corporations to also benefit from all this free money, do they just buy their stocks and hold? Is it not the rational choice to convert their new stock inventory to cash for themselves as a matter of survival? Will the FED be there to keep buying? Do we in fact live in a world without consequences? As a false bull wave hypnotizes the masses, those with cash to buy stocks 'since the market is going up' will provide this liquidity to corporations.
Market participants will lose faith in a market where price discovery becomes compromised. Market cycles and pandemics cannot be printed away.
When numbers come out at the end of this and subsequent quarters, when real prices rise, when stimulus checks don't make it to consumers, the bottom will inevitably fall out. It will inevitably and indirectly be the FED who bears the losses in the stock market, as opposed to the boomers. Or that's the idea anyway.
Significant buying opportunities ahead, as soon as the FED stops fiddling. That, or we see an end of public markets in the United States. When the government enables corporations to buy their own stock, risk free, with magic money, what are the big-picture implications of that?

TIME TO THROW IN YOUR LOTS - MYM1! - 30MNThank you for the likes and the shares! Much Appreciated!
___________________________________________________
Strong probability of getting lots of profits in the short direction
Possibility of new range formation.


Going Long!I see great potential in this. Almost looks like the same hype as the cannabis one, but less strong. Share your thoughts.


DOGE Appears on DOGECOIN Chart to signal next bulldoge run.Doge is a good boi
Doge is appear on chart
Doge is looking back at ATH
DOGE WANT TO DO A COME HOME TO ATH


USOILEsperando el nivel 50.00 con posible reacción en la order block. Veo buena compra si el precio llega ahí o puede comenzar a subir respetando el 50 % de la vela alcista


SPX500 Time into Price, Price into TimeThere are many techniques that WD Gann revealed to the world, but his most powerful idea of time being price and price being time is a difficult one to grasp, but sometimes, on occasion, these effects reveal themselves in simplistic ways so we can all look at them in glee and wonder. Enjoy this chart and hopefully you find this idea can make you many safe trades in the future. Good day!


we can decode the behave of humans using its language(math)we can find our levels at the first of the trends.as long as candles break our levels we move on to the next level.notice that the mentioned levels wont be useful in the next trend and we must start calculating new ones using math.

Bitcoin - What just happened?Ok I will interpret for you what happened and give you a point of view that will keep you safe. I only do longs I do not do shorts so I am waiting for it to go down so I can buy cheaper before it goes up. I believe the next leg will try to reach 15K and Bitcoin will try to retrace before it continues up. I believe BTC wants to go to $8,500 and maybe even to $7,200. In the unlikely scenario that we are done going down and to say that BTC is truly going back up, we need to look for a safe place to jump into it, so you either buy right after it breaks out of the triangle (the red resistance line) or you wait and see if it hits the red X. This will signal the first high, high and we would jump during the pullback to 61.8. The likeliest scenario is that BTC already ran out of steam after hitting the 50MA on the 4H -- which is also where my trendline is. It should start to come down now and hit the green trendline or go below it to the green x.
Another indication is that BTC on the 1D timeframe has violated an important trendline.
This is the long term view that shows that going down to $8,500.00 (50% retracement of the 2019 move ) and $7,200.00 (The 61.8 retracement of the 2019 move) would be healthy and maybe even needed. Both of these prices are marked by the green X's.
THE TREND: Going down.
THE OUTLOOK: Unsafe to buy BTC but safe to enter and buy some alts.
Be safe and follow me to stay ahead of the curve.


BTC: $11365 Road to Fresh Highs new blood new whales new recruits on board
main event is May 2020 at which BTC may just be above $20k as SHOWCASE to the rest of interested parties 2 years ago that are beginning to get a feel of this ANIMAL'S vanity

C wave ends here? Magic or disaster?Lol this should be a local top right around here. then we should continue down.
This chart has high chances of looking disastrously bad as well but whatever
PS, also we made an ending diagonal on 5 min chart. comment below if you wanna see that count.

NAS - Magic Bot buy signal with Sell Targets - 76% Win rate!!BPL ( Bitcoin Profit Labs) Magic bot buy signal with sell targets for NAS
Buy: 0.00019920
Sell Targets
T1: 0.00020916
T2: 0.00021912
T3: 0.00022908
DCA buy: 0.00018924
DCA T1: 0.00019920
DCA T2: 0.00020916
DCA T3: 0.00021912
Trade Stop loss: 0.00017928
--------------------------------------------------------
Magic bot stats:
Wins: 453
Loss: 138
Win %: 76.65%
Total trades: 610
Days: 217
Avg Trades/Day: 2.81
Total Max Cummulative Profit: 2455%!!
Thanks for viewing and any feedback is welcome.
If you would like to see anymore of these buy signal, or if you made some profit from this, support me by clicking the Like button =)

ETC - Magic Bot buy signal with Sell Targets - 76% Win rate!!BPL ( Bitcoin Profit Labs) Magic bot buy signal with sell targets for ETC
Buy: 0.00105400
Sell Targets
T1: 0.00110670
T2: 0.00115940
T3: 0.00121210
DCA buy: 0.00100130
DCA T1: 0.00105400
DCA T2: 0.00110670
DCA T3: 0.00115940
Trade Stop loss: 0.00094860
--------------------------------------------------------
Magic bot stats:
Wins: 453
Loss: 138
Win %: 76.65%
Total trades: 610
Days: 217
Avg Trades/Day: 2.81
Total Max Cummulative Profit: 2455%!!
Thanks for viewing and any feedback is welcome.
If you would like to see anymore of these buy signal, or if you made some profit from this, support me by clicking the Like button =)

EUR/USD ... Strong SignalRocketMan back it again live from the Moon! Catching a glimpse of Haterville and its inhabitants. We love our haters! Now, lets get to it. Receiving a strong signal from the EUR/USD. The T signal is testing resistance strength at the 23.6% support line. Don't mind the small decrease in volume, this is normal on the 10 yr chart, which shows an increase in mid-2014, September (considerable consistency to present date). Slight chance of bearish action moving into April with a breakout in July and possible retrace entering January 2019. However, historical data indicates an upward trend over the next few months, so keep your eyes on the prize!
*This is not investment advise. This is for educational and entertainment purposes. This chart requires no major indicators for the reason stated. First Chart.
R/S
Awareness

APPC - Magic Bot buy signal with Sell Targets - 76% Win rate!!BPL ( Bitcoin Profit Labs) Magic bot buy signal with sell targets for APPC
Buy: 0.00001313
Sell Targets
T1: 0.00001379
T2: 0.00001444
T3: 0.00001510
DCA buy: 0.00001247
DCA T1: 0.00001313
DCA T2: 0.00001379
DCA T3: 0.00001444
Trade Stop loss: 0.00001182
--------------------------------------------------------
Magic bot stats:
Wins: 453
Loss: 138
Win %: 76.65%
Total trades: 610
Days: 217
Avg Trades/Day: 2.81
Total Max Cummulative Profit: 2455%!!
Thanks for viewing and any feedback is welcome.
If you would like to see anymore of these buy signal, or if you made some profit from this, support me by clicking the Like button =)
