Bitcoin (BTC/USD) – Bearish Rejection from Supply ZoneThis chart represents a technical analysis of Bitcoin (BTC/USD) on the daily timeframe, highlighting key levels of resistance, support, and potential price movement. It indicates a bearish rejection from a supply zone, which suggests that BTC may experience further downside pressure.
Key Components of the Chart:
📌 1. All-Time High (ATH) + Resistance Zone (~$110,000 - $115,000)
This is the highest price level Bitcoin has ever reached on this chart.
It acts as a strong resistance zone, meaning sellers are likely to step in if the price approaches this level again.
📌 2. Supply Zone (~$88,000 - $90,000)
The supply zone is an area where selling pressure is high.
BTC attempted to break above this zone but got rejected, leading to a sharp decline.
This rejection confirms that bears are in control, pushing the price downward.
📌 3. Stop Loss (~$95,629)
This level represents the point where a bearish trade would be invalidated.
If BTC breaks above this level, it could indicate a shift in momentum toward bullish territory.
📌 4. Current Price Action (~$83,444)
BTC is currently trading below the supply zone, showing weakness.
The recent lower high formation suggests a continuation of the downtrend.
📌 5. Take Profit (TP) Level (~$65,969)
This is the target level for a potential bearish move.
The $65,969 level has acted as major support in the past, meaning buyers may step in here.
If BTC reaches this level, it could either bounce back up or break lower, leading to further downside movement.
📌 6. Major Support Level (~$45,000 - $50,000)
If BTC breaks below the $65,969 support, the next major support zone is around $45,000 - $50,000.
This area is historically significant and could provide a strong buying opportunity.
Trade Plan & Strategy:
🔴 Bearish Bias:
The rejection from the supply zone signals a continuation of the downtrend.
A short position can be considered if BTC fails to break above the supply zone again.
🎯 Trade Setup:
Entry: Around $85,000 - $88,000 (if BTC retests the supply zone and gets rejected again).
Stop Loss: Above $95,629 to protect against an unexpected bullish breakout.
Take Profit (TP): Around $65,969, targeting the next major support level.
Conclusion:
BTC is showing signs of a bearish continuation, with strong resistance at the supply zone.
A potential move toward $65,969 is likely if selling pressure continues.
If BTC breaks below this key level, a further decline toward $45,000 - $50,000 could happen.
⚠️ Disclaimer : This is not financial advice. Always conduct your own research before making trading decisions. 🚀📉
Marketanalysis

Bitcoin Rebounds Strongly from Key SupportCritical Support Zone:
Bitcoin has rebounded sharply from the $80,000-$78,000 support level, which previously served as the breakout zone in late October 2024. This strong reaction suggests significant buying interest and potentially a higher low within the broader uptrend.
Healthy Market Correction:
After reaching an all-time high of $108,000, Bitcoin experienced a typical bull market retracement of about 30%. The strong bullish engulfing candle at support signals a possible shift back to the upside.
Key Levels to Watch:
Support: Holding above $80,000-$78,000 is crucial for maintaining the bullish outlook.
Immediate Resistance: $88,000-$90,000 range.
Upside Target: If bullish momentum continues, Bitcoin could push toward $100,000 in the next phase of its uptrend.
With momentum potentially shifting, Bitcoin is at a decisive point—will it reclaim new highs? Stay tuned! 🚀📈
#Bitcoin #BTC #Crypto #MarketAnalysis #Trading #Bullish #Support #Resistance

GBP/USD - Potential Bearish Reversal Setup
📉Market Structure:
The pair has been in an uptrend, forming a rising channel. However, price is now facing strong resistance around 1.2936 - 1.3009, showing signs of exhaustion. A potential reversal could be forming.
🔍 Key Levels:
Resistance Zone: 1.2936 - 1.3009
Current Price: 1.2936
Target Support: 1.2208
📊 Trade Idea:
A rejection from the resistance zone could initiate a bearish move.
A confirmed breakdown below 1.2900 may trigger further downside toward the 1.2208 target zone.
Stop-loss placed above the 1.3009 resistance to manage risk.
🚨 Confirmation & Risk Management:
Bearish Confirmation: Rejection from resistance with strong selling momentum.
Invalidation: A breakout above 1.3009, indicating bullish continuation.
Risk Management: Stop-loss at 1.3009 with a favorable risk-to-reward ratio.
This setup suggests a short opportunity if price respects resistance and begins a downward move. Traders should watch for confirmation signals before entering.

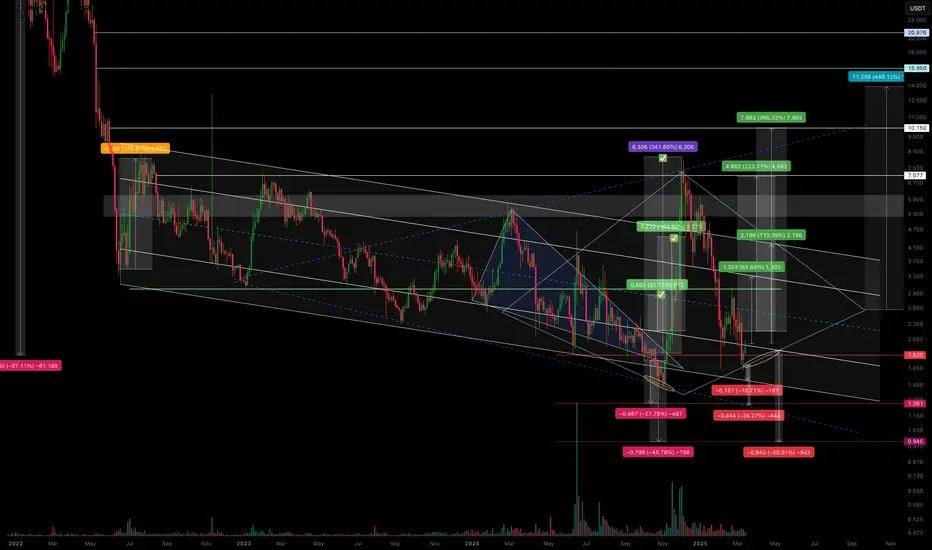
CVX/USDT – Is the scenario repeating? Continuing to work.The previous trading idea has played out with 3 out of 4 marked zones reached.
We saw a false breakout from the descending channel, followed by a pullback in line with the overall market—returning to the channel’s support zone.
I’ve noticed a potential formation of either a diamond pattern or an expanding triangle, but we’ll see how it plays out further.
Regarding declines and support zones:
-10.71% drop to the support of the descending channel.
-26.27% drop to the anticipated support of the expanding triangle.
-50% drop, likely as a squeeze under extremely negative news.
Regarding growth and resistance zones:
+65% rise to the resistance of the internal channel.
+110% rise to the resistance of the external channel (and if a diamond pattern forms, then its boundary).
+246% rise as a second attempt to break out of the descending channel.
+440% rise as a potential realization of diamond pattern pricing (if it forms).
All of this should be factored into your trading strategy, even the less likely scenarios.
I'll share the execution of the previous trading idea in my TG. I've also marked it on the chart.
XAU/USD Breakout – Trend Continuation or Pullback?Gold (XAU/USD) has recently broken out of a symmetrical triangle pattern, signaling strong bullish momentum. This breakout was accompanied by a price surge of approximately 4.47%, pushing the price towards the $3,005 resistance level.
The question now is: Will gold continue its bullish trend, or will we see a pullback before the next move?
📊 Technical Analysis:
1️⃣ Symmetrical Triangle Breakout
The symmetrical triangle pattern formed over several weeks, with price consolidating within the narrowing structure.
A clear breakout above the triangle confirms the bullish momentum, suggesting further upside potential.
2️⃣ Measured Move Target
The breakout's measured move (equal to the height of the triangle) projects a potential target near $3,056.
This level aligns with a historical resistance zone, making it a key level to watch.
3️⃣ Key Support & Resistance Levels
✅ Resistance:
$3,005 – Recent high where price is currently facing resistance.
$3,056 – Next major upside target, based on the breakout projection.
✅ Support:
$2,931 – Previous breakout zone; a retest could confirm support before another rally.
Ascending Trendline – Acting as dynamic support for the ongoing uptrend.
📉 Potential Scenarios to Watch:
✅ Bullish Case: Trend Continuation
If the price consolidates above $2,984-$2,931, buyers may push gold towards $3,056 and beyond.
A strong breakout above $3,005 with volume confirmation will likely signal further bullish strength.
❌ Bearish Case: Pullback Before Rally
Gold may retrace towards $2,931 (previous resistance turned support) before resuming its uptrend.
A break below $2,931 could lead to deeper retracement, possibly testing the ascending trendline.
🔍 Trading Strategy & Considerations:
📌 Bullish Traders: Watch for support at $2,931 and a break above $3,005 for confirmation of the next bullish leg.
📌 Bearish Traders: Look for a failed breakout above $3,005 or a rejection at $3,056 for short-term pullback opportunities.
💡 Final Thoughts:
Gold remains in a strong uptrend, with bullish momentum intact. However, a pullback before the next leg up remains a possibility. Traders should monitor key levels and price action confirmations for the next move.
🚀 What’s your outlook on gold? Drop your thoughts in the comments!

XRP Approaches Critical Support at $2.00Key Technical Level:
XRP is testing the strong $2.00 support level, which has consistently acted as a key price floor since December.
Descending Triangle Formation:
The price action is forming a descending triangle, where decreasing volatility suggests an imminent breakout. This pattern emerges as XRP approaches the intersection of descending resistance and horizontal support.
Bullish or Bearish?
A confirmed breakout above resistance could trigger a strong rally.
A sustained drop below $2.00 would invalidate the bullish outlook, potentially leading to a retracement toward $1.60-$1.80.
Market Perspective:
XRP’s rally from $0.60 to over $3.40 since November suggests that the current correction is likely a phase of profit-taking rather than a full trend reversal. However, traders should remain cautious and watch for confirmation of direction.
Stay alert—XRP is at a decisive moment! 🚀📉
#XRP #Crypto #MarketAnalysis #Trading #TechnicalAnalysis #Cryptocurrency #Bullish #SupportLevel

IF YOU ARE A NEW TRADER YOU HAVE TO SEE THIS VIDEO!!!In this video we explain you everything about the crypto market and how it operates!
We explain you why you are liquidated multiple times and much more!
Very important informations have been finally revealed!
This video will help you to adapt new mentality and strategy which will help you to take right decisions in the future!
This video will help you to finally become profitable!
Trade safe

Statistically Probable that Bitcoin Has NOT Topped YetBitcoin: No Statistical Evidence of a Top Yet 🚀
Based on the analysis using the indicator: Statistically Extreme Areas by Apex Algo Systems, there is no confirmation that Bitcoin has reached a market top at this time. This indicator is designed to identify historically extreme conditions, signaling when price action is statistically overextended.
🔍 Key Observation:
Unlike previous cycle tops, where extreme readings were clearly registered, the current market environment has not yet reached those levels. This suggests that Bitcoin may still have room to run before hitting an exhaustion point.
📊 What This Means for Traders & Investors:
✅ Momentum Still Intact – No statistical evidence of a peak.
✅ Potential for Further Upside – Historically, markets tend to top only after hitting extreme conditions.
✅ Caution & Confirmation Needed – While no extreme has been detected, market conditions can change, and risk management remains essential.
⚠️ Disclaimer: This is not financial advice. Historical probabilities do not guarantee future results. Always conduct your own research before making trading decisions.
What do you think? Could Bitcoin be headed higher? Let’s discuss! 👇 🚀

TOSH/USD Long Setup: OTE + Fake Supply zone reclaimed I've spotted a great long opportunity on TOSH/USD using a combination of advanced market analysis techniques:
1️⃣ Liquidity grab below recent lows, clearing out impatient buyers.
2️⃣ Entry at the OTE zone (Optimal Trade Entry) between 61.8% and 78.6% Fibonacci retracement, a key area for strong rejections.
3️⃣ A fake supply zone has been reclaimed, signaling bullish intent.
🎯 Trade Details:
Entry: 0.0006900 (validated in the OTE zone).
Context: Liquidity sweep below support followed by a bullish re-entry.
Confirmation: Clean reclaim of the fake supply zone with momentum.
Stop Loss: Below the last swing low for proper risk management.
Take Profits:
TP1: Previous Higher High (HH). 🚀
📊 Plan:
I’m watching for strong confirmation in the OTE zone and increased volume as the fake supply zone is reclaimed. Risk management is key—position sizing is based on capital and stop-loss placement.
This is not financial advice, just my personal setup idea based on market structure. What’s your take? Let me know below! 👇"

Statistically Probable that Bitcoin Has Not ToppedBitcoin: No Statistical Evidence of a Top Yet 🚀
Based on the analysis using statistical extremes, there is no confirmation that Bitcoin has reached a market top at this time. This indicator is designed to identify historically extreme conditions, signaling when price action is statistically overextended.
🔍 Key Observation:
Unlike previous cycle tops, where extreme readings were clearly registered, the current market environment has not yet reached those levels. This suggests that Bitcoin may still have room to run before hitting an exhaustion point.
📊 What This Means for Traders & Investors:
✅ Momentum Still Intact – No statistical evidence of a peak.
✅ Potential for Further Upside – Historically, markets tend to top only after hitting extreme conditions.
✅ Caution & Confirmation Needed – While no extreme has been detected, market conditions can change, and risk management remains essential.
⚠️ Disclaimer: This is not financial advice. Historical probabilities do not guarantee future results. Always conduct your own research before making trading decisions.
What do you think? Could Bitcoin be headed higher? Let’s discuss! 👇 🚀

Evaluating the Future of Midcaps: How Much Pain Is Left....?Midcap Correction: How Much More Pain is Left..?
The midcap sector has experienced a significant correction, currently down approximately 18% amid the broader market downturn. This raises an important question: how much more pain is left for midcaps?
Historical Context and Market Correction :
If we look at past trends, this 18% to 20% correction is not unprecedented. A similar downturn occurred in 2022, when the midcap index was corrected by around 23.3%. Therefore, it’s important to remember that such market fluctuations are a normal part of the cycle and not something entirely new.
Primary Causes of the Correction :
Two key factors have contributed to the current market correction. Firstly, the high valuations of midcap stocks coupled with slower-than-expected earnings growth over the past two quarters have created pressure on prices. While there are other contributing factors, these two stand out as the primary drivers behind the recent downturn.
However, this correction may not persist for long. Looking ahead, earnings are expected to pick up in the coming quarters, fueled by an anticipated boost in consumption due to the new income tax bill presented in the latest budget. As a result, a combination of market correction and improving earnings growth could lay the foundation for a potential recovery and a return of the bull run.
Technical Support Levels and Future Outlook :
From a technical analysis standpoint, the midcap index is currently hovering around the 49,650 mark, which is a significant support level. Additionally, this price point coincides with the 0.5 Fibonacci retracement level, reinforcing its importance as a key technical support area. The broader Fibonacci golden zone, which spans from 50,180 to 46,800, also suggests that this range will provide strong support for the midcap index in the near term.
Given these technical factors, it’s reasonable to anticipate that the downside could be limited to around 5% more from the current level of 49,650. Beyond this range, the market may stabilize, and with expected earnings growth, we could witness a market rebound in the upcoming quarters.
Risks to Consider :
While the outlook for midcaps appears optimistic, investors should remain cautious. One major risk is the ongoing trade war, which continues to create significant uncertainty in global markets. Any escalation in trade tensions could weigh on the broader market, including midcaps, and introduce additional volatility.
Conclusion :
In summary, while the midcap index has experienced an 18% correction, this level of decline is not unprecedented, and there is potential for recovery. With strong earnings growth expected in the coming quarters and key technical support levels in place, the midcap sector could see a return to positive momentum. However, caution is advised, especially considering the uncertainties surrounding the trade war. Investors should keep an eye on these developments to navigate the market with caution and opportunity in mind.

Bitcoin Dominance (BTC.D) – Current Market OverviewRecent Trend:
Bitcoin Dominance (BTC.D) has been in a steady uptrend for the past two years, reflecting Bitcoin’s outperformance relative to altcoins. The rise in BTC.D indicates that Bitcoin has been capturing a larger share of the overall cryptocurrency market compared to altcoins.
Bearish Divergence:
The weekly chart now shows a bearish divergence, as the Relative Strength Index (RSI) has failed to confirm the recent upside move. This signals that the buying momentum behind BTC.D is weakening, even though the price has been pushing higher. A divergence of this nature can often suggest a reversal or slowdown in the current trend.
Resistance Levels:
There is significant overhead resistance between the 66% and 73% levels, which were last tested during the 2021 bull run. During that time, BTC.D faced rejection in this range, leading to a shift of capital into altcoins.
A rejection at this resistance could lead to a shift in market dynamics, with altcoins seeing increased demand and potentially entering a rally.
Potential Catalysts for an Altcoin Rally:
If BTC.D faces rejection at these key resistance levels, it could signal the start of an altcoin rally, as market capital may flow out of Bitcoin and into altcoins. Traders will closely monitor this resistance zone as a potential catalyst for a shift in market sentiment.
Outlook:
The bearish divergence on the RSI and the presence of strong resistance between 66% and 73% suggests that Bitcoin dominance might be at a turning point. A rejection in this zone would open up the possibility for altcoins to outperform Bitcoin in the near term.
Conclusion:
Bitcoin dominance remains in an uptrend, but the bearish divergence and resistance between 66% and 73% on the BTC.D chart suggest that altcoins could gain momentum if BTC.D faces rejection at this level. Traders should closely monitor this zone, as a reversal in Bitcoin’s dominance could signal the start of a broader altcoin market rally.

Portfolio Selection for the Week – 10th February 2025This portfolio selection is for educational purposes only!
The key to successful trading lies in consistency. Consistent decision-making, combined with a positive edge, is what leads to long-term success in the markets. This is why we regularly conduct portfolio selection.
At present, the Japanese Yen (JPY) is the strongest currency, followed by the US Dollar (USD), Australian Dollar (AUD), and Canadian Dollar (CAD). On the weaker side, we see Swiss Franc (CHF), Euro (EUR), New Zealand Dollar (NZD), and British Pound (GBP).
Most currency pairs have been experiencing secondary trends. Once this phase concludes, we can look to align trades with the dominant market trend.
If you find this content valuable, hit the boost and share your thoughts in the comments!
Wishing you a profitable trading week! 🚀📈

Bitcoin (BTC/USDT) Symmetrical Triangle Analysis: Next move?Bitcoin (BTC/USDT) 4H Chart Analysis
Key Observations:
1. Symmetrical Triangle Pattern:
The chart shows a symmetrical triangle formation, characterized by converging trendlines.
This pattern typically signals a breakout, but the direction (up or down) depends on market momentum.
2. Current Price Action:
BTC is trading around $102,979.98 at the time of the chart.
It is above the 200 EMA ($100,003.64), indicating bullish strength.
The price recently bounced off support and is moving towards resistance.
3. Support and Resistance Levels:
Support: Around $97,785.55 (blue line).
Resistance: Around $109,636.60 (blue line).
4. Potential Scenarios:
Bullish Breakout:
If BTC breaks above the upper trendline, it may rally towards $109,636.60 or higher.
A confirmed breakout could push BTC to $112,500+.
Bearish Breakdown:
If BTC rejects at resistance and breaks downward, it could retest the $100,000 level or lower.
A breakdown could target $97,785.55 or even $95,000.
Final Thoughts:
Watch for a breakout or breakdown from the triangle pattern.
Volume is crucial—a high-volume breakout confirms strength, while low volume can indicate a fakeout.
If BTC stays above $100,000 (200 EMA support), the bullish bias remains intact.

USOIL BULL Triangle The oil chart is showcasing a large triangle pattern within a smaller triangle, and the breakout of the smaller triangle to the upside strongly suggests that the larger triangle will also be broken. This breakout signals the potential to target significantly higher levels.
Additionally, the bottom has been tested approximately four times, with the last test clearing out all liquidity. Now, the chart appears to be gearing up for a major upward move after a prolonged accumulation phase.
As for my perspective, I’m betting on oil’s rise rather than its decline, even though the current triangle formation is typically a bearish (descending) triangle.
The second entry opportunity will present itself after the larger triangle is broken and confirmed through a retest.
Note: I don't care about the count if it right or not don't comment on that please

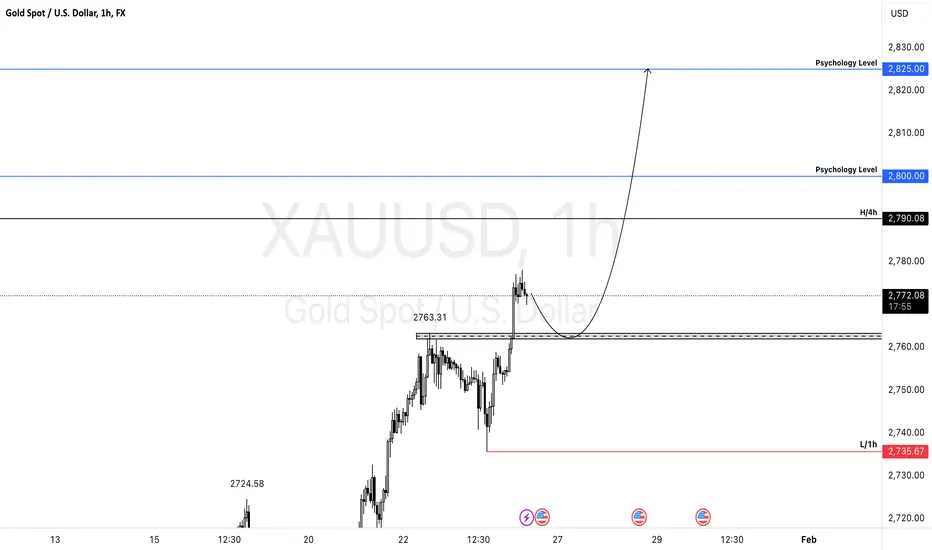
XAUUSD - ANALYSIS👀 Observation:
Hello, everyone! I hope you're all doing great. Let me share my personal view on XAUUSD (Gold) with you.
Based on what I see on the chart, I expect gold to make a small pullback to the 2760–2763 zone. From there, it might push higher, aiming for new all-time highs. However, if 2735.67 is broken, I anticipate a further decline.
📈 Expectation:
Bullish Scenario: A pullback to 2760–2763 followed by a rally targeting:
1️⃣ 2,800 (Psychological Level)
2️⃣ 2,825 (Psychological Level)
3️⃣ 2,850 (Psychological Level)
Bearish Scenario: A break below 2735.67 may lead to further downside movement.
💡 Key Levels to Watch:
Resistance Levels: 2800 / 2825 / 2850
Support Level: 2735.67
💬 What’s your perspective on XAU/USD ? Share your analysis in the comments!
Trade safe
USDCHF - ANALYSIS👀 Observation:
Hello traders! Here’s my analysis for the USD/CHF pair. I’m expecting a small pullback before the price continues its bullish movement upward. My first target for this move is 0.92448 .
However, if the price consolidates below 0.90084 on the 1H timeframe, I anticipate a downward move.
📈 Expectation:
Bullish continuation towards 0.92448 , unless the 0.90084 level is broken to the downside.
If 0.90084 breaks and consolidates, expect a bearish move lower.
💡 Key Levels to Watch:
Target: 0.92448
Support to hold: 0.90084
💬 What’s your perspective on USD/CHF? Share your thoughts in the comments below!
Trade safe

USDCAD - ANALYSIS👀 Observation:
Hello traders! Let’s analyze the USD/CAD pair. Based on the current price action, we are observing a range breakout, and I expect the price to continue its bullish movement upward.
My first target for this bullish move lies between 1.46685 and 1.46966 .
📈 Expectation:
Bullish continuation towards the target range of 1.46685 - 1.46966 , following the range breakout.
💡 Key Levels to Watch:
Target Range: 1.46685 - 1.46966
💬 What’s your outlook for USD/CAD? Share your analysis in the comments below!
Trade safe

AUDUSD - ANALYSIS👀 Observation:
Hey traders! Here’s my analysis for the AUD/USD pair. I’m currently expecting a small pullback before the price continues its downward trend. My first target for this move is between 0.60780 and 0.60430 .
However, if the Australian Dollar breaks above 0.63022 on the 1H timeframe and holds, I anticipate a pullback towards higher levels on the higher timeframes.
📉 Expectation:
Downward movement towards 0.60780 - 0.60430 , unless 0.63022 is broken.
If 0.6322 is broken to the upside, expect a pullback on higher timeframes.
💡 Key Levels to Watch:
Target Range: 0.60780 - 0.60430
Resistance to break: 0.63022
💬 What’s your take on AUD/USD? Let me know your thoughts in the comments below!
Trade safe

XAUUSD - ANALYSIS👀 Observation:
Hello traders! Let’s dive into my analysis for gold ( XAU/USD ). Since 18 Nov 2024, we’ve observed a range-bound movement where the price bounces between the range's floor and ceiling. Currently, we’re at the weekly range ceiling, and I anticipate a downward move toward the range floor.
My first target for gold is 2606 . However, if the price consolidates above 2720 on the daily timeframe, we could see a breakout to new all-time highs.
📉 Expectation:
Downward move from the range ceiling to the range floor at 2606 , unless the 2720 level is broken.
If 2720 is broken and holds, expect a bullish breakout and potential for new highs.
💡 Key Levels to Watch:
Range floor target: 2606
Key resistance: 2720
💬 What are your thoughts on gold’s next move? Share your insights in the comments below!
Trade safe

EURUSD - ANALYSIS👀 Observation:
Hi everyone! Here's my analysis for the EUR/USD pair. Based on the current chart, I expect the price to continue its downward trend after a small pullback. My first target for this move is 1.00938 .
If EUR/USD breaks above the 1.04370 level on the 1H timeframe and holds, I anticipate a shift in momentum and further upward movement.
📉 Expectation:
Downward continuation to 1.00938 , unless the 1.04370 level is broken.
If broken and consolidated, a bullish scenario could unfold.
💡 Key Levels to Watch:
Target 1: 1.00938
Resistance to break: 1.04370
💬 What’s your perspective on EUR/USD this week? Share your analysis in the comments!
Trade safe

DXY - ANALYSIS👀 Observation:
Hello, everyone! I hope you're all doing well. Today, I want to share my personal view on the Dollar Index (DXY) with you.
Based on what I see on the chart, I expect the Dollar Index (DXY) to reach the resistance zone of 110.668 to 110.877 . After a small pullback, I anticipate it will start its bullish movement upwards.
If the 107.750 level breaks downward and consolidates on the 1H timeframe, a further decline could follow.
📈 Expectation:
After a minor pullback, the DXY is likely to initiate a bullish movement and continue its upward trend.
💡 Key Levels to Watch:
Resistance Zone: 110.668 - 110.877
💬 What’s your view on the Dollar Index this week? Share your thoughts in the comments below!
Trade safe

DOGE Ready to Soar Breakout Confirmed with Consolidation AboveBreakout Confirmed
The price has broken out of the symmetrical triangle pattern on the 4-hour timeframe, indicating a bullish momentum.
Higher Time Frame Alignment
If higher time frames (like daily or weekly) are also showing bullish signs, it strengthens the breakout's validity and suggests the trend is likely to continue upwards.
Consolidation Above Trendline
The price is consolidating above the previous resistance (upper trendline), which has now turned into support.
This consolidation is a healthy sign of market strength, as it allows buyers to gain control before the next leg up.
Next Move
A breakout from this consolidation phase would confirm the continuation of the uptrend.
Immediate targets are $0.42 and $0.45, with a potential to move toward $0.50 if bullish momentum sustains.
Entry Strategy
Wait for a bullish breakout from the consolidation with increased volume for a safer entry.
Place a stop-loss just below the trendline or consolidation zone.
Risk Management
Maintain proper risk-reward ratios to account for any potential pullbacks.
