Polygon (MATIC) - November 2Hello?
Welcome, traders.
By "following", you can always get new information quickly.
Please also click "Boost".
Have a good day.
-------------------------------------
(MATICUSDT 1W Chart)
Above 0.8191, the key is whether it can move up along the uptrend line and move above the M-Signal line on the 1M chart.
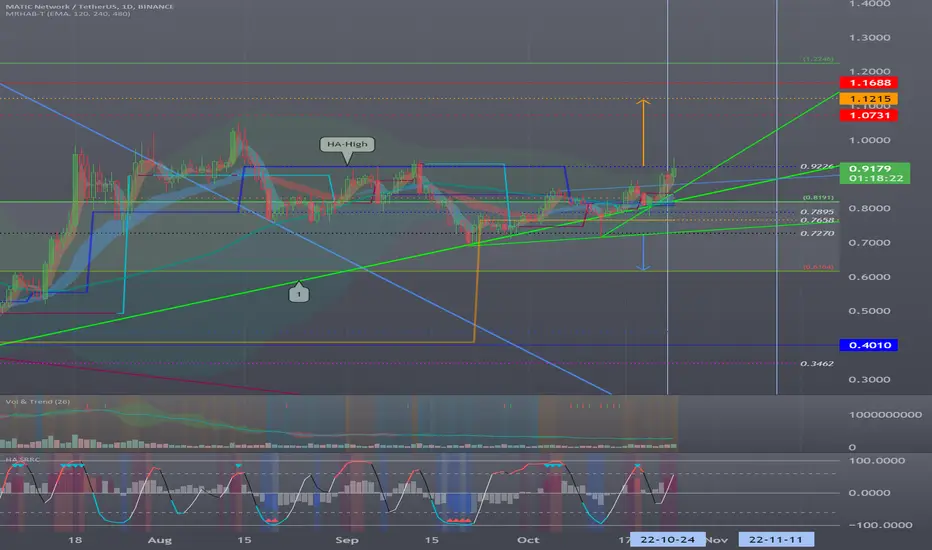
(1D chart)
The key is whether it can rise above 0.9226 and find support.
If not, you should check to see if it is supported in the 0.7658-0.8191 section or higher.
We need to see if we can move up along the uptrend line (1).
------------------------------------------------------------ -------------------------------------------
** All descriptions are for reference only and do not guarantee a profit or loss in investment.
** If you share this chart, you can use the indicators normally.
** The MRHAB-T indicator contains indicators that indicate support and resistance points.
** SR_R_C indicators are displayed as StochRSI(line), RSI(columns), CCI(bgcolor).
** CCI indicator is expressed as overbought range (CCI > +100) and oversold range (CCI < -100).
(Short-term Stop Loss can be said to be a point where profit and loss can be preserved or additional entry can be made through split trading. It is a short-term investment perspective.)
---------------------------------
Maticusd

✅TS ❕ MATICUSD: support level✅✅ MATIC has reached the support level.
A strong reaction has not yet been observed.
A slight correction is possible, after which a fall is expected.✅
🚀 SELL scenario : short to 0.859.🚀
----------------------------------------------------------------------------
Remember, there is no place for luck in trading - only strategy!
Thanks for the likes and comments.

MATIC ANALYSIS#MATIC UPDATE.
#MATIC is currently trading in a rising channel and ascending triangle as well.For upside move MATIC has to close above the blue box resitance area on 4H ,however break below the rising channel would lead into dump so keep eyes on matic.

The next BNB and Ethereum? What is Polygon/Matic up to?I don't know the exact narrative Matic is going to play in the future, but if Dollar index and other insights I've gathered from xrp.d and total2 match, then this could play out next year, matic is posing to be the next BNB and Ethereum maybe. I wouldn't dare touch leverage lesson learnt, but what is good old high performer Polygon/Matic up to these days? Sticking to spot could prove to be a winner.
Buy it, use it, break it, fix it, trash it, change it, mail, upgrade it
Charge it, point it, zoom it, press it, snap it, work it, quick erase it
Write it, cut it, paste it, save it, load it, check it, quick rewrite it
Plug it, play it, burn it, rip it, rip it
Technologic-AutoMATIC

Waiting to open a long position or nothere is the Bullish Channel Pattern we are waiting for several candles more if it is increasing we are open a long position until the resistance that it is 0.99

✅TS ❕ MATICUSD: 5% drop✅✅ MATIC has reached the resistance level.
The price has already bounced from this level.
I expect a reaction down. ✅
🚀 SELL scenario: short to 0.9.🚀
----------------------------------------------------------------------------
Remember, there is no place for luck in trading - only strategy!
Thanks for the likes and comments.

Polygon (MATIC) - October 26Hello?
Welcome, traders.
By "following", you can always get new information quickly.
Please also click "Boost".
Have a good day.
-------------------------------------
(MATICUSDT 1W Chart)
Whether the price can rise above 1.2246 and sustain is the key.
(1D chart)
A move above 0.9226 to hold the price is expected to lead to a move towards moving above 1.0731.
If not, you should see if there is support around 0.8191.
------------------------------------------------------------ -------------------------------------------
** All descriptions are for reference only and do not guarantee a profit or loss in investment.
** If you share this chart, you can use the indicators normally.
** The MRHAB-T indicator contains indicators that indicate support and resistance points.
** HA SRRC indicators are expressed as StochRSI(line), RSI(columns), CCI(bgcolor).
** CCI indicator is expressed as overbought range (CCI > +100) and oversold range (CCI < -100).
(Short-term Stop Loss can be said to be a point where profit and loss can be preserved or additional entry can be made through split trading. It is a short-term investment perspective.)
---------------------------------
MATIC reached 4H resistance.Hello, dear TradingView members.
This is a MATIC idea.
MATIC just pumped and reached the 4H resistance level.
There are two resistance levels on the way up and two support levels on the way down.
We have two possible scenarios:
Scenario One:
The price will pass the 4H resistance level and confirm above it to reach higher levels.
Scenario Two:
The price will be rejected, solidly supported, and pushed back up again.
As you can see on the chart, this coin has reached 2 levels of resistance on the hourly and daily timeframes based on the Fibonacci retracement.
RSI is oversold, and the price has more room to go down.
Now let's see your ideas. Let's have a discussion.
Let me know if you guys have any questions;
I will be more than happy to help.
Good luck, and thank you.

Short MaticShorting Matic here could be a good trade.
Entry: 0.9201
Stop loss: 0.9431
Target 1: 0.8731
Target 2: 0.8464

Matic Polygon Big PictureWell well well not really much to say about this clear and perfect structure.
Target is set already. w3 = 2.618 => w5 = 4.236 up there, probably a bit above or below
Depending on how to coung the start of the 5th wave we see theres nice confluence with 8.236 levels.
So either this goes with the white or the yellow count for the final leg up.
In either way major 1.886 ($0.25) must hold
Hold my beer pls
----
No financial advice, do your own research, don't be stupid

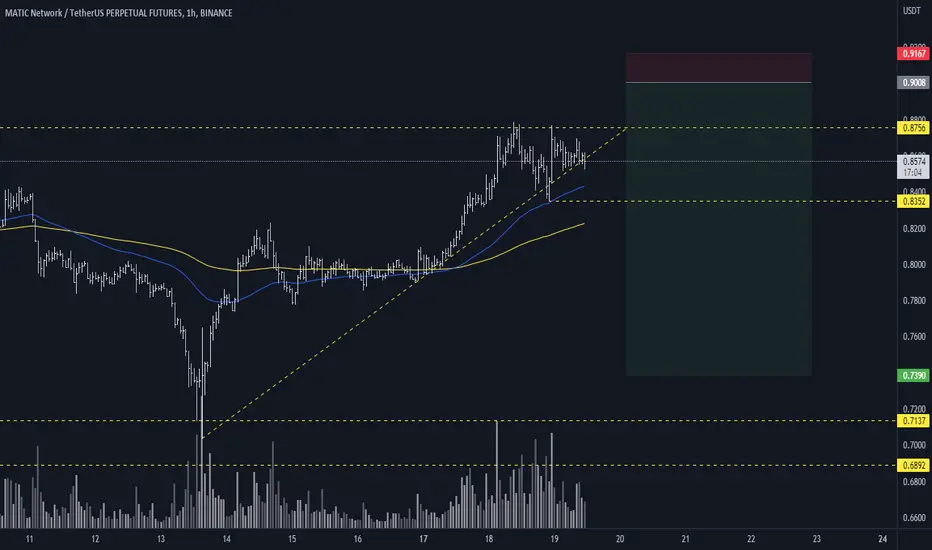
there is a possibility of breaking higher resistances...As long as the bottom of the channel is maintained, there is a possibility of breaking higher resistances. In the 1-hour time frame, the price trend is also upward, and the support of the $0.82-$0.83 range has prevented the growth of the price of this currency. Holding this range can bring the price to the ceiling of the short-term ascending channel, which will be the first short-term objective. But if this support is broken, the price will fall again to the bottom of the channel in the range of $0.70.

Matic on the movewhat a coinciden local and intermediate 4.236 got a perfect conflunece @ 1.32
Hold my beer pls
----
No financial advice, do your own research, don't be stupid

Polygon: Hammer time! ☝️According to the principle “U Can’t Touch This”, Polygon is pulling the M. C. Hammer move above the blue zone between $0.68 and $0.40, meaning that the altcoin just won’t touch it. Nevertheless, we still expect the cryptocurrency to dive into the blue Zone to finish wave (ii) in blue before rising above the resistance at $0.94, thus affirming further ascent. However, there is also a 42% chance that Polygon could indeed not touch the blue zone at all and instead climb above $0.94 directly.

✅TS ❕ MATICUSD: still moving✅✅ MATIC has reached the resistance level.
The price formed a double top and went down.
After the correction, we can expect the fall to continue.✅
🚀 SELL scenario: short to 0.811.🚀
----------------------------------------------------------------------------
Remember, there is no place for luck in trading - only strategy!
Thanks for the likes and comments.

MATIC - Buying SignalBYBIT:MATICUSDT.P
4H time frame
-
MATIC broke the decending channel before, and it is retesting this channel currently.
Support will easily form after resistance is broken, so we can open long here.
-
Entry: 8.37
Add: 8.15
TP: 0.9, 0.975, 1.035
SL: 0.77

MATIC CAN DROP HERE!I think it has reached an important resistance range and can see the announced targets

Matic(Polygon)At the moment there is not enough demand in the market to break through the resistance that we see locally.
It is possible that the local highs will be broken.
If you like the idea, give it a "Like". That's the best "Thanks!" for the author 😊
P.S. Always do your own analysis before a trade. Put a stop loss. Fix profits in installments. Withdraw profits in fiat and make yourself and your loved ones happy.
Translated with www.DeepL.com (free version)
MATIC breaking trendline. Going Towards $1MATIC is breaking the trendline. It will quickly move toward $1 if today it closes above $0.87

MATIC bull flagWith 0.9846 and 0.3162 as the high and low points, the lightning symbol in the chart indicates the reversal pattern of three candlesticks at 0.7293 (0.618).
-
MATIC has now broken through the downtrend line and appeared in a bull flag pattern, with a short-term target price of 0.9439; the major resistance range is at 0.9846~1.0550.
-
The target price above:
1.16~1.24
1.400
1.6530
-

MATICUSD ❕ trading in rangeMATIC trades in the liquidity zone.
Price is overbought by indicator BB (4H TF)
RSI chart is in the overbought zone (1H TF)
TD Sequential has formed a reversal signal downwards (1H TF)
I expect that the asset may start a correction when it fixes under the upper boundary of the liquidity zone.

Symmetrical triangle on Matic/Polygon On Matic has there been a symmetrical pattern formed which shows a 50/50 of the price breaking to the upside of the downside. This said does the price trend show that the price is more likely to break to the downside as the market trend is bearish.
Entry price: In the apex at 0.65.
Stop loss: At 0.67, which is inside the triangle so when the triangle breaks to the downside but after the break to the downside starts trending upwards and is stopped by the stop loss.
Target price: Is extrapolated from the triangle height/the upper trend line and this target price set at 0.349.
This is also 45% gain if the prediction is successful.

Polygon MATIC 3 Weeks Price TargetOn November 8th we will have the Midterm Elections in the U.S.
I think we will see a 3 week rally ahead of the elections, followed by a sharp decline afterwards.
The small bull run should start this week!
MATIC/USDT
Entry Range: $0.76 - 0.81
Take Profit 1: $0.87
Take Profit 2: $0.94
Take Profit 3: $1.03
Stop Loss: $0.68

Matic so much HYPEMatic is a great project , but lets be fair still new with this market situation it will fall badly .
I know friends bought it at 1$
And thinking it will go to the moon
Ok for technical side it has a reversal in monthly stochastic which mean lower low
We could see .1$ agian (for sure to me maybe lower than that )
My buying area is in blue
GOOD LUCK
