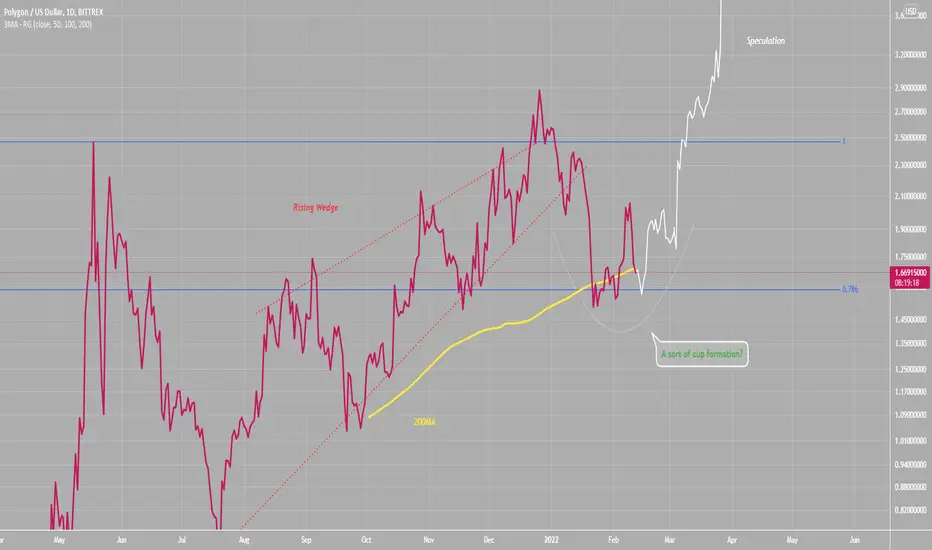
MATICUSD AnalysisRising wedge has led to a breakdown back to 0.786, which is a good place for a potential reversal
I would like to see a sort of cup (like on a cup and handle) form following the rising wedge, this places it in a very bullish position
I am hodling MATIC currently
Reversal at 0.786 plz!
Maticusd
MATIC Polygon - 15 MIN CHART PATTERNS EXPLORATIONTaking a closer look at MATIC on the 15 min scale and measuring that against the next post which will be at the 4 hour scale.

Polygon (MATIC) - February 11Hello?
Traders, welcome.
If you "follow", you can always get new information quickly.
Please also click "Like".
Have a nice day.
-------------------------------------
(MATICUSD 1W Chart)
Above the 0.681 point: the uptrend expected to continue
Above 1.073-1.169 section: It is expected to make a new wave.
We need to see if we can continue moving along the uptrend line.
If the upward trend continues, it is expected to receive primary psychological resistance in the 2.375-2.552 section.
If it falls from the 1.542 point, a short-term Stop Loss is required.
If it falls from the 1.073 point, you need a Stop Loss to preserve your profit.
However, it may temporarily drop to around the 1.073 point, so countermeasures are needed.
(1D chart)
First resistance section: around the 2.447 point
Second resistance section: 3.056-3.259
Support section: 1.634-1.837
The interval 1.634-1.837 is the interval that determines the trend.
As such, we expect the trend to continue in the direction that deviates from the 1.542-2.023 range.
-------------------------------------
(MATICBTC 1W chart)
Above 0.0000 2390 point: Expected to create a new wave.
What is important in the current flow is that the price stays above the uptrend line.
So, if you fall from the 0.0000 4415 point, you should check to see if it is moving similar to the path drawn on the chart.
------------------------------------------
We recommend that you trade with your average unit price.
This is because, if the price is below your average unit price, whether the price trend is in an upward trend or a downward trend, there is a high possibility that you will not be able to get a big profit due to the psychological burden.
The center of all trading starts with the average unit price at which you start trading.
If you ignore this, you may be trading in the wrong direction.
Therefore, it is important to find a way to lower the average unit price and adjust the proportion of the investment, ultimately allowing the funds corresponding to the profits to be able to regenerate themselves.
------------------------------------------------------------ -------------------------------------------
** All indicators are lagging indicators.
Therefore, it is important to be aware that the indicator will move accordingly as price and volume move.
However, for the sake of convenience, we are talking in reverse for the interpretation of the indicator.
** The MRHAB-O and MRHAB-B indicators used in the chart are indicators of our channel that have not been released yet.
(Since it was not disclosed, you can use this chart without any restrictions by sharing this chart and copying and pasting the indicators.)
** The wRSI_SR indicator is an indicator created by adding settings and options to the existing Stochastic RSI indicator.
Therefore, the interpretation is the same as the traditional Stochastic RSI indicator. (K, D line -> R, S line)
** The OBV indicator was re-created by applying a formula to the DepthHouse Trading indicator, an indicator disclosed by oh92. (Thanks for this.)
** Support or resistance is based on the closing price of the 1D chart.
** All descriptions are for reference only and do not guarantee a profit or loss in investment.
(Short-term Stop Loss can be said to be a point where profit and loss can be preserved or additional entry can be made through split trading. It is a short-term investment perspective.)
---------------------------------

MATIC Long ZoneDon't forget to Click on the follow button for more Daily Detailed Analysis. Please do ask any questions in the comments section should you have them!
The Recent rally amongst various Cryptocurrency markets has seen MATIC rise to some early resistance and rebound. On these rebounds we can start to look for Long positions aiming to the north. Remember do NOT buy after a fast move up and do not sell after a fast move down. This is called FOMO and will cause you to miss market moves.
From a TECH perspective we can look for comfortable support and price rejection areas to form our long bias. These are noted on the chart.
Use the Eclipse symbol for longside Exit.

Matic possible path Matic currently testing trendline resistance.
Possible H&S pattern.
I’m looking to buy near $1


Polygon MATIC - Open Chanel to April 2022 - 1 hr time chart I am enjoying thee play function on these charts from the time i post. here is a little more work on MATIC. I see this pattern that resembles a structured safety. Of course safety can fail but with this in place i feel confident of positive returns on Polygon MATIC investments.

MATIC, where is a good time to buy?In the last idea, we said that a break of the trend line and the $1.76 level could be a good buying opportunity.
After breaking the upper boundary of the range, the price went up almost 20% and tested the resistance zone. There was also a lot of volume at the top. This is a bad signal. As a result, we see a small pullback.
It is dangerous to buy now after such a strong rise. We should wait for a correction or a clear trading situation. The marked big value area is at the bottom. A test of this area as support could be a good buying opportunity.
Write in the comments all your questions and instruments analysis of which you want to see.
Friends, push the like button, write a comment, and share with your mates - that would be the best THANK YOU.
P.S. I personally will open entry if the price will show it according to my strategy.
Always make your analysis before a trade.

MATIC is making an impressive returnThis is my view of MATIC in short term. It is very hard to assume that it can make a new ATH this month following the reaction of BTC and also the total market.
But MATIC is getting an impressive return to the track and at least, we have a basis to look at the Fibonacci sequences combined with the volume profile and short-term resistance levels.
I will consider the Fibonacci sequences in short term
0.382 / 0.618 / 0.786 / 1
These sequences should be considered carefully following the BTC's moves.
Please like & share if you agree with my idea.
Thank you
NFA

MATIC - Watching closelyMATIC looking poised to make a move. Potential cup and handle forming on long term BTC chart. Confirmation and subsequent breakout of this pattern could lead to a significant break out above $3 on the $ chart. $ chart itself is forming somewhat of a C&H, maybe more of an ascending triangle. Watch for possible breakout.

MATIC, trendline breakout as a good buying opportunity!A trend line can be identified on the MATIC chart. It is also worth noting that volumes appeared at the bottom during the fall. This is a good signal. In case of a squeeze and a breakout of the trend line, there could be a good buying opportunity.
Write in the comments all your questions and instruments analysis of which you want to see.
Friends, push the like button, write a comment, and share with your mates - that would be the best THANK YOU.
P.S. I personally will open entry if the price will show it according to my strategy.
Always make your analysis before a trade.

MATIC/USDHere is a closer look at this MATIC 1d Binance chart.
MATIC is in a massive Ascending Triangle Pattern on the 1 day chart. An Ascending Triangle Pattern is potentially a Bullish Continuation Pattern. The APEX of this Triangle Pattern is around July 2022. For your viewing pleasure, I have added various support and resistance lines within this Ascending Triangle.
At the moment, MATIC is ABOVE its Bollinger Bands Middle Band Basis 20 Period SMA for this 1 day timeframe. Note that the Upper and Lower Bands are converging inwards indicating volatility has slowed at the moment.
Note that MATIC is still above its Least Squares Moving Average (LSMA) for this 1 day timeframe.
MATIC is above its Volume Profile Fixed Range Point of Control (VPFR POC) for the Fixed Range of 11x daily candle that i have selected.
Note that MATIC is still above its Volume Profile Visible Range Point of Control (VPVR POC) for this charts Visible Range.
Note that Volume is still low on this Binance chart and note that the last 8x Volume Bars have been BELOW its Volume 20 Period MA.
Looking at the Average Direction Index (ADX DI) we can see that the Trend Strength is still strong but has lost some strength with the ADX (Orange Line) dropping slightly to 27.562 below its 9 Period EMA (Black Line) which is at 27.585. Note that Negative Momentum has dropped sharply with the -DI (Red Line) dropping to 26.771. Positive Mmentum has also dropped slightly but not as sharply with the +DI (Green Line) at 18.693. For sustainable upwards momentum to continue, we need the +DI (Green Line) to CROSS back ABOVE the -DI (Red Line) on this 1 day timeframe.
Looking at the Moving Average Convergence Divergence (MACD) we can see that momentum is upwards at the moment and the MACD Line (Blue Line) is still ABOVE its Signal Line (Orange Line) on this 1 day timeframe. Note that the MACD Line (Blue Line) has not been above the 0.0 Base Line in the Positive Zone since 7th Jan 2022 on this 1 day timeframe. Be on the lookout for when the MACD Line crosses back above the 0.0 Base Line into the Positive Zone.
Taking a quick look at the Relative Strength Index (RSI) we can see that momentum at the moment is slightly downwards. Not that the RSI (Purple Line) is still ABOVE its 9 Period EMA (Orange Line) which is a sign of upwards momentum strength at the moment. Be on the lookout just incase the RSI (Purple Line) drops more and crosses back below its 9 Period EMA (Orange Line).
MATIC needs to stay above the Bollinger Bands Middle Band Basis 20 Period SMA and the LSMA indicator for any longterm upwards momentum to be sustainable.
If BTC takes another nose dive and causes MATIC to drop downwards out of the Ascending Triangle Pattern then MATIC may drop to its VPVR POC around $0.83 so we need to keep an eye on what BTC is doing as BTC still controls the market direction.
If the Ascending Triangle Pattern stays valid, then MATIC may be in for a big move up to possibly well above $10 if it successfully breaks back above the Ascending Triangle Resistance line.
I hope this is helpful with your trading and hodl-ing.

MATICUSD Nice 50MA BuyBuy as the price touches the 50MA
previously 50MA seen as a point of upward rejection
I am long MATIC/Polygon

MATICUSDT Trade analysis after achieving first targetMATICUSDT trade will be bullish after crossing accumulation period in coming boost session. For long term entry, trade will get momentum from 23% fib level (supply zone area) to hit 161% fib level.

MATIC climbs the uptrend line.As you can see in the chart, MATIC has built a local growth channel and is waiting for the general market movement that depends on BTC. MATIC is a solid project in the second layer of ETH worth observing.

MATIC - interesting possibilityNo matter what, for now, alt coin action is dependant on the size of bitcoins pumps and dumps, for now. It has not found its bottom and so neither has the crypto market. However, a few coins have lifecycles of their own, more or less, and MATIC is one of them.
Looking at the 1d timeframe chart the RSI made a nice bottom “V” @29 on 22Jan. This is a level it has not been at since last July. The divergence I’ve highlighted with the yellow trend line in the RSI section, confirms a trend change UP. The MacD seems to agree with an uptrend arcing up to possibly create a “BD” today.
Granted the 1w and 1m timeframes are showing a continued downtrend I believe the V in the 1d timeframe is decisive.
The PA is sitting right on the 200ma while being well below the 50ma with the 20ma diving down to meet it. Volume is in the green for the last few days but unfortunately decreasing a bit. This is not a bad thing at this point but I’d like to see volume pick up some eh.
So, PA descended quickly from $2.30ish down to the range market of $1.63-1.50 area where it bounced around a bit. Kinda surprisingly, it bounced up out of the range market which iOS pretty close to the 0.236 FIB ext level. If the PA continues up past the 0.382 range it will also have to break through the blue downslope trend line. That should be confirmation we have an uptrend.
Of course bitcoin could drop a chunk and negate this action.
My thoughts, not advice Oklah. Cheers

$MATIC FORWARDpolygon structures are still quite positive looking forward
$1.30 could be the bottom for the forseeable future
I do not expect .66 to be visited unless a bear market unfolds for crypto
the risk/reward for matic looks positive
breaking the all time high could send prices to $10.00 or more.
for now the consolidation is ongoing

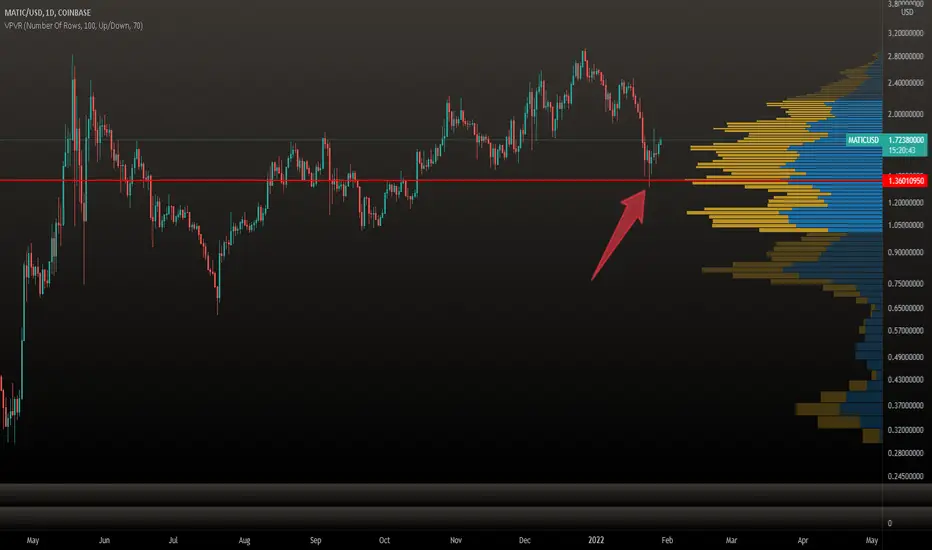
Simple chart for Polygon (MATIC) - keep an eye on $1.36 Simple chart for Polygon (MATIC) - keep an eye on $1.36
Huge volume support that better not be broken and confirmed to the downside.
What do you think? 😎
Drop me a nice comment if you'd like me to analyze any other cryptocurrency.
*not financial advice
do your own research before investing
MATICLikely going to be bottomed now, and bounce around establishing the floor. Then break out into May

MATIC is about to leave the canal.After the recent declines, MATIC hovers around $ 1.64. The current support is at $ 1.5. However, the first resistance is around $ 1.69, the next level that MATIC has to overcome is at the price of $ 1.92. We are getting close to leaving the channel that could change the trend of the rate.

Matic Chart Analysis Matic Chart Analysis
Personally Im Accumulating MATIC
Also Check My Old Analysis..0

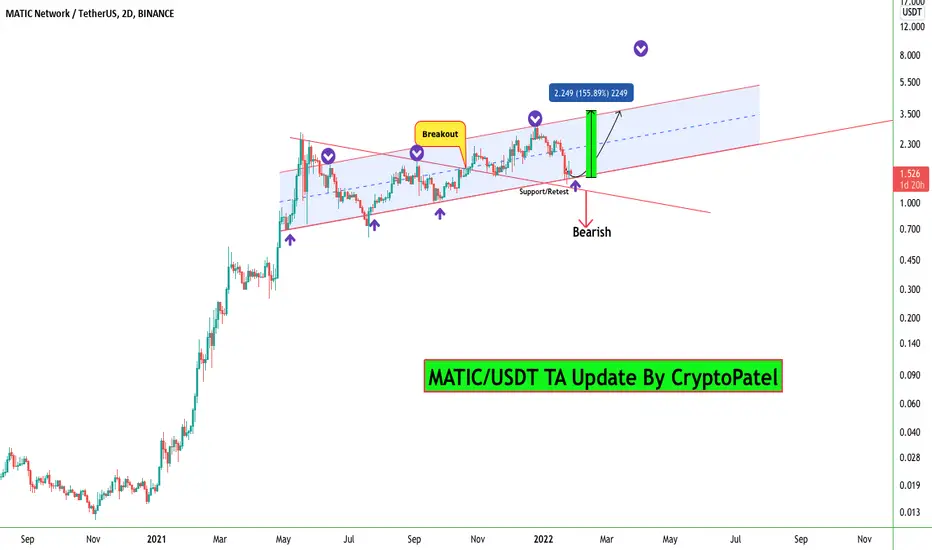
MATIC/USDT 155% Potential from here with Minimum Stop Loss#MATIC/USDT TA Update:-
$MATIC currently trading at $1.50
Big Dumped after broke down $2 Support as I mentioned in Bullish Matic Chart so SL hit already.
This Will be accumulation area.
This is 2nd Retest after Breakout.
-55% down from Recent ATH
I am expecting 155% upward move from here.
Keep in mind Risk Reward also.
Imo $1.15 is Good Stop Loss in Spot.
If Future trade then $1.30 is Good Stop Loss.
I Bought 10000 MATIC with $1.15 Stop Loss.
Support: $1.40/$1.20
Resistance:- $2.40/$3.70
Matic Polygon, it was am easy play day for market makers.This was fairly predictable. As the morning opened the news around the world, social media, and the main stream media were sure that there would be no rate increase and that the FED needs to be careful with crypto. The hope led to a predictable rise and an easy opportunity. The market sold off before he even spoke. Profits.
