MATICUSDT | Short/SellMy Argument :
1D Time Frame:
1.The Chart in correction phase, try to finish the correction 4
2. Hit the Support
4H Time Frame:
Wave B has finish now, and make the correction C in the zig-zag correction
Maticusd

MATIC ( polygon ) analysesMATIC ( polygon ) analyses
time frame daily
price is in the bullish channel
we can see double hit on bottom of channel , then raise to last ATH , pulback and make new ATH
now we can see double hit again,
so my first target is ATH and then 3.2$ for next target

MATIC: Holding StrongIn addition to the giant triangle pattern formed on the weekly chart, MATIC has also formed a nice upward channel since mid-July. If this breakout plays out, the next MAJOR target would be $4+ in the next month or two. It can go higher, but for now, let's focus on reaching the 1.618 fib level.
This is not financial advice. These are just my ideas and opinions.

💡Don't miss the great buy opportunity in MATICUSD @0xPolygonTrading suggestion:
". There is a possibility of temporary retracement to the suggested support line (1.539).
. if so, traders can set orders based on Price Action and expect to reach short-term targets."
Technical analysis:
. MATICUSD is in an uptrend, and the continuation of the uptrend is expected.
. The price is below the 21-Day WEMA, which acts as a dynamic resistance.
. The RSI is at 56.
Take Profits:
TP1= @ 1.690
TP2= @ 1.724
TP3= @ 1.827
TP4= @ 1.925
TP5= @ 2.061
SL= Break below S2
❤️ If you find this helpful and want more FREE forecasts in TradingView
. . . . . Please show your support back,
. . . . . . . . Hit the 👍 LIKE button,
. . . . . . . . . . Drop some feedback below in the comment!
❤️ Your support is very much 🙏 appreciated!❤️
💎 Want us to help you become a better Forex / Crypto trader?
Now, It's your turn!
Be sure to leave a comment; let us know how you see this opportunity and forecast.
Trade well, ❤️
ForecastCity English Support Team ❤️

MATIC(polygon) PRICE PREDICTIONThis is what we may see for matic (polygon) in the near future as it is acting exactly like ethereum in 2017.
so after breaking this triangle pattern we may see a rise to 3.5-4$ for matic.

MATICUSDT - 1D - LongMATIC / USDT
Buy in two Block.
SL - Trigger 1D (Close 1D candle below)
When TP is triggered, SL is transferred to the breakeven

Matic/USd double bottom Double bottom structure formed on matic 15candles, i expect quite nice blow up these days. It depends on curecg covid situation, so we can go lower, if people will be scary and will sell more

MATICUSDT Daily AnalysisMatic looks good for accumulation at this range zone. A big rally will come soon.
NFA/DYOR
Twitter: @akumabtc

Matic Bearish caseThis is doom scenario for matic in the case if we lose 0.65$
IN that case matic have chance to hit 0.25-0.18$.
If this ever happen i will take matic as my first hold coin.

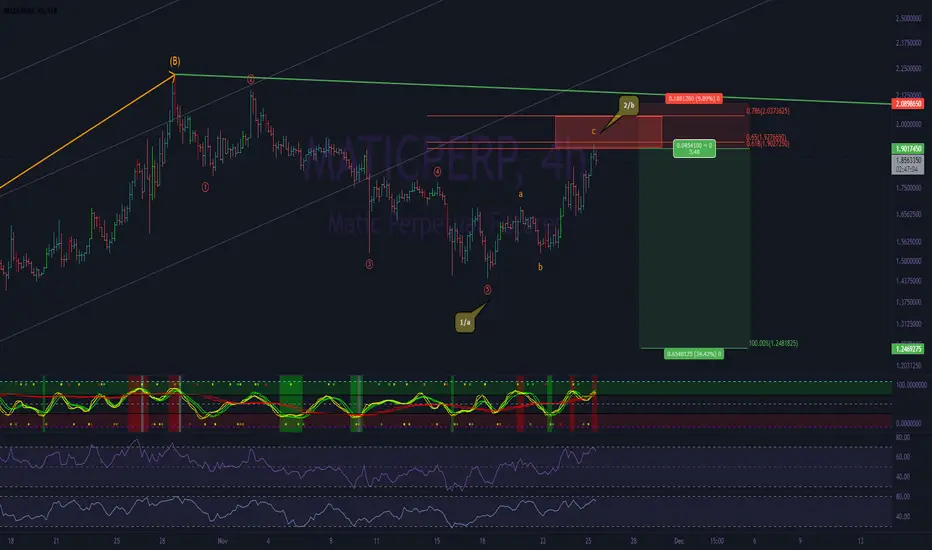
Matic short swing ~matic recently came down in 5 wave, and has seen a mean retracement into the local inversed golden zone.
not sure yet weather it was a wave A or a wave 1, but i'm swinging this in the same style as the last few setups i shared today.
100% extension target = $1.25
POLYGON “MATIC” LOADING UP
This is my prediction of MATIC….Chart looks extremely bullish to me. I also see increased volume following that upwards trend into a nice wedge “triangle”. Let me know what you guys think… I posted yesterday and nothing but upwards from where I posted.

Matic Chart SIGNAL by Sajjat Hossen #MATIC Usdt 1D Chart SIGNAL by Sajjat Hossen
⚠️ Buy Sell At Your Own Risk ⚠️
Entry ✅ Buy Between $1.55 - $1.75
Stop-loss ❌ If Day Candle Close Below The $1.44
Old Analysis...

#MATIC gonna be inevitable | #MATICUSD Hello Padawans,
This is a quick update.
MATIC is one of the strong projects alive in cryptoverse with extremely low fees.
My view on MATIC is like on this chart.
Let's see what will happen next.
cheers.
May the force be with you.

MATIC/USD CRYPTO FOR THIS WEEKMatic/usd has been giving good breakouts on multime timeframes, its a best buy for a week time period

MATIC GETTING READY FOR A NICE BREAKOUTThings are getting tight for MATIC as it is forming a beautiful ascending triangle. I believe a breakout is coming any day now!

MATIC looking at bull flag breakoutMATIC has been printing a nice bull flag pattern. It's also just broken through local resistance to hit the top of the bull flag (top green line marked on the chart).
Look for a retest of support (previously resistance marked on the chart by the blue "Support" line) and possible break through the top of the bull flag for confirmation.
