BRETT - MEMECOIN PROTAGONIST OF THIS BULL RUN - TRADE PLAN + TAMarket Overview
Current Price: 0.15859 USDT
24h Price Change: -3.16%
Volume: 1.93M
The asset has shown significant volatility in recent weeks, with strong price movement followed by consolidation.
Technical Indicators
VMC Cipher B Divergences: The VMC Cipher shows divergence patterns that can help detect potential reversals or trend continuation signals. There are several key points where divergences are visible in the current chart. The negative divergence near the price top could indicate potential downside or correction
.
RSI (Relative Strength Index): Currently at 44.73. This suggests the asset is not yet oversold or overbought but is hovering near the neutral zone. A rise above 50 could indicate bullish momentum, while a drop below 40 could indicate bearish sentiment.
MFI (Money Flow Index): At 41.52, the Money Flow Index is also near neutral. A value above 50 would indicate positive money flow, suggesting that buyers are in control. Below 50 points to selling pressure.
Stochastic Oscillator: Currently at 57.71 for the %K line, and 35.74 for the %D line. This is considered neutral but nearing an overbought zone. A crossover from below 20 could be a buy signal, while crossing above 80 would suggest an overbought condition and potential reversal.
Volume Analysis
Volume Spikes: The recent volume spikes suggest high market activity, with strong buying and selling forces at play. The presence of a high volume near the price peak indicates strong interest, but it also raises the possibility of a correction or consolidation.
Price Action
The chart shows a bullish trend over the past period, with a strong price increase followed by consolidation around the 0.158 level. This sideways movement could be a pause before either a further bullish breakout or a pullback.
Support Levels: Around 0.15 to 0.16, with the current price testing the lower support level.
Resistance Levels: Around 0.18 to 0.19, which could be the next target if the bullish momentum resumes.
Technical Patterns
Consolidation Phase: The price is in a consolidation phase, which is typical after a significant upward movement. It might test support levels before making another move.
Divergence: The negative divergence in the indicators suggests that if price action fails to break through key resistance, a bearish correction might occur.
Sentiment Analysis
Given the current neutral signals from the RSI, MFI, and Stochastic Oscillator, market sentiment is indecisive. Traders should watch for breakouts or breakdowns from key levels to gauge the next move.
Trading Plan for BRETT (BRETT/USDT)
Bullish Scenario
Entry Point:
If price breaks and sustains above the 0.16 level, this could signal a bullish continuation. A close above 0.18 would be a confirmation of a potential upward trend towards 0.20.
Targets:
Short-term target: 0.18 (first resistance zone).
Medium-term target: 0.20 or higher if the bullish momentum continues.
Stop Loss:
Set a stop loss just below 0.15 (the recent support level) to manage risk in case of a pullback.
Bearish Scenario
Entry Point:
If the price drops below the 0.15 support level, this could signal a short-term bearish move. A sustained breakdown below 0.14 would suggest further downside potential.
Targets:
Immediate target: 0.12, which would be a key support level.
Stop Loss:
For a short position, set a stop loss above 0.16 to limit the risk in case of a trend reversal.
Sideways Consolidation
Strategy:
If the price continues to move sideways, trade within the range by buying near the 0.15-0.16 support zone and selling near 0.18-0.19 resistance. This strategy would rely on short-term price movements and volatility.
Risk Management:
Always set stop losses just outside of support or resistance zones (around 0.14 for support and 0.20 for resistance).
Watch closely for breakout or breakdown signals above 0.16 or below 0.15.
Given the current neutral indicators, it’s wise to be patient and look for confirmation before entering large positions.
Maintain good risk management strategies, such as using tight stop losses and adjusting position size according to market conditions.
This plan takes into account both technical indicators and price action, but always stay updated with market news that may influence price movements.
Memecoin

TradeCityPro | MEMEUSDT Analysis Risky Spot Buy?👋 Welcome to the TradeCityPro channel!
Let's dive into analyzing MEMEUSDT, a newcomer to the market. We'll see if it's worth considering for a risky spot buy and holding as part of our portfolio.
🌍 Market Overview
Before analyzing MEME, let’s review Bitcoin’s performance: BTC experienced a 3% drop today, accompanied by a decline in BTC.D. The market was highly volatile, with some coins correcting, others climbing, and some ranging. If BTC.D continues to drop and Bitcoin consolidates, altcoins could see another bullish wave. Personally, I remain bullish and am not looking for short positions.
📊 Weekly Timeframe
MEME is a new coin with limited historical data and has yet to experience a bull run. However, it has already been listed on major exchanges and climbed to the top 160 in market cap.
After an 80% decline post-listing, MEME entered a range between 0.00909 and 0.01425, signaling the end of its downtrend. Breaking out of this box could signal the start of a new uptrend.
With decent recent volume, a risky buy could be considered. Placing a stop-buy order above 0.01561 with a stop loss at 0.00909 might be an effective strategy for managing risk.
📈 Daily Timeframe
MEME remains within the weekly range, having recently tested its range high at 0.01476. Sellers appear exhausted, as buyers have consistently pushed the price higher without revisiting the range low.
If the daily candle closes above 0.01476, consider entering. Alternatively, wait for a breakout above 0.01740 for a safer entry.
Keep in mind that breakout traders might prefer waiting for 0.01740 to be breached, while others might risk entering earlier at 0.01476. It's a matter of trading style and risk tolerance.
As long as the price remains above the curve line, I’ll continue focusing on long positions. Confirmation from an RSI overbought condition and increasing volume will further support bullish entries.
⏱ 4-Hour Timeframe
On the 4-hour chart, resistance at 0.01488 is currently being tested, with signs of a potential fakeout and short-term correction. However, as long as the price holds above the curve, there's a chance to break this resistance soon.
📈 Long Position Trigger:
confirmed breakout above 0.01488 signals a buying opportunity.
📉 Short Position Trigger:
I personally won’t prioritize short setups here, as I’m focused on bullish opportunities.
📝 Final Thoughts
Stay calm, trade wisely, and let's capture the market's best opportunities!
This analysis reflects our opinions and is not financial advice.
Share your thoughts in the comments, and don’t forget to share this analysis with your friends! ❤️

Is there another ACT coming? ( flaviausdt)will enter a new cycle.
Cash from other memeai coming into FLAVIA
ATH is near
#PUMP
#ATH
#FLAVIA

BONK MEME COIN LONG IDEA - Solana Memecoin TrendBONK is a popular Solana meme coin and is gaining attention amid the ongoing meme coin trend, so it’s worth keeping an eye on.
Technical Analysis: BONK recently broke out of a bearish trendline, retested it, and appears to be consolidating here. I believe we could see strong upward momentum soon. The price has also recently broken a larger bearish trendline, created a weekly demand zone, run daily liquidity, and reached a daily demand level, followed by a strong breakout.
I'm already in this trade and would consider adding more if the price retests and reacts at the trendline.
Please note the tight stop-loss on this trade and adjust your risk accordingly.
SL: 0.020847
TP1: 0.0305
TP2: 0.0339
TP3: 0.0357
After reaching TP1, I'll move my stop-loss to breakeven, and I suggest you consider doing the same.

POPCAT COIN LONG OPPORTUNITY - Solana MemecoinPOPCAT is one of the most popular Solana memecoins, currently listed on Binance and generating a lot of hype. I’m keeping a close watch and trading this one to catch the memecoin trend.
Technical Analysis: Price recently hit the daily demand, ran daily liquidity, and failed to close below, indicating a potential move higher. Following the liquidity run, we saw a strong increase in volume, which created a 4-hour demand zone. Price has since rejected off the bearish trendline and is now moving into the 4H demand and maximum discount area, where I’ll be looking for long entries.
Lower time frame confirmations will be necessary before initiating the trade.
Stop loss: 1.15
TP1: Trendline
TP2: Equal Highs - 1.66
TP3: ATH - 1.82

WIF LONG OPPORTUNITY - SOLANA MEMECOINPrice is returning to the weekly demand zone, which aligns well with Fibonacci levels. I anticipate the price will reach the blue box (daily demand) and take off from there. While it may reclaim the blue trendline, there's also a chance it won't. Personally, I won't wait for a retest of that trendline to enter the trade.
I’ll look for LTF confirmations to initiate the trade.
SL: $1.725 (below daily close)
TP: $4.87 (ATH)

Trading opportunity for PNUTUSDTBased on technical factors there is a Buy position in :
📊 PNUTUSDT
🔵 Buy Now
🪫Stop loss 0.740000
🔋Target 1 2.500000
🔋Target 2 4.000000
🔋Target 3 6.500000
💸RISK : 1%
We hope it is profitable for you ❤️
Please support our activity with your likes👍 and comments📝

Trading opportunity for WIFUSDTBased on technical factors there is a Buy position in :
📊 WIFUSDT
🔵 Buy Now
🪫Stop loss 3.1000
🔋Target 1 4.0000
🔋Target 2 4.5000
🔋Target 3 5.4500
💸RISK : 1%
We hope it is profitable for you ❤️
Please support our activity with your likes👍 and comments📝

Doge Gov Bull Flag Formed on 12H Candle - PT $1 on1.618 FibWe have a particularly bullish pattern forming on the 12H candles and it matches my previous analysis on the 1.618 Fib Target of $1.08 (article linked below).
When multiple trading patterns emerge, the breakout move becomes more assured.
We now have two powerful trading singles 1.618 and Bull Flag confirming next upside price target of $1.
Enjoy Frens

Trading opportunity for WIFUSDTBased on technical factors there is a Buy position in :
📊 WIFUSDT
🔵 Buy Now or by Breakout
🪫Stop loss 3.1000
🔋Target 1 3.7100
🔋Target 2 4.1500
🔋Target 3 4.9000
💸RISK : 1%
We hope it is profitable for you ❤️
Please support our activity with your likes👍 and comments📝

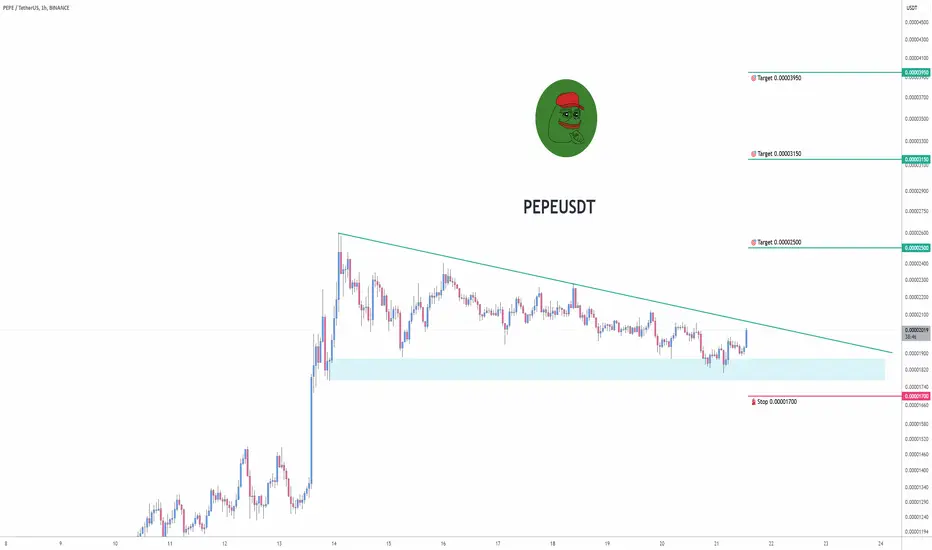
BUY Opportunity for PEPE/USDT – More than +10% Upside Potential!Is it now, or will you miss the boat?
PEPE has broken out of a descending triangle pattern and is currently testing the breakout level near 0.00002000, offering an excellent buying opportunity with a potential upside of over 10%. This classic descending triangle breakout, combined with a pullback to retest the breakout line, often signals the beginning of a bullish trend.
Entry Plan:
Traders are advised to wait for rejection confirmation from 0.00002075 (support entry line) on lower timeframes (1H/30M) before entering. This validation ensures strong buyer activity and improves the chances of a successful trade.
Final Note:
PEPE is at a critical decision point. If buyers step in now, it could lead to a significant upward push. However, as with any trade, proceed with caution, monitor price action closely, and always manage risk effectively.
Sidenote:
Share your thoughts or results if you’re already trading this setup or planning to enter. Let’s grow together. Good luck! 🚀

Trading opportunity for PEPEUSDTBased on technical factors there is a Buy position in :
📊 PEPEUSDT
🔵 Buy Now
🪫Stop loss 0.00001700
🔋Target 1 0.00002500
🔋Target 2 0.00003150
🔋Target 3 0.00003950
💸RISK : 1%
We hope it is profitable for you ❤️
Please support our activity with your likes👍 and comments📝
BONKUSDT: Potential for a 30-50x Surge!Overview:
BONK/USDT, the second-largest meme coin on the Solana network has shown promising signs of a significant upward trend, as indicated by the recent breakout from both weekly resistance lines. The price action suggests a refusal to decline further, highlighting a potential bullish momentum.
Technical Analysis:
-The chart demonstrates a clear breakout above the yellow resistance line, which has historically acted as a ceiling for price movements.
- The weekly candle has closed above this line, indicating strong buying pressure and potential for further gains.
- The price has also surpassed the horizontal resistance at 0.00004790, reinforcing the bullish outlook.
Market Sentiment:
With the current momentum and market interest, BONK/USDT could see a substantial increase, potentially reaching 30-50 times(+) its current value. However, it's crucial to acknowledge the inherent risks in such high-volatility trades.
Risk Assessment:
While the technical indicators are favorable, this is a high-risk trade. Market conditions can change rapidly, and it's essential to conduct thorough research and consider your risk tolerance before investing.
Conclusion:
BONK/USDT presents an exciting opportunity for traders willing to embrace the risks for potentially high returns. Keep a close watch on market developments and adjust your strategies accordingly.

AIKA/SOLAll downside liquidity has been balanced , looking to create new ATH, This meme coin could make $millions ..buy in phantom and enjoy the journey

PNUTUSDT Bullish Flag PatternPNUTUSDT Technical analsysi update
BINANCE:PNUTUSDT has formed a bullish flag pattern on the 1H chart, with the 100 EMA acting as support for the pattern. A breakout has been confirmed on the 1H chart, and we can expect a 50-150% bullish move in the coming days.

FLOKIUSDT - preparing for another bullish rallyweekly chart is promising as it's obviously that after every accumulation floki going bullish
the accumulation in blue is different of other.
it's biggest ,
stabled at great support (weekly 0.618 fib)
so closing of the previous ATH , and obviously there are many retesting of it
incase of breakout the previous ATH price will make a 200% in bullish rally
Best regards Ceciliones🎯

DOGE at a Crossroads – Four Scenarios to WatchHey trading family, let’s break down what’s happening with DOGE. Right now, the chart is setting up for some key moves, and here are the four scenarios I’m watching:
Break above $0.38: If this happens, DOGE could push to $0.43 and then test the $0.50 zone.
Break lower on the 4-hour: A retest of the $0.34-$0.33 zone is likely.
$0.34-$0.33 fails to hold: We could see DOGE correct further to $0.27-$0.25.
This is a make-or-break moment for DOGE. What’s your plan if we pump or if we pull back? Let’s trade smart and stick to the plan.
Like, comment, and share your thoughts! Got your own ideas or questions? Send me a DM – I’d love to hear from you.
Mindbloome Trading // Kris
Trade What You See.

PEPEUSDT Forming Bullish Flag$1000PEPEUSDT Technical Analysis update
BINANCE:PEPEUSDT 's price has increased by over 230% from its bottom. It is now consolidating and forming a bullish flag pattern in the middle of the trend. The price could touch the flag pattern support at $0.018 before moving higher, where the 200 EMA will act as support. A bullish continuation can be confirmed once the price breaks the flag's resistance line.
CRYPTOCAP:PEPE CRYPTO:PEPEUSD

WEN: another awakening patternIf you follow me "somewhere else" you saw all those other alts on which I've identified an ascending triangle. Such pattern forms when chart prepares for a break out after a period of dumping/ranging.
I don't believe in memecoins, at least I think they're on the same level of betting which makes them a bad investment. However this one is the only I have faith into. He has been fairly distributed to JUP users, it can count on a community which is alive and is accomunated by JUP, it's in the Solana Ecosystem which is currently the #1 for alts (alts and meme). I've read somewhere the token doesn't have many whales but I'm not sure about this.
However, I got airdropped some and I bought some more. I tried buying 3 more meme in the past and it always went bad. I hope this one, considering the FA it'll go well.
Meanwhile I think FA is on our side. Still a good buy IMO.
Good luck!

DogWiFHat: A smart hat for your wallet!Memesession season continues! Dog in the hat, target on the schedule. Technically you will see the final 5 wave, which will end in the area at the 2 fibonacci level. Believe in something!
Horban Brothers.

WIFUSDT New ATH Soon!WIFUSDT Technical analysis update
BINANCE:WIFUSDT is moving towards its previous ATH level, which is expected to act as major resistance. High trading volume has been observed near this resistance over the past few days. The price has been confined within a range for the last 250 days, and after this ranging period, it is now approaching the resistance level. If a breakout occurs, a significant bullish move can be anticipated.

Solana Meme Coins tonight! Tyson vs Paul! MAKE MONEYHey fellow crypto enthusiasts,
Tonight is gearing up to be an event that everyone on social media is talking about: Mike Tyson vs. Jake Paul. Love them or hate them, this fight is capturing global attention, and I believe it's a massive opportunity in tonight's meme coin narrative.
Why is this a big deal for meme coins?
In the world of crypto, especially with meme coins, timing and relevance are everything. Major events like this fight create a surge in online activity and discussions, which can be leveraged to launch tokens that capitalize on the hype.
Here's what I'm anticipating:
I expect a plethora of new coins to be launched around this narrative. The key to spotting the next moonshot, in my opinion, lies in finding the one that's both the fastest to market and the most "accurate" in capturing the moment.
What do I mean by "accurate"?
Imagine this scenario:
The moment Mike knocks out Jake (or the other way around), someone clips that exact moment and shares it across social media.
They've already set up a token website and, with the clip in hand, they quickly update it to reflect the event.
They launch a token aptly named something like "Sleepy Jake" or "Sleepy Mike".
By connecting the socials and launching on platforms like pump.fun, they tap into the immediate buzz.
This token could gain massive traction because it encapsulates a viral moment. People love to be part of something trending, and a coin that represents that exact instance has a higher chance of going viral.
What about other tokens?
Undoubtedly, there will be numerous other tokens launched during and after the fight. Some might see significant volume purely due to the general hype. However, the ones that might truly take off are those that:
Capture the exact moment: Timing their launch to coincide with pivotal moments in the fight.
Engage with the community: Active promotion on social media platforms to create a buzz.
Offer something unique: Whether it's a clever name, a catchy logo, or a funny meme, uniqueness can set a token apart.
What am I doing tonight?
I'll be on the lookout for tokens that:
Launch immediately after a significant event in the fight.
Have a strong social media presence.
Show signs of organic growth and community engagement.
What are your plays tonight?
Are you planning to dive into this potential wave of new tokens? Do you have strategies for identifying promising projects amid the flurry of launches?

DOGE long ideaMy potential short term long target is the range high. Follow the price action at the key zone then pull the trigger. Keep it simple
