MINA : Upto 75% Profits in The Mid Term.Pair : MINA/USDT
Mina just broke out from the recent downward trend on the 1D chart. A falling wedge pattern already formed and a breakout is on the process. The current candle stick formation looks very bullish but needs to close in such a good shape to confirm the bullish break out and a reverse move. Indicators are also looking good so far the MA and MA both moves below the price which is a bullish sign. Volume looking so good after a good amount of entry in the past 48 hours. If you have to take some risks and get some profits here are the major distribution selling price levels as follows.
#Accumulation Entry Area : 0.56 usdt - 0.6 usdt
🎯Target 1 : 0.618 usdt
🎯Target 2 : 0.69 usdt
Mid Term
🎯Target 3 : 0.74 usdt
🎯Target 4 : 0.80 usdt
Stop Loss :
Make a strict stop loss price level depending on the timeframe you are strategizing.
Nathnael B.
cryptotalk_et
MINA

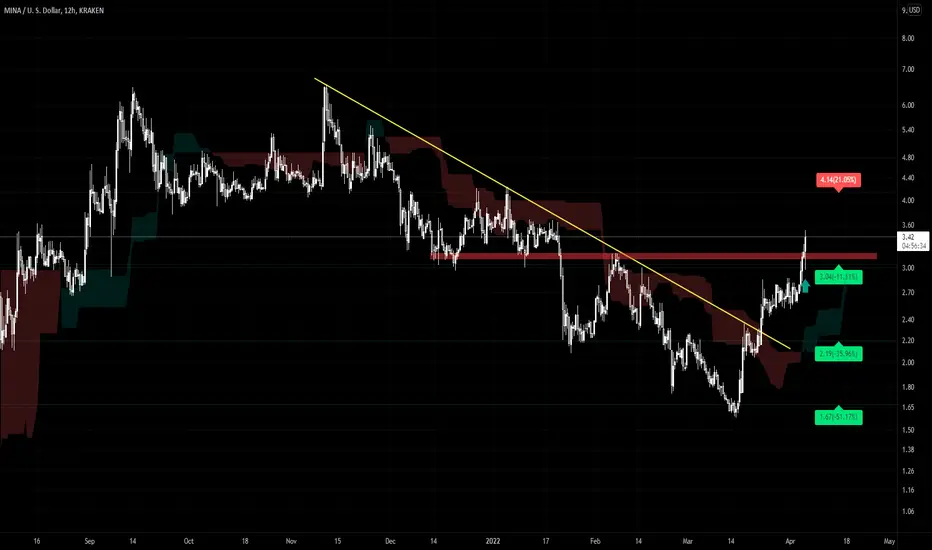
MINA broke up on 12h, quite strong signalThis is bullish pattern, sometimes point of resistence where spike ends so we need to watch it and find good entry point. I think this can continue to another MAs. Manage your risk.
Not financial advice

Mina Early Bullish Jump Signals (106% Target)Not as early as one might think as the low has already been set 13-June and now MINABTC is challenging EMA50 to face the "final resistance".
As soon as this level is conquered, we can see a 100%+.
You can find the target and support levels clearly mapped on the chart.
Namaste.

Mina Protocol Ready To RecoverMina protocol is getting ready to shoot up and the giveaway is the triangular shaped bottom around 13-June, the high volume on this same date and the long upper wick on the 19-June candle.
The RSI is above 50 with MINABTC trading above EMA21 and EMA10.
(All bullish signals)
It can grow.
The red dash line at the bottom can be used as support (stop-loss).
Wishing you a nice day.
Namaste.

MINAUSDT analysisthere are no buying and selling offers, (i just share a business perspective) !! please entered with money management !!

mina can have a great bullrun here is my idea about mina . in my opinion it trap in a triangle and if the triangle break to the upside it can reach to 1.6$ . i havent time to explain more than this . good luck

MINAVery simple - very clear
This is my personal opinion. Please do not trade based on my analysis and data.

Current state of the market and Mina reportMina chart is forming a descending triangle (bearish pattern), nonetheless don´t means that the price is going down. On the contrary can easly break up. Even more RSI is making lower highs and higher highs while price is making the same lows (bullish divergence), meaning we are getting momentum. We also can argue that this chart is forming a inverted Head & Shoulders pattern (Bullsih pattern) espeacially in the shorter time frame (12h) wich gives us confluence.
We are seeing exhaustin signs of the bears in all markets. I belive we can see a relief rally to the target (marked in the chart) especially because BTC.D is facing a big resistance. Meaning 1)all alts and bitcoin have more fall ahead (alts disbelieve more than bitcoin) or 2)Alts will go up more and in a fastest way than bitcoin. In my personal opinion given the market conditions I think the second one is wich will play out in the near future. So i can start watching some alts to swing trade and day trade being Mina is one of them.

🆓Mina (MINA) Apr-24 #MINA $MINA
MINA has a fairly important support zone at the moment, the $2.2 zone. It can still help MINA rally back to the $2.6 and $3.2 zones. But it can still lose this zone and fall to the $1.8 or even $1.4 zone. We need to pay attention to this $2.2 zone
📈RED PLAN
♻️Condition : If 1-Day closes ABOVE 2.2$ zone
🔴Buy : 2.2
🔴Sell : 2.6 - 3.2
📉BLUE PLAN
♻️Condition : If 1-Day closes BELOW 2.2$ zone
🔵Sell : 2.2
🔵Buy : 1.8 - 1.4
❓Details
📈Red Arrow : Main Direction as RED PLAN
📉Blue Arrow : Back-Up Direction as BLUE PLAN
🟩Green zone : Support zone as BUY section
🟥Red zone : Resistance zone as SELL section

MINAUSDT RSI BACED ANALYSIS !!!
I personally see a Positive regular divergence on rsi . My strategy on rsi says that entry on the fib 50 and 61.8 might be great. So, stay tuned for updates and signals...

LETS GO ON, MY DEARThe scenario formed by the overlap of formation detection and the change in the market structure.

MINAHi traders!
I have next tip for you. MINA
This is another secret coin like XMR and ZEC.
On this coin is potential for 100% and more clear profit.
Currently above bearish trendline, the buy volume is good and retail don't know about this coin.
Targets 5-6USD, in case of bullish reaction go for 300-500%.

Mina in a Marathon, Resistance Bids Still ExistIn March, Mina coin saw a V-shaped recovery with a price action pole and flag pattern in the daily price chart.
MINA coin price is rising above the 0.5 Fibonacci retracement level; still, it is yet to break the 0.786 Fibonacci level (Bullish barrier).
There is no doubt that buyers have control over the MINA coin and the moving averages are the biggest paradigm of this. However, the crucial 20, 50, 100 and 200 EMAs are well below the live price.
During the bullish rally, the daily RSI is forming above the half-line (50-mark) and is currently looking in overbought territory.
The Average Directional Index is moving at 39-point, which indicates a strong bullish trend for the MINA coin.
Although MENA is under bullish consolidation, it remains below the 0.786 Fibonacci retracement level which could affect the directional trend. For more upside, the bulls need to break this barrier with massive trading volume for stability.
Resistance level- $4.0 and $6.4
Support level- $3.5 and $4.1

$Mina easy 4+ is it holds supportif you didnt buy earlier, now is the chance.
As long as the daily support holds. (red box)
BTC Chart is also bullish
MINA/USDTesting/tracking elliot wave theory. Please do not trade off idea without S/L. Not financial advice.

MINAUSDT - SETUPMINAUSDT price has shown good strength after breaking the falling wedge pattern and now bulls looking for some accumulation before starting the new rally, So let's see how price action behaves!

#Mina / #Usdt #Futures (Medium risk)
Long lev 3~5x
Entry : 2.712~2.698
Targets : 2.769 / 2.844 / 2.96
Stop loss : 2.645
Don't risk more than 2% of capital

#Mina / #Usdt#Spot
Buy zone 1: 2.815~2.754
Targets : 2.932 / 3.160 / 3.47 / 3.98 / 4.96
Stop loss : 2.4
Don’t risk more than 3% of capital.

MINAKeep an eye on MINA currency. By stabilizing above the broken range, it can start moving upwards.


$Mina MinausdtCoin $Mina broke the downtrend channel, and preparing for an uptrend, I think can buy in this price area, and hold for long, Mina protocol uses zk rollups technology, A technology full of potential in the future. If you hold $Mina 1-2 years, this is one of the best times to buy.

MINA could move soonMINA in big ascending channel, nice chance to continue up when it reach support level. In small falling wedge now. Set alarm, it might take some more time.
Good luck traders

MINAUSDTsee and watch :)
After breaking the trend line strongly, we expect a small correction and then towards the goals ...
