25/10/2021 UpdateJust another update for the daily chart..
BTCUSD looks right on track. Past couple days over the weekend, the 'over bought' indicators have been reset. The TD sequential was reset from overextended a day or so ago, daily RSI has come back down leaving more room to go up.
Tagged the daily 13EMA but still have not hit that all awaited for touch of the 21EMA however this chart shows BTC holding the red box as support, the resistance holding us down is the 1.272 fib level from swing low to swing high (at the time). As long as we stay inside the box IMO we will break out after slight consolidation but MHO I think we will break the box this week and see new ATH's again this week or next.
Thanks for reading :)
Jakk.BTC
Moon

$AXS to the moonAxie Infinity Shards is just about the easiest trade you can make right now.
The market still hasn't caught up to the fact that it's the second highest revenue producing protocol - alone this should place it in the top 10 market cap.
With fundamental bullish catalysts like the Ronin DEX and Land gameplay coming out in Q4 it's certain to reach new highs. Additionally, AXS staking continues to lock up an increasing amount of supply with ~30% currently staked, and yet APR remains in the triple digits.
From a technical perspective it looks amazing as well, a clear pennant has formed. Fib extensions are for possible targets but I intend on holding my stack much higher than any of the prices shown.
I want to write more but I think I'll just do a thread instead. Best of luck.

MATIC/USDT BREAKOUT Matic is in a full breakout against USDT pairing. This can continue to 2 usdt plus.

Dogecoin probably to the moon!Dogecoin probably to the moon!
The price can touch the midline in the Alt season
Also it has the flag pattern

Play the breakout on GRTOn the weekly chart we see a large pattern forming, my bias is to an upside break to continue the rally from earlier this year.
Once a weekly candle closes above this pattern expect new all time highs in weeks/months.
If prices fall out the bottom of this pattern and sets a weekly close, that would invalidate this idea.

EGLD to $400 and beyondRisk to reward ratio on EGLD looks very attractive right now.
1. Its just broken bullish out of a huge pattern
2. DEX is due to launch soon driving up demand
3. wen coinbase listing <3
$400 is the most conservative target.

Promising Low Cap Crypto Pick!!! 200% gains!!!Come across this promising project by the name of cirus, showing a really nice setup technically. Have a read of the whitepaper before thinking of investing. Ideal entries @ $0.66. first take profit = 150%

SNAP, Gap fill play, Price Target $70SNAP, this has a gap fill to $73. Needs to enter $63 to play out this gap fill. SNAP is currently at $55, long-term price target = $70

Cardano (ADA) to all time highsCardano has done this in the past, it turns into a stablecoin and looks like its painting a head and shoulders pattern, but then blasts to the upside.
I see the same pattern happening, price is already getting pulled tight. I think once RSI breaks above 50 (seen below) and price breaks UP out of this pattern, we will see cardano returning to all time high within weeks/months.
If we break down out of this pattern, it would invalidate this idea.

Can IOTA 5x from hereIOTA looks like its been in a massive inverted head and shoulders pattern since 2018. a daily close above $2.80 would push price up to $5.
jump on the rocketship

EOS Launch Incoming!!Money Makers!
Keep an eye on EOS and add it to your watchlist. This project has always been very strong and it's one of the original coins. Its previous ATH was around $14 dollars and it has retraced all the way back down to the $4 range. If you ask me based on the MacD, the RSI which has a bullish divergence and has broken through a diagonal resistance with a retrace to touch support for confirmation, and finally the chart holding steady above support I can see a solid 50% or higher gain very soon. I will be watching closely for the right opportunity to invest. It's all about Market structure, Area of value, and Entry Trigger.
Love it or hate it, hit that thumbs up and share your thoughts!
Don't trade with what you're not willing to lose. Safe Trading Calculate Your Risk/Reward & Collect!
This is not financial advice.
Simplicity Wins

LINK to all time highs $55+We see this inverse head and shoulder on lots of major alts right now.
I like LINK, im a long term holder, it has nice tokenomics.

USDCAD: Moon O'Clock?!Here is my comprehensive breakdown of why bulls should re-enter the market.
We need a retracement to tackle some of the stop losses that are present from the head and shoulders pattern break out.
Once this is out of the way we can continue to trade the trend downwards.
We can buy into our sells for better profits.
Please, support this post with a like and comment!

LONG BTCThe story, the chart, the analysis is same what they were on 16 oct, same like 16 oct it doesn’t break the support and then it goes toward the ATH. same stuation for now it doesn't manage to break strong support and now i am expecting it to move between 59 - 63k range before the ATH ladies and gentlemans

Short-lived pullback before 200kAs you know, I'm always trying to find things that happen in both 2013 & 2017 before having conviction that what we're seeing is nothing different than before.
Since the reversals as the beginning of each chart shows, we've been following a pretty well paved path. The current pullback seems to remain along that path.
Similarities:
1: As we test & play around with the 1.618 log-based fib which is around the previous ATH, we have a short-lived pullback before an uptrend is recovered slowly again.
2: The sideways action lasts 3 days in 2017 and 4 days in 2013 before continuing on with an uptrend.
3: The RSI dropped to 38 in 2013 and 37 in 2017. We're struck right in between there this time.
4: Percentages aren't similar between the cycles, but I'll note them anyway: 25% drop in 2013 and 7% drop in 2017. We're currently at 10.5%
To see my convictions on why we'll see 200k+, see my related ideas. I think they'll persuade you as well.


✅LUNAUSDT - Land on the Moon as we expected!BINANCE:LUNAUSDT
1H trend chart
-
Congrats!
Remember to take some profit at 1st TP if you are following my trading plan.(link as above)
-
Next, you can hold it until TP2, or even TP3.
Also could sell it anytime you satisfy!
-
Anyway, have a great profit!
-
If you like this analysis, smash the "like button" and leave a comment below to share your thoughts
or let me know what crypto you want to see!
Trading is a reflection of yourself. Learn more daily and be ready for every opportunity.
Have a nice trading!

AMAT go ZOOOOOMAMAT is bound for a strong impulsive move
✅ Phase 1: a harsh pullback
✅ Phase 2: a period of consolidation
✅ Phase 3 : an impulsive move to the 0.61 line of the pullback move
❌ Phase 4: another consolidation perdiod: Skipped
✅ Phase 5: a drop to the 0.38 line of the fib retracement
🤩 Phase 6: Back to the top we go

$BTC/USD: Moon Trading & Technical AnalysisAs we can see, Bitcoin has to overcome two more supports on the Fibonacci retracement before truly and strongly going to higher scenarios. The current daily candlestick is breaking down with a massive volume over the average which means the big players and whales are involved in this particular price. The market doesn't want the price to go higher just yet. There is a little bit of manipulation as well as a psychological response from the overal market to the new ATH.
I don't advice to go long unless you are buying in the area below 20 level on the RSI. At least, in my trading plan this always works.
Once the RSI is on below 20 and Bitcoin is rejecting the Fibonacci retracement's supports, I am going long very hard.
Not financial advice, but for educational purposes only, always do your own diligent research.
Peace! Be safe and profitable!

BUY/USDT HODL ONTO YOUR DREAMBUY/USDT could be ready for one of the biggest reversals in the crypto alt-coin market. The time frame plays out to end of year to Q1 2022. This chart is strictly based on the RSI now trending up after being so far oversold in the weekly that by end of year we could potentially see an overbought. In 1day chart the 50ema is soon to cross the 200ema for a golden cross. This hold is a dream, will it come true?

100M per btc in 2030-35 I think that if bitcoin reaches 100M+ in 2030-2035 range it is something that will not surprise you.

Bitcoin i think this makes sense? Saved for later, i think this makes sense. I think we will go around $200-400k this cycle top and next bear bottom could be around $30-60k.

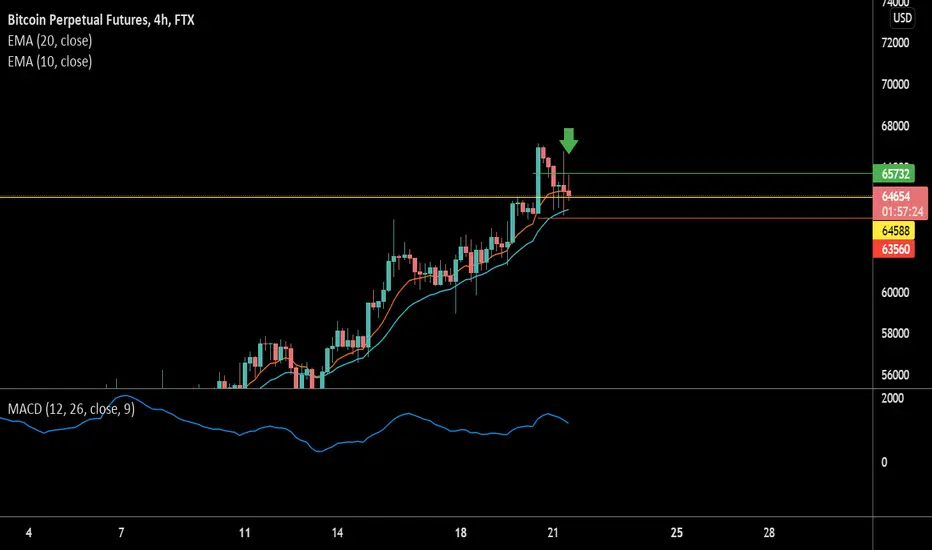
Potential Entry Into Bitcoin! 🍹If this candle closes green, I will be looking to enter into BTC when the price strikes my green line with a stop loss on the red....
Manage your risk 😉