W.W. Grainger Inc. Stock Quote | Chart & Forecast SummaryKey Indicators On Trade Set Up In General
1. Push Set Up
2. Range Set up
3. Break & Retest Set Up
Notes On Session
# W.W. Grainger Inc. Stock Quote
- Double Formation
* Wave Feature On Flat Structure | Completed Survey
* ((No Trade)) - Invalid Short Set Up | Subdivision 1
- Triple Formation
* (EMA Settings)) Start At 942.00 USD | Subdivision 2
- Support & Resistance
* (TP1) | Subdivision 3
* Daily Time Frame | Trend Settings Condition
- (Hypothesis On Entry Bias)) | Indexed To 100
- Position On A 1.5RR
* Stop Loss At 107.00 USD
* Entry At 114.00 USD
* Take Profit At 126.00 USD
* (Uptrend Argument)) & No Pattern Confirmation
* Ongoing Entry & (Neutral Area))
Active Sessions On Relevant Range & Elemented Probabilities;
European-Session(Upwards) - East Coast-Session(Downwards) - Asian-Session(Ranging)
Conclusion | Trade Plan Execution & Risk Management On Demand;
Overall Consensus | Buy
Moving Averages

Understanding Moving Averages In TradingToday, we dive into a comprehensive guide on Moving Averages (MAs) — one of the most fundamental yet powerful tools in technical analysis. Whether you're a seasoned trader or just starting out, understanding how MAs work can help you better interpret market trends, identify potential entry and exit points, and smooth out price data for clearer decision-making.
In this article, we’ll break down the different types of moving averages, how they’re calculated, when to use them, and common strategies that incorporate them into successful trading plans.
1️⃣ 1. What are Moving Averages?
Moving averages (MAs) are statistical calculations used in technical analysis to smooth out price data and identify trends over a specific period. They help traders filter out short-term fluctuations and focus on the overall direction of an asset's price.
2️⃣ 2. Importance
Moving averages (MAs) play a crucial role in technical analysis by helping traders identify trends, reduce noise, and make informed trading decisions. Here’s why they are important:
Trend Identification: MAs help traders determine the overall direction of the market.
Dynamic Support & Resistance: Traders watch key MAs (e.g., 50-day and 200-day) to anticipate price reactions.
Trading Signals & Crossovers: Detects potential changes in trend direction.
Golden Cross (Bullish): When a short-term MA (e.g., 50-day) crosses above a long-term MA (e.g., 200-day), signaling a potential uptrend.
Death Cross (Bearish): When a short-term MA crosses below a long-term MA, indicating a possible downtrend.
Momentum Confirmation: A steeply rising MA suggests strong bullish momentum, while a declining MA signals bearish strength.
3️⃣ 3. Moving Averages Types
Simple Moving Average (SMA): Calculates the simple average of past prices.
Exponential Moving Average (EMA): Prioritizes recent prices for faster response.
Weighted Moving Average (WMA): Prioritizes recent prices for faster response.
Hull Moving Average (HMA): Smooths trends while reducing lag effectively.
Smoothed Moving Average (SMMA): Averages data with less sensitivity to noise.
Triangular Moving Average (TMA): Applies a double smoothing to price data.
Adaptive Moving Average (AMA): Adapts dynamically to changing market trends.
Kaufman Adaptive Moving Average (KAMA): Adjusts speed based on volatility and noise.
Double Exponential Moving Average (DEMA): Uses dual EMAs to reduce lag in trends.
Triple Exponential Moving Average (TEMA): Enhances trend detection with triple EMAs.
Arnaud Legoux Moving Average (ALMA): Minimizes lag while improving price smoothness.
Variable Moving Average (VMA): Adjusts its value based on market conditions.
Volume-Weighted Moving Average (VWMA): Weights price data according to trading volume
Jurik Moving Average (JMA): A highly smooth and responsive MA that reduces lag and noise.
Fractal Adaptive Moving Average (FRAMA): Adapts to market fractal geometry, adjusting speed based on volatility.
Zero Lag Exponential Moving Average (ZLAMA): A variation of EMA that eliminates lag by compensating for past price movements.
4️⃣ 4. Calculations
Moving averages are fundamental tools in technical analysis, helping to smooth price data and highlight trends. However, not all moving averages are created equal—each type is calculated differently, affecting how it responds to market movement.
In this section, we’ll focus on the formulas behind a few of the most relevant and widely used types: the Simple Moving Average (SMA), Exponential Moving Average (EMA), and Weighted Moving Average (WMA).
a. Simple Moving Average (SMA)
The Simple Moving Average (SMA) calculates the average price of an asset over a specified period.
Lag: High (delayed response to price changes)
Best for: Identifying long-term trends and support/resistance
SMA = P1 + P2... + ... + Pn / n
Where:
P1 + P2... + ... + Pn: are the prices (usually closing prices) of the last n periods.
n: is the number of periods on average.
It gives an equal weight to all prices in the period.
ta.sma(close, length)
b. Exponential Moving Average (EMA)
The Weighted Moving Average (WMA) assigns higher weights to more recent prices, reducing lag and increasing responsiveness compared to SMA.
Lag: Lower than SMA but higher than EMA
Best for: Short-term trading strategies
EMA = (Pt × α) + EMAy × (1 − α)
Where:
Pt: Current price (usually the closing price)
EMAy: Previous period’s EMA
α (alpha): Smoothing factor = 2 / (n + 1)
n: Number of periods in the EMA
It gives more weight to recent prices, reducing the lag compared to SMA.
ema = ta.ema(close, length)
c. Weighted Moving Average (WMA)
The Weighted Moving Average (WMA) assigns higher weights to more recent prices, reducing lag and increasing responsiveness compared to SMA.
Lag: Lower than SMA but higher than EMA
Best for: Short-term trading strategies
WMA = (P1 × w1 + P2 × w2 + ... + Pn × wn) / (w1 + w2 + ... + wn)
Where:
P1...Pn: Prices (usually closing) over the last n periods
w1...wn: Weights assigned to each period (most recent gets the highest weight)
n: Number of periods
It reacts faster than SMA but smoother than EMA due to its linear weighting.
wma = ta.wma(close, length)
While there are many variations of moving averages available, the formulas covered here—SMA, EMA, and WMA—represent the most essential and commonly applied in both trading platforms and manual analysis.
Understanding how these are calculated gives deeper insight into their strengths, limitations, and the types of signals they provide.
5️⃣ 5. Choosing the Right MA
Choosing the Right Moving Average for Your Trading Style
Choosing the right moving average (MA) depends on your trading style, time horizon, and goals. Different types of MAs have varying levels of sensitivity to price movements, so the choice should align with your trading strategy.
Here’s how you can choose the best moving average based on your trading approach:
Short-Term Traders (Day Traders, Scalpers)
Exponential Moving Average (EMA): The EMA reacts faster to price changes, which is crucial for short-term traders who need to enter and exit positions quickly.
Simple Moving Average (SMA): While less sensitive than the EMA, shorter-term SMAs (like the 5 or 10-period) can still be useful for spotting very quick trend changes.
Hull Moving Average (HMA): Offers a good balance between smoothness and responsiveness, reducing lag while staying sensitive to price changes.
Medium-Term Traders (Swing Traders)
Simple Moving Average (SMA): Longer SMAs (like the 50-period or 100-period) are effective in identifying the general trend over a few days or weeks.
Exponential Moving Average (EMA): The 20-period or 50-period EMA can work well for medium-term traders, providing a smoother trend signal while still responding to changes.
Smoothed Moving Average (SMMA): The SMMA gives a smoother trend and reduces the noise, which is ideal for swing traders who look for stable trends over a couple of weeks.
Long-Term Traders (Position Traders, Investors)
Simple Moving Average (SMA): Longer SMAs like the 100-period or 200-period SMA are perfect for long-term traders and investors. These averages provide a clear indication of the long-term trend and act as reliable support and resistance levels.
Triangular Moving Average (TMA): TMA smooths out price movements even more and is useful for capturing long-term trends. It's slower, but highly effective for those trading in longer time frames.
Trend-Following Traders
Exponential Moving Average (EMA): As trend-following traders rely on capturing long trends, EMAs with longer periods (50, 100, 200) are a solid choice, providing smoother signals with less noise.
Hull Moving Average (HMA): The HMA reduces lag, making it a great choice for trend-following traders who want to react quickly to changes while staying in the trend.
6️⃣ 6. How To Use Moving Averages
Moving averages (MAs) are one of the most widely used tools in technical analysis due to their simplicity and effectiveness in identifying trends, smoothing price data, and signaling potential market reversals. They are used by traders to help spot entry and exit points, determine the direction of the market, and define dynamic support and resistance levels.
Here’s a deeper dive into how moving averages are used in trading:
Identifying Trends
Uptrend: When the price is consistently above the moving average, it indicates a bullish trend. The longer the period of the moving average, the smoother it becomes, showing the overall direction of the market.
Downtrend: Conversely, when the price is consistently below the moving average, it indicates a bearish trend.
Sideways/Consolidation Market: When the price hovers around the moving average without a clear direction, the market is often in a consolidation phase.
Support and Resistance Levels
Support Levels: When the price is above a moving average and then pulls back to touch it, the moving average often acts as a support level. Traders anticipate the price to bounce off the moving average and resume its uptrend.
Resistance Levels: When the price is below a moving average and then rallies back to it, the moving average often acts as a resistance level. This resistance can lead to a reversal or consolidation as the price struggles to break above the MA.
7️⃣ 7. Golden Cross & Death Cross
One of the most well-known signals involving moving averages is the crossover of short-term and long-term moving averages. These crossovers are used to signal potential trend changes and provide traders with entry and exit signals.
Golden Cross: Occurs when a short-term moving average crosses above a long-term moving average.
Death Cross: Occurs when a short-term moving average crosses below a long-term moving average.
Golden Cross
This is considered a bullish signal, indicating that an uptrend may be starting or strengthening.
When it happens: A common example of a Golden Cross is when the 50-day moving average crosses above the 200-day moving average. The short-term trend is gaining strength and could signal the beginning of a sustained uptrend.
Why it works: The Golden Cross indicates that recent prices are moving higher and that momentum is accelerating. It suggests that buying pressure is overpowering selling pressure.
Death Cross
This is considered a bearish signal, indicating that a downtrend may be imminent or already in place.
When it happens: A typical example of a Death Cross is when the 50-day moving average crosses below the 200-day moving average, signaling that the short-term trend is weakening and a bearish shift may be in play.
Why it works: The Death Cross shows that short-term price movements are declining relative to longer-term trends, and it indicates increasing selling pressure.
8️⃣ 8. MA Strategies
Trend Following
The trend following strategy focuses on identifying and capitalizing on strong price movements in one direction.
Trend Identification: Moving averages are used to identify whether the market is trending up or down. The most common trend-following strategy is to buy when the price is above a key moving average and sell when it’s below.
Trend Confirmation: Once the trend is identified using MAs, traders can enter trades that align with the trend. The idea is to "ride the wave" of the trend as long as possible until there is evidence of a reversal or loss of momentum.
MA Crossover
Moving average crossovers are one of the most popular and widely used strategies in technical analysis. Crossovers occur when a short-term moving average crosses over a longer-term moving average, signaling potential trend changes.
Short-Term Crossovers: These are typically faster and more sensitive, which can help traders spot quicker market changes. Short-term crossovers tend to generate more signals, but they can also lead to more false signals in choppy or sideways markets. (9 EMA & 21 EMA Strategy)
Long-Term Crossovers: These are slower and less frequent but tend to produce more reliable trend signals. Long-term crossovers filter out market noise and provide a clearer view of the overall market direction. (The 50/200-Day Moving Average Strategy)
Mean Reversion
Mean reversion is based on the idea that prices tend to return to their average over time.
How to Identify Overextended Prices
Overbought and Oversold Conditions: When the price is significantly above or below a moving average, it may be overextended. In such cases, traders expect the price to revert to the moving average.
Using MAs as a Benchmark: Traders can use longer-term MAs, like the 50-day or 200-day moving averages, to identify overextended conditions. If the price moves significantly above or below the moving average, it is often seen as an opportunity for mean reversion trades.
Trading Moving Average Pullbacks
Pullbacks: A pullback is when the price moves against the prevailing trend, temporarily retracing toward the moving average before resuming its original trend.
Buying Pullbacks in Uptrends: In an uptrend, traders look to buy when the price pulls back to a moving average like the 50-day or 200-day MA, assuming the trend will continue.
Selling Pullbacks in Downtrends: In a downtrend, traders look for selling opportunities when the price temporarily rallies back to a moving average, anticipating a return to the downtrend.
9️⃣ 9. Key Takeaways
Moving Averages (MAs) smooth price data, helping identify trends, entry, and exit points.
Trend Following Strategies use MAs to align trades with the market’s direction (uptrend, downtrend).
Support & Resistance: MAs act as dynamic levels where prices may reverse or consolidate.
Crossovers:
- Golden Cross (50/200-day crossover) signals a bullish trend.
- Death Cross (50/200-day crossover) signals a bearish trend.
- Short-Term Crossovers (9/21 EMA) provide faster signals for active traders.
Mean Reversion Strategy: Prices often revert to their moving average after being overextended.
Pullback Trading: Enter trades when prices pull back to key MAs during trends.
Combining Indicators:
- RSI confirms MAs’ buy or sell signals.
- MACD crossover strengthens trend direction confirmation.
- Bollinger Bands help assess volatility, confirming price targets and trends.
Timeframe Selection: Short-term traders use quicker MAs (e.g., 9 EMA), while long-term traders prefer slower MAs (e.g., 200-day SMA).
Best MA Settings: For trend-following, use 50/200-day MAs; for short-term, use 9/21 EMAs.
Stay sharp, stay ahead, and let’s make those moves. Until next time, happy trading!

KASPA Structure Analysis – Downtrend BreakoutAfter retesting the $0.05 demand zone (previous resistance dating back to August 2023), BITGET:KASUSDT reclaimed the 50-day EMA (yellow) and tested the 200-day EMA (orange), before a brief pullback with the 50-day EMA acting as support.
Key Levels
• $0.050-$0.060: Main demand zone
• $0.083: Current support, reinforced by 50-day EMA
• $0.105: Current resistance, reinforced by 200-day EMA
• ~$0.120: HVN and potential resistance
• $0.155-$0.160: HVN, previous S/R and potential resistance
• $0.180-$0.200: Main supply zone
Here's a weekly chart with volume profiles for more context:
Considerations
• The breakout from the recent downtrend, and the break above the 50-day EMA followed by a retest as support, is a good sign for the bulls.
• If the 200-day EMA is successfully reclaimed, it could offer a good shot at retesting the main supply zone in the $0.180-$0.200 area.
• Conversely, a sustained break back below the 50-day EMA could lead to another test of the $0.050-$0.060 main demand zone.
Neutral outlook until a break above 200-day EMA or below 50-day EMA.

SPY at 3 important event! POC, 200 ema and 30 days reversalHi All SPY is at an interesting intersection:
1) a month from where it crashed and reversed entirely
2) At point of control (POC) from the top in Feb
3) at 200 ema
In Aug 22 SPY reversed from POC, at other times it found support or broke out with a gap
My opinion is, it will continue going up till 13th May (date when CPI is published). Nobody knows for sure how much tariff will impact CPI. It cannot as bad as we had during covid.

$BTC Huge Daily Close Above the .618 Fib !Very BIG Daily Close for ₿itcoin above the .618 Fib 🥵
CRYPTOCAP:BTC needs to close the next week in or above the green box demand area in order to keep the rally alive and flip resistance into support.
As I originally mentioned in my idea, PA either needs to correct accordingly or this is the long-awaited PARABOLA in the making.
I still stand with my original belief on how this will play out, and have numbered my ideas accordingly.
1. Correct to 200DMA
2. Correct to 50DMA
3. Inverse Head and Shoulders reversal pattern
4. PARABOLA 🚀
I hope it's time to MOON more than anyone!
but I still have a good chunk of cash on the sideline in case the market needs more time 🤓

XIT LongStarting to edge back into a few ETF's now the 1 hour MA's have flipped. Nothing fancy here, small position looking to ride the waves. Expecting resistance as we go. Will move SL in stages giving it time to rise.

ETC LongStarting to edge back into a few ETF's now the 1 hour MA's have flipped. Nothing fancy here, small position looking to ride the waves. Expecting resistance as we go. Will move SL in stages giving it time to rise.

NZD / CHF I will wait for the breakout of the volume zone and the moving averages and close below them to sell.

Darden Restaurants Stock Quote | Chart & Forecast SummaryKey Indicators On Trade Set Up In General
1. Push Set Up
2. Range Set up
3. Break & Retest Set Up
Notes On Session
# Darden Restaurants Stock Quote
- Double Formation
* Start Of (Diagonal) At 140.00 USD | Completed Survey
* ((No Trade)) | Inverted Structure | Subdivision 1
- Triple Formation
* (Continuation Argument)) On Entry Bias | Subdivision 2
* (TP1) | Subdivision 3
* Daily Time Frame | Trend Settings Condition
- (Hypothesis On Entry Bias)) | Logarithmic Settings
- Position On A 1.5RR
* Stop Loss At 192.00 USD
* Entry At 200.00 USD
* Take Profit At 214.00 USD
* (Uptrend Argument)) & No Pattern Confirmation
* Ongoing Entry & (Neutral Area))
Active Sessions On Relevant Range & Elemented Probabilities;
European-Session(Upwards) - East Coast-Session(Downwards) - Asian-Session(Ranging)
Conclusion | Trade Plan Execution & Risk Management On Demand;
Overall Consensus | Buy

Stock: SQ Weekly Long Opportunity – Head and Shoulders with RDOverview:
This weekly chart for Block, Inc. presents a high-potential buy opportunity. A well-defined Head and Shoulders pattern is forming, indicating a likely trend reversal. I’m waiting for a confirmed breakout above the Neckline for entry.
Technical Insights:
The MACD shows regular bullish divergence, reinforcing the setup's reliability. Additionally, with the price positioned above the 200 MA, bullish momentum is even stronger, increasing the probability of a sustained move upward.
Targets & Risk Management:
🎯 Take Profit 1: $130
🎯 Take Profit 2: $195
🔒 Stop Loss: Set just below the Right Shoulder
📈 Pattern: Head and Shoulders
💥 Confirmation: Entry on breakout above the neckline
📊 Divergence: Regular bullish divergence on MACD, signaling a potential trend reversal
📐 200 MA Support: Price is trading above the 200 MA, adding strength to this bullish setup
This combination of pattern, divergence, and moving average support makes this trade an excellent opportunity. 🚀

Paramount Prepares for Stage-2 BreakoutNASDAQ:PARA appears to be preparing for a transition from stage 1 to stage 2.
Since 2021, the stock has declined by over 90%. Throughout 2024, it has mostly traded sideways.
After nearly a year of price fluctuations around the Point of Control (POC), it now seems better positioned for an upward move.
Although volume support is still lacking, increasing demand suggests that a breakout to the upside could follow.

SPX Peaks at 6,100; Correction Toward 4,600 LikelyThe SP:SPX ’s rally, which kicked off at 3,500 in late 2022, climaxed around 6,100 in February 2025.
Since then, the trend has clearly reversed, and I expect the correction to persist. As long as the index remains below 5,800 (supply), downward momentum should continue.
A pullback toward 4,600 by 2026 appears plausible, with that level likely acting as resistance or support—warranting a fresh assessment upon arrival.
In the near term, the SPX is likely to trade within a 5,100–5,700 range.

CAD / CHF SELL NOWWe can sell now after breaking the uptrend line and closing below the volume zone.

Technical Analysis: Ethereum (ETH) — April 30, 2025📊 Outlook
Ethereum is trading in a tight range with slight upward momentum. Current RSI is neutral, and price remains above the 50-day SMA, hinting at a sustained bullish trend. The Fear & Greed Index supports this positive sentiment. A break above $2,000 could confirm bullish continuation, while a drop below $1,700 may shift sentiment to bearish.
📌 Analyst Note: Maintain bullish bias while ETH remains above $1,790.66. Monitor resistance at $2,000 for breakout confirmation.
🔍 Indicators
RSI (14): 51.60 — Neutral
SMA 50: $1,790.66 — Price slightly above → Bullish
30-Day Volatility: 4.97%
Fear & Greed Index: 61 (Greed)
Technical Sentiment: Bullish
📈 Levels
Next Resistance: ~$2,000
Next Support: ~$1,700
Short-Term Price Target: $1,804.35 by May 30, 2025


Howmet Aerospace Inc Stock Quote | Chart & Forecast SummaryKey Indicators On Trade Set Up In General
1. Push Set Up
2. Range Set up
3. Break & Retest Set Up
Notes On Session
# Howmet Aerospace Inc Stock Quote
- Double Formation
* Start Of (EMA Settings)) At 85.00 USD | Completed Survey
* ((No Trade)) | Inverted Structure | Subdivision 1
- Triple Formation
* 0.382 Retracement Area & Retest Vantage Point | Subdivision 2
* (TP1) | Subdivision 3
* Daily Time Frame | Trend Settings Condition
- (Hypothesis On Entry Bias)) | Logarithmic Settings
- Position On A 1.5RR
* Stop Loss At 125.00 USD
* Entry At 138.00 USD
* Take Profit At 158.00 USD
* (Uptrend Argument)) & No Pattern Confirmation
* Ongoing Entry & (Neutral Area))
Active Sessions On Relevant Range & Elemented Probabilities;
European-Session(Upwards) - East Coast-Session(Downwards) - Asian-Session(Ranging)
Conclusion | Trade Plan Execution & Risk Management On Demand;
Overall Consensus | Buy

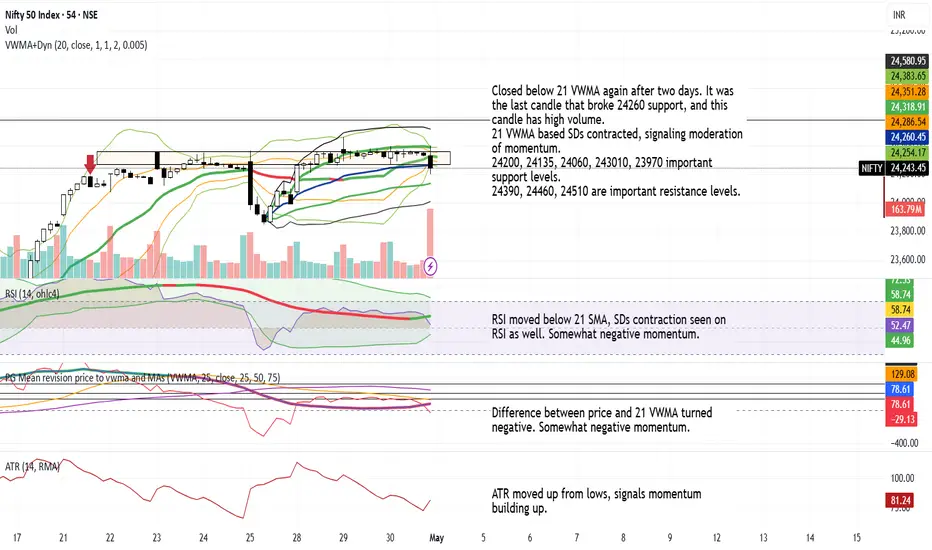
Nifty closing Near 24350, consolidation on daily n hourly chartsNifty has been closing near 24300-24360 for past few sessions. Today's closing is in consolidation zone, with big volume. A breakout may give a decisive move sometime soon.
54 mins. based chart is signals weakness but daily chart is neutral to somewhat strong. Back-to-back Dojis signal indecisiveness among participants.

TME Consolidates After Rally, Eyes $22–32 TargetIn late 2022, NYSE:TME posted its first breakout, climbing to an average of $7.50.
A sustained rally through 2023–2024 drove the price above $15, with the mean level around $11.
Since mid-2024, the stock has been consolidating at these levels, holding firm above both the 30- and 50-period EMAs as well as VWAP. However, volume has yet to pick up meaningfully in this zone. Should the move toward $15 resume, increased volume could spark another breakout.
The next upside target lies in the $22–$32 range.

Tapestry Breaks Out of Consolidation, Eyes $100From 2021 through 2025, NYSE:TPR traded in a tight $25–$50 range, with both the 30- and 50-period EMAs running flat and volume largely sideways.
At the turn of 2025, however, the EMAs began to slope upward and volume picked up.
The first meaningful pullback since then saw price slide from $90 down to $60 in February 2025, but EMA support quickly lifted it back to $70.
A sustained break above the $72 supply zone would likely fuel a rally toward the $100 psychological level—and potentially beyond.

RKT Consolidates Above $10 Ahead of $18 BreakoutNYSE:RKT has been consistently making higher highs since late 2022.
A rally toward the end of 2023 drove the price up from $7 to around $18. Although the expanded supply block at that level has capped further gains, the price continues to consolidate above $10, still finding support from the mitigation block in that area.
However, because the consolidation is ongoing, the current price trend remains unclear—both the 30- and 50-period EMAs are flat.
In the medium term, once this consolidation phase completes, the price is expected to resume its move back toward $18 and beyond.

20 inboundbeen watching awhile 4hr looks great to run there are daily averages overhead around 17 but i think we break above to 20 then confirm support at those averages.

Regis Resources Stock Quote | Chart & Forecast SummaryKey Indicators On Trade Set Up In General
1. Push Set Up
2. Range Set up
3. Break & Retest Set Up
Notes On Session
# Regis Resources Stock Quote
- Double Formation
* Start Of (Diagonal) At 1.600 AUD | Completed Survey
- Lower Band Consecutive (50 EMA)
* (Uptrend Argument)) On Continuation Area | Subdivision 1
- Triple Formation
* Wave Feature + Ongoing Entry At Wave (3)) | Subdivision 2
* (TP1) | Subdivision 3
* Daily Time Frame | Trend Settings Condition
- (Hypothesis On Entry Bias)) | Indexed To 100
- Position On A 1.5RR
* Stop Loss At 203.00 AUD
* Entry At 240.00 AUD
* Take Profit At 270.00 AUD
* (Uptrend Argument)) & No Pattern Confirmation
* Ongoing Entry & (Neutral Area))
Active Sessions On Relevant Range & Elemented Probabilities;
European-Session(Upwards) - East Coast-Session(Downwards) - Asian-Session(Ranging)
Conclusion | Trade Plan Execution & Risk Management On Demand;
Overall Consensus | Buy
