WTI TRADE IDEAhello everyone
From the previous oil movement, the entry at 58.52 moved up by 80 pips before hitting breakeven. For the upcoming open market, if the trendline and support or resistance break out as shown on the M30 chart, it could signal an opportunity to enter the market.
Ensure strong confirmation before acting, and keep an eye on shifts in market structure.
Thanks a lot for your support & best of luck
**My trading strategy is not intended to be a signal. It's a process of learning about market structure and sharpening my trading my skills also for my trade journal**
Nakedchartanalysis

XAUUSD UPDATE : FED INTEREST RATE DECISION hello & happy weekend everyone
For coming week trade forecast. From the left side, the daily chart indicates that a breakout has occurred, and the current increase is a temporary pullback. If a rejection happens at the 0.236 daily retracement and the trendline on 1 hour chart successfully pushes the price downward, I see an opportunity to short towards the upcoming Fed interest rate decision.
And I am very grateful for the support given, especially in some of the previous trades. I hope that my trade plan can help traders identify the direction to enter the market.
good luck all
**My trading strategy is not intended to be a signal. It's a process of learning about market structure and sharpening my trading my skills also for my trade journal**
Thanks a lot for your support

XAUUSD UPDATE : NFP hi everyone
I hope you were able to ride the market based on the previous trade idea.
Gold has broken below the daily support level, and the current upward movement is likely just a retracement. Therefore, both my Plan A and Plan B focus on short positions. For a stronger bullish move, the price needs to form a lower low—at least on the H1 timeframe.
good luck all
**My trading strategy is not intended to be a signal. It's a process of learning about market structure and sharpening my trading my skills also for my trade journal**
Thanks a lot for your support

WTI TRADE UPDATEhi all
Based on the current situation for WTI, with the stop loss hit from the previous trade idea, Plan A now relies on a breakout of the trendline and the support turning into resistance as confirmation for taking a long position.
However, if rejection occurs at the trendline or at the support-turned-resistance level, there's a possibility that the price will decline again, given that a breakout has already happened on the daily timeframe. Therefore, closely monitoring price movements around these key levels is crucial before making any trading decisions.
Ensure strong confirmation before acting, and keep an eye on shifts in market structure. Feel free to share any new updates, and best of luck with your strategy!
good luck all
**My trading strategy is not intended to be a signal. It's a process of learning about market structure and sharpening my trading my skills also for my trade journal**
Thanks a lot for your support

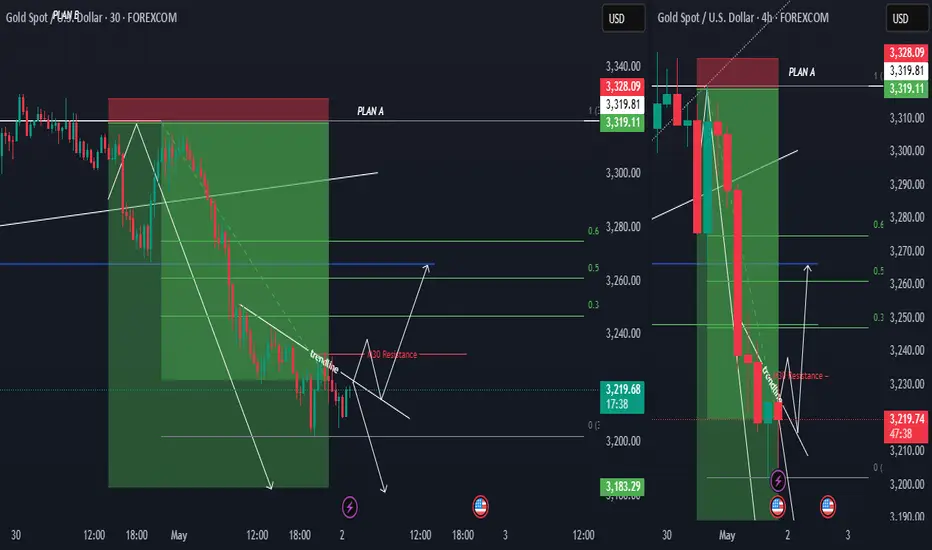
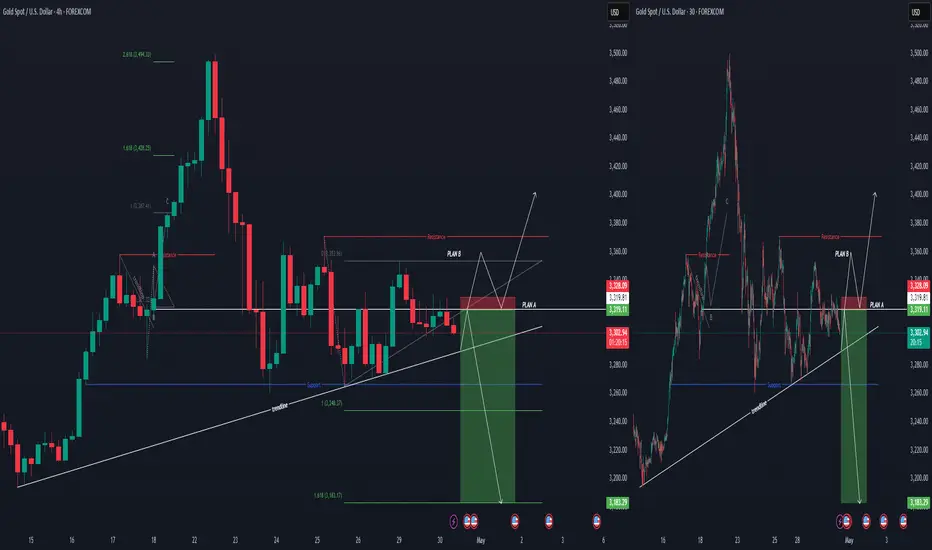
XAUUSD UPDATEHi all
The rejection at the 3202 level, Plan A remains a strong possibility, especially if the trendline also shows signs of resistance. However, if the trendline breaks, then Plan B would be the preferred approach—waiting for a confirmed breakout on the 30-minute timeframe before considering a long position.
Keep a close watch on price action and ensure strong confirmation before making any moves. Feel free to share any updates or additional insights. Wishing you success in trading!
good luck all
**My trading strategy is not intended to be a signal. It's a process of learning about market structure and sharpening my trading my skills also for my trade journal**
Thanks a lot for your support
XAUUSD TRADE IDEA
Hi everyone,
here is my gold price movement forecast. My forecast tends to lean towards temporary strength for gold. Therefore, if there is a rejection at the trendline on the H4, I will wait for the price to come back to 3320 before shorting gold... If the price successfully breaks the entry price and makes a new high, I will look for opportunities to long towards 3402.
good luck all
**My trading strategy is not intended to be a signal. It's a process of learning about market structure and sharpening my trading my skills also for my trade journal**
Thanks a lot for your support
US500 TRADE IDEAhi again
The US500 has shown strength by breaking the resistance at 5483.5 and is now at 5535. If the price reaches 5604.6 and a pullback occurs, targeting a temporary decline at the 50% Fibonacci retracement level is a good strategy.
Fibonacci retracement is often used to identify potential support and resistance levels where the price might pause or reverse. The 50% level is one of the commonly watched levels by traders as it often indicates a significant turning point in price movement.
good luck all
**My trading strategy is not intended to be a signal. It's a process of learning about market structure and sharpening my trading my skills also for my trade journal**
Thanks a lot for your support

OIL TRADE IDAHello
Hi everyone. Regarding oil movements, I see a long opportunity at the level of 59.61. If the price closes below 58.56, there is a possibility of a temporary rise before continuing to drop to 55.
good luck all
**My trading strategy is not intended to be a signal. It's a process of learning about market structure and sharpening my trading my skills also for my trade journal**
Thanks a lot for your support

XAUUSD TRADE IDEAhi all
this my trade plan until end of this month
good luck
**My trading strategy is not intended to be a signal. It's a process of learning about market structure and sharpening my trading my skills also for my trade journal**
Thanks a lot for your support

US500 BULLISH SYMMETRICAL TRIANGLEhi
Fundamental view
The **US500 index** dropped due to several key factors affecting the U.S. stock market:
📉 **Tech Stock Decline** – Technology stocks faced heavy pressure, especially after **Nvidia** plunged **6.9%** due to U.S. restrictions on AI chip exports to China. Other stocks like **AMD (-7.3%)** and **Micron Technology (-2.4%)** also fell.
💰 **Federal Reserve Uncertainty** – Remarks from **Fed Chair Jerome Powell** raised concerns in the market. Powell warned that new tariffs could trigger higher inflation and slow economic growth, making investors uncertain about interest rate policies.
🛍️ **Surge in Retail Sales** – Retail sales jumped **1.4%** in March as consumers rushed to buy before new tariffs took effect. This highlights economic uncertainty, pushing investors to sell their stocks.
Overall, a mix of trade tensions, uncertain monetary policy, and a tech stock sell-off caused the **US500 index to drop 120.93 points (-2.24%)** on **April 16, 2025**.
Technical view
Yes, the **bullish symmetrical triangle** pattern is often a strong signal for upward price movement. When the price moves within this pattern, it usually indicates a **tightening volatility** before a **breakout**, which can present a good market entry opportunity.
🔍 **Breakout Confirmation**
1️⃣ Increased trading volume when price breaks above the **upper trendline**.
2️⃣ A closing candle above the **triangle resistance** for a valid signal.
3️⃣ Price targets can be measured using the pattern’s initial height as a projection.
📈 **Potential Price Movement**
If the breakout happens, the price could surge toward the next **resistance level**. However, if the breakout fails and price moves below support, the pattern could turn **bearish**.
Warren Buffett famously said, “Be greedy when others are fearful.”
good luck
**My trading strategy is not intended to be a signal. It's a process of learning about market structure and sharpening my trading my skills also for my trade journal**
Thanks a lot for your support

GBPUSD TRADE IDEAhi all
this my trade plan until end of this month
good luck
**My trading strategy is not intended to be a signal. It's a process of learning about market structure and sharpening my trading my skills also for my trade journal**
Thanks a lot for your support

BTC TRADE IDEAhi all
Potential Triple Top Pattern
good luck
**My trading strategy is not intended to be a signal. It's a process of learning about market structure and sharpening my trading my skills also for my trade journal**
Thanks a lot for your support

XAUUSD RECAP & TRADE IDEAFrom the previous setup, we can see that the movement of gold made a breakout at the 2728 level before dropping to the take profit level at the 2.618 Fibonacci extension (2651) and then made a correction to the 50-61.8 Fibonacci retracement level (2709). So this week, I am waiting to see if the current price will head towards the 1.618 Fibonacci extension before deciding to continue the buy position. If the price successfully breaks the support level at 2642, it is likely that the price will head towards 2360-2500/90. However, if there is a bounce at the support area, the price might continue to rise towards 2690-2700.
**My trading strategy is not intended to be a signal. It's a process of learning about market structure and sharpening my trading my skills also for my trade journal**
Thanks a lot for your support

USDJPY UPDATEFrom the weekly chart, the price has reached the 61.5 Fibonacci retracement level and made a rejection at the price of 145.470 before dropping again to the level of 152.134 on the 1-hour time frame. Therefore, I am waiting for any possibility of a rejection as shown in the chart before deciding to continue selling USD/JPY

XAUUSD TRADED IDEAHi all
There are two movements, buy and sell. If the price respects the trendline, it is likely that the price will continue to drop to TP 1. However, if there is a breakout at the trendline and it makes a new high, it is likely that the price will change direction to a buy and target an all-new time high of 2874
**My trading strategy is not intended to be a signal. It's a process of learning about market structure and sharpening my trading my skills also for my trade journal**
Thanks a lot for your support

USDJPY TRADE IDEAHi all
look like its a good time to short long JPY
**My trading strategy is not intended to be a signal. It's a process of learning about market structure and sharpening my trading my skills also for my trade journal**
Thanks a lot for your support

GBPJPY UPDATEHi all
2 possible trade plan...
**My trading strategy is not intended to be a signal. It's a process of learning about market structure and sharpening my trading my skills also for my trade journal**
Thanks a lot for your support

EURJPY UPDATEhi all
this my trade plan for this week..
good luck
**My trading strategy is not intended to be a signal. It's a process of learning about market structure and sharpening my trading my skills also for my trade journal**
Thanks a lot for your support

BTCUSD WEEKLY UPDATE hi all
"Last week, BTC/USD failed to break through the resistance level of 71195 and faced rejection. So, this week, I am observing the price action to see if there is still potential for the market to decline."
**My trading strategy is not intended to be a signal. It’s a process of learning about market structure and sharpening my trading skills, as well as for my trade journal.**

GBPUSD UPDATE Next week is going to be very high-risk, starting with the US election, BOE Monetary and followed by the FOMC meeting.
Based on technical analysis, I am biased towards going long on GBP/USD after the strength of the USD leading up to the US election.
good luck
**My trading strategy is not intended to be a signal. It's a process of learning about market structure and sharpening my trading my skills also for my trade journal**
Thanks a lot for your support

EURUSD UPDATE ( HIGH RISK WEEK )Next week is going to be very high-risk, starting with the US election and followed by the FOMC meeting.
Based on technical analysis, I am biased towards going long on EUR/USD after the strength of the USD leading up to the US election.
good luck
**My trading strategy is not intended to be a signal. It's a process of learning about market structure and sharpening my trading my skills also for my trade journal**
Thanks a lot for your support

BTCUSD : DOUBLE TOP?hello all
Based on the daily chart, I believe the price has already broken the weekly support. The current price appears to be a pullback to the resistance level at 68,048. Therefore, I plan to go short on BTC if the price stays below 70,000. My target is indicated on the chart…
**My trading strategy is not intended to be a signal. It’s a process of learning about market structure and sharpening my trading skills, as well as for my trade journal.**

XAUUSD TRADE IDEAhi all
Gold is currently trading within a 4-hour range. The price has already broken the initial trendline. Now, we are waiting for the second trendline, which is between the high of $2,672.96 and the low of $2,631.92, to break. A pullback to the 0.236% Fibonacci extension area might provide an opportunity to buy the dip and cut the position if the candle closes below $2,634.37.
**My trading strategy is not intended to be a signal. It’s a process of learning about market structure and sharpening my trading skills, as well as for my trade journal.**
