EURJPY TRADE IDEAhi all
At this level, I'm expecting rejection.
Let me know what you think In the comments!
**My trading strategy is not intended to be a signal. It's a process of learning about market structure and sharpening my trading skills**
Thanks a lot for your support
Nakedchartanalysis

USDJPY TRADE IDED
Hi all
The daily has already broken out, so I'm looking for a pullback before continuing the trend; I expect the price to finish the 1.618 fibo extension.
Let me know what you think In the comments!
**My trading strategy is not intended to be a signal. It's a process of learning about market structure and sharpening my trading skills**
Thanks a lot for your support

USDX TRADE IDEAHi all
from the weekly chart, the price high and low are almost retracing 0.618%.
Additionally, the Federal Reserve is aiming to lower inflation to 2%, thus we had a pennant pattern break low, which I see as contradicting.
I therefore expect to see a cpi y/y below 3.3 in this week's upcoming release of the CPI data, which could result in strong dollar.
Therefore, I am targeting the 1.618 fibo extension with my buy stop on the daily chart.
Let me know what you think In the comments!
**My trading strategy is not intended to be a signal. It's a process of learning about market structure and sharpening my trading skills**
Thanks a lot for your support

XAUUSD TRADE UPDATEHi all
following the breakout from level 1942.1 gold has reached the fibo extension of 1.618.
So I'm looking for a pullback to the last breakout level to continue shorting as long as the price does not close above the level where I'm comfortable to take a risk.
Let me know what you think In the comments!
**My trading strategy is not intended to be a signal. It's a process of learning about market structure and sharpening my trading skills**
Thanks a lot for your support

XAUUSD WEEKLY TRADE (UPDATE)After a few days, daily support at 1924 was broken. So, what's next? In my opinion, there are two important supports on the daily and weekly charts.
As a result, a break from those levels may result in additional decline. On the other hand, if rejection occurs, the next resistance will be in 1941.
Keep an eye on the weekly trendline as well.
Let me know what you think In the comments!
My trading strategy is not intended to be a signal. It's a process of learning about market structure and sharpening my trading skills.
Thanks a lot for your support.

USDJPY TRADE IDEAHi all
I'm looking for a long opportunity in the USD/JPY to finish the wave 5.
Good Luck to all
Let me know what you think In the comments!
**My trading strategy is not intended to be a signal. It's a process of learning about market structure and sharpening my trading skills**
Thanks a lot for your support

XAUUSD WEEKLY TRADE IDEAHi all..
This is my forecast for xauusd;
I see resistance at 1973.160 after many rejections on that level.
On the high low structure, I believe we have a double top pattern.
so I'm shorting gold for a 50% retracement as long as the price doesn't close over the 1987.530 level.
Let me know what you think In the comments!
My trading strategy is not intended to be a signal. It's a process of learning about market structure and sharpening my trading skills.
Thanks a lot for your support.

The truth of Market TrendGBPCHF BUY AND SELL LONG analaysis. as we can see market structure starting downtrend on DAILY, but breakout SELL on H4, so the next movement that i predict the price will retrace zone (1.1312 - 1.1205) before back to the top (1.4511-1.14843) and start major downtrend till price hit 1.109525

USDJPYA Indecision pullback to resistanceUSDJPY is in an intraday uptrend again. The overall trend is bullish however I believe that this is a re-test of the former high and based on how price is approaching the resistance it doesn't signal much bullish strength anymore. Price is currently at a high of an untested zone, the all time high and a Daily evening star pattern.

USD/JPY REST STOPUJ has been bulling very hard as of lately. With the never ending rate hikes pushing up the price of the dollar, and many foregin countries defaulting on their national debts, it is midnight in lots of places but it seems Powell is still squuezing everything he can out of the dollar.
Technically speaking we see here a very nice looking rising wedge type pattern developing on the H4. although we are in a CLEAR UPTREND, UJ has seemingly overstepping its bounds and should need some type of rest stop before over taking this resistance, if it is to do so. There is a potential that the dollar could break through this very strong resistance level but my inclination is to sell this pair down to earth and prepare for it to push back upwards again.

USDJPY BEAR SWING RESUMEEOur USDJPY bear swing paused about 300 pips ago and created a temporary bottom from which we took short term buys from
After a nice run of 200+ PIPS we are EXIT the shorts. Now USDJPY should resume its bear swing on the route to new lows. From a technical aspect this retracement has come up to retest the overall trend at the 38 Fib level. Normally I would be expecting a further correction, up to the 50 area but under these economic conditions I expect USDJPY to resume its bear trend at a much more aggresive rate than most trends. Right now the "Carry Trade" is about to work against the dollar, as outflows continue to pull USDJPY down. Make no mistake there is a LOOONG way for this pair to fall still.
We are emtering longs with stop losses above the recent "Lower high"
If for some reason the bullish momentum were to resume, I would still be looking to SELL USDJPY around the 50 fib or 134 area.
Theres not much to update on the fundamentals. The US economy is still heading towards recession faster than the FED RESERVE can control. Yen has a long way to go before it becomes "overvalued" in this environment currently. USDJPY sells will always be the safer option for the near term.

CABLE LONG TERM BUY SWINGHere it is Folks, the moment we have all been waiting for
After months of testing and retesting the upper bounds of the 1.24 area. it appears that CABLE has broken out and will now begin a very solid and consistent BULL SWING. Looking forward to buying and buying again on every dip.
Fundamentally this is being set up by the incoming US recession and data weakness is starting to slowly creep into the numbers. There is nowhere to go for this currencypair but up.
***POTENTIAL FAKE OUT DURING NFP TOMORROW POSSIBLE, OVERALL OUTLOOK WILL REMAIN UNCHANGED REGARDLESS OF ANY DEEP RETEST DURING NFP***

USD/JPY BEAR SWING RETRACEMENTUSD/JPY bear swing was absolutely beautiful, but we are not done yet
Usdjpy has a looooong way to drop still, the impending US recession is not going to be pretty and the moment the market gets a single whiff of hawkish-ness from the BoJ, this pair will sink to the bottom of the ocean like ATLANTIS
In the mean time however it looks as though the bear swing has run out of some steam, and a healthy retracement is in store. Fundamentally DADDY JPOW just raised the US rates by 25 basis points, which in all likelihood will bring some short term support to the dumpy dollar.
Either ride USDJPY to the Yellow or Green zones, depending on how strong momentum and price action is.

BITCOIN RIGHT SHOULDERLots of fun things and happening around the crypto world the past few months
From Mr.SpankMan Fraud to banks dissolving out of existence and lets not forget liquidity crisis abound. From a fundamental standpoint things arent so great in the United States for crypto. STILL congress has dragged their feet and has yet to provide any significant framework for how they want crypto banks/business to run that are based out of the USA. This is in contrast to Europe and Asia where crypto regulations and regulatory bodies have laid out a much more concrete, if not still obscure, framework for how they want crypto businesses to operate.
From a corelation standpoint, Bitcoin is becomming less and less corelated to the overall US stock market, which is a good thing in general and should continue. Silvergate is not helping the situation but the lack of liquidity only means that volatility will increase. In times like these i like to go back to technicals, and from a technical standpoint THIS IS SOME ELEMENTARY SCHOOL BASIC PATTERN FOREX TRADING 101
RIGHT SHOULDER, STOP LOSS BELOW "HEAD" BUY BITCOIN DUHHHHHHHHHHHHHHHHHHHH

JPYX INC BULL SWINGJapanese Yen is nearing a crucial point of FIBO level 61
This level can be see as a pivot point for price action many times over and over again
The yen fundamentally is in a 20+ Year run of Qualatative easing and negative interests rates
The new BoJ Ueda seems very reluctant to use any type of terminology that leads one to believe that a swift change is on the horizon
However the tides are still shifting for the YEN and the consensus of a great majority of economists in the region is that its not a matter of IF QE will stop, its just a matter of WHEN
Assuming our critical fibo level holds as support for the WEEKLY uptrend, then we should see the DAILY/H4 trend turn from BEAR to BULL at these levels
Our targets are painted by the Fibo Extension of the potential support levels

CABLE BULL BREAKOUTAfter several weeks of Price action consolidating on CABLE inside of a DESCENDING WEDGE and forming several HARMONIC PATTERNS it appears as though we finally have a winner between the bulls and the bears. Based on the price action a bottom has been formed and a breakout of the WEDGE PATTERN has occurred. Assuming this is a STEP ONE BREAKOUT and a total reversal of the bear momentum, we should see a RETEST next week, potentially during CPI, and a KISS of the broken trend.
Entries have been painted in two parts along with a stop loss BELOW the painted support areas @1.192, if CABLE is to break back into the pattern and challenge the bottom formation again, we will get out before it does so. If all goes well a new BULL TREND could form and CABLE will attempt to make a NEW HIGH

4 HR ANALYSIS - Will GBPJPY FINALLY break out of this Flag?Hey guys,
So, on my last post I said I wanted to see price come up to 163.500 to fill that imbalance on the left and also retrace deeper into the higher time frame bearish fib (it was already hit but I wasn't convinced that that was enough I needed it to at least pull up to the .618 level.
So now that price has given us that, we just need to plan accordingly and see what price wants to do from here onwards. :)
As always - I have more than 1 option just in case, but I would like to see GJ pull back before trending higher even if its temporarily.
Option 1: Bullish
Price may come down to either 159.500 or 160.500 to remove liquidity and accumulate sellers before it reverses and takes off bullish. It just looks too good to be true if it only trends bullish from where we are now or if it just reverses and drops straight from there Aswell.
Remember - If it looks too good to be true, it usually is, and we know that the markets don't work like that obviously. Also, the overall sentiment is bearish for GJ so it makes sense to keep accumulating sellers and luring them in and then reverse from there.
Option 2: Bearish
Price may just want us to think its manipulating us to go bullish and may actually go bearish in the end so we can't completely write this additional perspective off because it is very possible. It may come down to 159.500 or 160.500 and then retrace from there and accumulate buyers only then to drop and continue bearish removing all liquidity from the previous lows over the last few months.

USDJPY WEEKLY PLAN UPDATEHi all
I was aiming for a 50% retracement between the high (151.946) and the low (127.220). but in order to move higher or back down to the 128 level, resistance at 131.580 must be broken.
Happy weekend
My trading strategy isn't intended to be used as a signal service. It's a process of gaining knowledge of market structure and improving my trading abilities.
Like and subscribe and happy trading to all

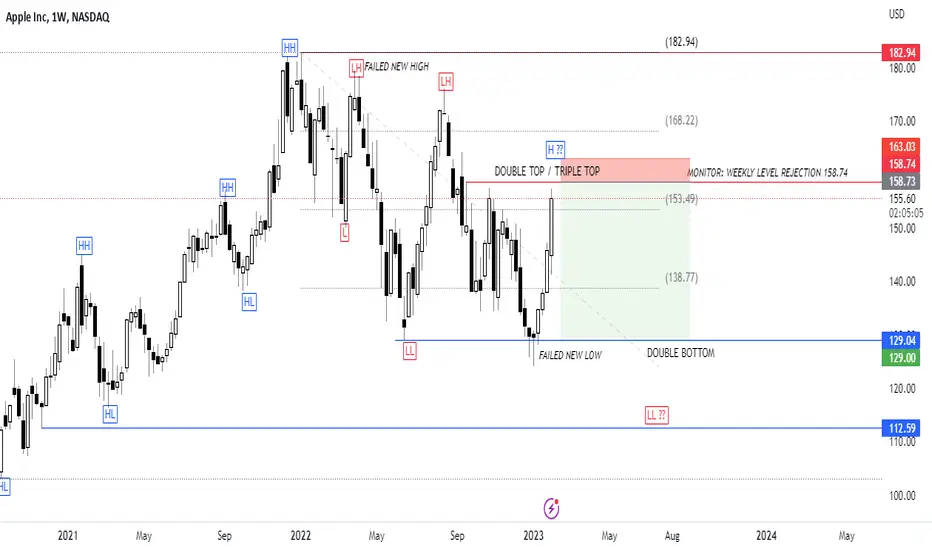
AAPL MONTHLY TRADEHi
After falling from 182.94 and reaching 50% retracement, the AAPL is currently in a downtrend. Not sounding good if key level 158.74 failed to hold
Happy weekend
My trading strategy isn't intended to be used as a signal service. It's a process of gaining knowledge of market structure and improving my trading abilities.
Like and subscribe and happy trading to all
S&P 500 MONTHLY TRADE Hi all
After falling from 4818.62 and reaching 50% retracement, the S&P is currently in a downtrend. There are still three weeks left to determine if the market will turn south or north, as long as 4146.88 holds. S&P could return to 3491 or 3818.
My trading strategy isn't intended to be used as a signal service. It's a process of gaining knowledge of market structure and improving my trading abilities.
Like and subscribe and happy trading to all

GBPJPY TRADE IDEAwaiting for the downtrend structure to break
My trading strategy isn't intended to be used as a signal service. It's a process of gaining knowledge of market structure and improving my trading abilities.
Like and subscribe and happy trading to all

EURJPY WEEKLY TRADE Hi traders,
Same goes with EURJPY is still moving within the consolidation area between the lowers 142.939 and the high 142.939.
The market ended the weekend with a high of 140.754and a low of 159.587.
still waiting 140.620 or 140.297
My trading strategy isn't intended to be used as a signal service. It's a process of gaining knowledge of market structure and improving my trading abilities.
Like and subscribe and happy trading to all

EURUSD DAILY TRADE Hi all
As of right now, what I can tell is that there is a whipsaw pattern before the peak, with the highest price being 1.09308 and the lowest being 1.08350.
I'm interested in trading at the levels 1.09031 and 1.09308. Before reentering the market, watch for a rejection at the 1.098533 level if the peak is broken.
Share your thoughts
My trading strategy isn't intended to be used as a signal service. It's a process of gaining knowledge of market structure and improving my trading abilities.
Like and subscribe and happy trading to all
