🧅Nas100 1:10 RR 1:10 RR on Nas100
1.price already reached 15m OB
2.price already reached Daily FVG
target at Last Low candle on Daily TF which is Daily FVG
.
Good Luck Trader 💯💯
.
.
.
🧅Disclaimer :There are risks associated with investing in securities. Investing in stocks, bonds, exchange traded funds, mutual funds, and money market funds involve risk of loss. Loss of principal is possible. Some high risk investments may use leverage, which will accentuate gains & losses. Foreign investing involves special risks, including a greater volatility and political, economic and currency risks and differences in accounting methods. This is Not Financial Advice
🧅JUST AN OPINION OF THE ONION.🧅
Nas100analysis

NAS100 Daily Outlook | 16-MayHappy new week,
Are we gonna start the week with good profits?
Let's find out. I will keep updating until trade closes.
Kings.

NAS100 Daily Outlook | 13-MayHolla Amigos,
This is what am looking at today. Hopefully price actions respects my setup.
I will update in-between trades.
Kings

Nas100 possible scenariosNas100 closed high on Friday with at least 6% from it is recent low of 11700. It's next resistance is seen at 12570. A break above this level will send price to the second resistance at around 12940. If bears defend 12570 we could see a push of price to the downside and the nearby support will be at around 12114.
Traders, please do support this idea with likes if you find this helpful.
All the best for the coming week.

1:15 RR NAS100🧅NAS100 thanks to michael ICT
.
.
.
This is Not Financial Advice
.
🧅JUST AN OPINION OF THE ONION.🧅

NAS100 New Entries + Exits (Best Reverse Strat Ever)The 1on1 video is currently out, if you would like it in order to understand how to play my analysis FULLY, please let me know privately.
All likes/comments and feedback are very much appreciated!
How to play my chart:
Buy at support, sell at resistance. When you open this chart you'll see a green entry and a red entry. When the candlestick hits the green entry, you place a buy. If however that support buy doesn't go into profit and goes negative -35 or -60 pips (depending if it was a fast break/or if the break landed on a minute 15 zone), if it breaks you would then exit your buy and immediately enter the sell. You would then ride that sell down to green TP1, or you could then repeat and play the buy/break there.
The same exact thing goes for resistance sell/break plays!

(Nas100) it is not what you think!It is not what you think, but what the big guys think! 12000 might not be the bottom.
Hey everyone!
Let's take a look at Nas100 and see what is currently shaping up. The index has really faced a critical moment the past few months, leaving so many speculations among investors as to where the bottom will be before it skyrocket again. I had to take a moment to look at the index thoroughly, also evaluating the performance of major tech stocks that influences the direction of the index. I have a feeling that the bearish move on Nas100 is not yet over and we can still expect further decline towards the 200 simple moving average which aligns with our next support around 11000 (November 2020 low). I think the big whales are eyeing this level.
I also attached the chart of one of the giant tech stocks that I find to influence the direction of Nas100- Tesla.
What we see below is a larger correction and it seems like tesla has to fall to the support of this larger correction. If so happens, then we have no doubts that Nas100 will continue facing downward pressure in the coming days.
Do you have any suggestion or opinion? Please be kind to write it in the comment section below.
Do also consider showing your support of the idea with likes.
Tesla chart

My trade setup for next week (1)my trade setup for next week (1)
.
This is Not Financial Advice
.
🧅JUST AN OPINION OF THE ONION.🧅

Nas100: Bullish continuation from key levelsHello everyone,
Thanks to everyone that continues to show support to my ideas I post here. In my previous idea I mentioned of Nas100 and the falling trendline that needs to be breached to confirm a fresh new bullish trend. It was great that we managed to take the first move and reached our first target and hoping to hold some positions for longer term. If you followed my previous idea, congrats to you.
Previous idea
What do we see right now?
As I said the market breached the sloppy downward trendline and the market is now showing strong bullish signs. Here is what I expect today:
At the time of writing the market has already pulled down to 13384.14 area. Basically this is a key level that was slightly breached. I am expecting that there would be some sort of retest at this area and price pushes up. If the retest would not be sold enough then we can expect a drop to 13160-13167, around this level there is also a key level. From these points we can expect the market to rise. This same applies to US30 and S&P500, these two counterparts will also rise. Please do take time to check out my other previous ideas by following the links below.
First goal for Nas100 at 1415
Traders, please do support this idea with likes. Your continuous support is highly appreciated. If you have different opinion please feel free to share in the comment section below.

Nasdaq Analysis Hello Everyone.
Another great trade as planned. As analysed yesterday the price broke down this triangle it formed yesterday and reached the first target 12976. Price will most likely continue to push to areas of 12786.
Learning to draw key areas is so important as prices bounce around these areas. If you can get your key areas right you will not even need any drawings and pure price action will be sufficient enough to take trades. Many people struggle with drawing support and resistance lines however with the correct techniques it is very simple.

Nas100 can dive under 13k againAt the end of March and the beginning of April, Nas100 had 2 failed attempts to conquer 15k important figure.
Since then the index has dropped 2k points and now it seems to be ready to continue its downward trend under 13k
The recent recovery is in a flag and a drop under the pattern's support can lead to further losses towards 12.5k
In the medium term I will remain bearish on Nas100 as long as the price is under 14k

NAS100 short term for long position III
.
let's see if it's will break the trend and go to the down side or not
.
.
what do you think ?
.
.
This is Not Financial Advice
.
🧅JUST AN OPINION OF THE ONION.🧅

NAS100short term target for long position at 15m bearish OB
.
This is Not Financial Advice
.
🧅JUST AN OPINION OF THE ONION.🧅

🧅NAS100 i hope to see a short term retest then continue with a big drop
.
this is only my technical with " 0 " fundamental
.
This is Not Financial Advice
.
🧅JUST AN OPINION OF THE ONION.🧅

🧅Another good entryAgain with another good entry for NAS100
.
target still at previous equal low
.
.
This is Not Financial Advice
.
🧅JUST AN OPINION OF THE ONION.🧅

🧅 1:13 1:13 RR on NAS100
.
open position around previous high OB
.
target at previous equal low
.
.
This is Not Financial Advice
.
🧅JUST AN OPINION OF THE ONION.🧅

NAS100 Daily Outlook | 22 - AprPrice printed huge changes yesterday with up to 300 pips profits. Today, an very keen to see what price has in stock for us.
I will update result later.
Kings.

🧅 waiting for confermation on NAS100 1:6 RR on NAS100
.
with 73 pips SL
.
waiting for third wave
.
pending buy position at previous OB
.
This is Not Financial Advice
.
🧅JUST AN OPINION OF THE ONION.🧅

Nasdaq's 14,000 support line holding so far Nasdaq's 14,000 support line holding so far
Despite all talk of aggressive tightening, US stocks including the tech-heavy Nasdaq is holding firmly. For the 4th session, buyers haven't hesitated to jump in to buy the dip every time the Index has dropped below the 14,000 level, representing a 15% drop year-to-date.
Strong earnings are making it difficult for the bears, and technicals are signaling the index is willing to retest the 14,400 resistance before making any leg lower (if any).

NAS100 Hrly long | Algorithm Trade NAS100 hrly long
buystop @ 14830
TP #1 @ 14954 77.78% wr
TP #2 @ 15054 56.67% wr
SL @ swing low 14574 12.22% hr
WR and HR determined from past trades on this pair, on this timeframe.
More trades like this on my profile and on Bifrost Trades.


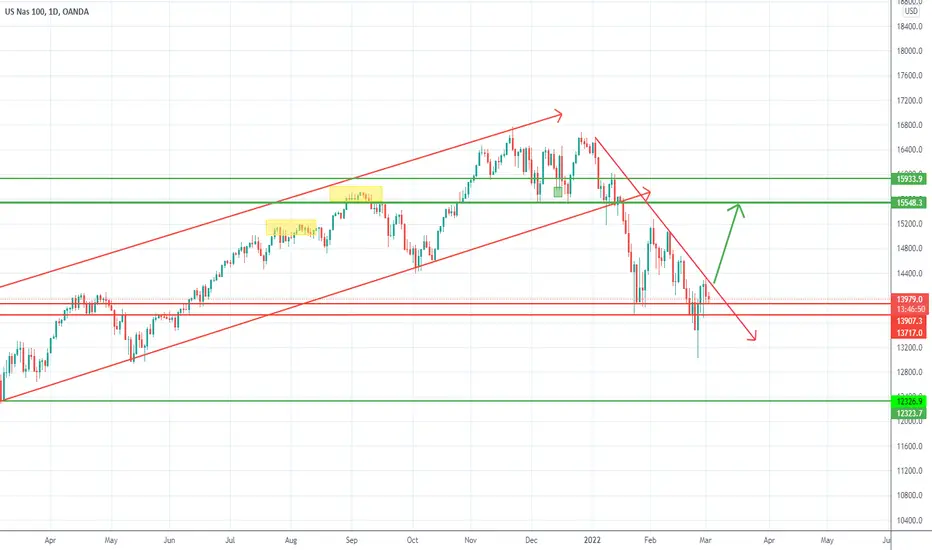
Nasdaq100- Was 13k the bottom for this correction?War or not war, Nas100 reversed strongly from 13k zone and increased 10% in just 3 days.
At this time the price is in a normal correction and if 13500-13700 holds, we can expect a new leg up to 15500.
That being said, bulls can look for opportunities to buy in that zone with a negation under 13k.
Best of luck!
Mihai Iacob
NASDAQ Holding WeeklyNASDAQ has touched the second support (turning into a bearish market) but quickly returned above the first support.
We're in an uncertain time. However, a strong return above the weekly support usually points towards a bullish movement and candle looking bullish.
I'm keeping my rating neutral for now due to the external events and Bullard repeating he wants to see FED rates 100 BP higher by July 1.
