NAS100 Technical Analysis and Trade Idea👉🔍 In this video, we analyze the NAS100. It's evident that US100 has been showing bearish momentum in recent times. However, I anticipate a retracement as it has traded into a key support level. My strategy involves monitoring the 5m chart for signs of sideways movement and a potential reversal, which could present a scalp/day trade buying opportunity targeting the previous bearish imbalance.
It's important to note that these observations are speculative and not a definitive forecast. Confirming specific price movements is crucial before considering any buying or selling decisions, as elaborated in the video. The video provides a comprehensive analysis of the current trend, market structure, and price dynamics. Remember, this educational content is designed to enhance understanding and does not guarantee outcomes. Trading inherently involves substantial risks, so employing robust risk management techniques is essential. 📈🔔
Nas100idea

NAS100 US100 Trade Idea NASDAQConsidering the NAS100 is currently exhibiting a strong bullish trend, there may be a potential buying opportunity if it retraces into a discount zone near the 61.8% Fibonacci level. US100 NASDAQ
Trading involves risks, and past performance is not indicative of future results. Always conduct thorough analysis and consider risk management strategies before making any trading decisions.

NAS100 NASDAQ Technical Analysis and Trade Idea US100👉🔍 In this video, we analyze the NAS100 index. It's evident that the NASDAQ has been showing strong upward momentum in a bullish trend. However, considering today is Friday, I anticipate a potentially sharp retracement with the US100. My strategy involves monitoring the 15-minute chart for signs of sideways movement and a potential reversal, which could present a selling opportunity targeting the previous swing low.
It's important to note that these observations are speculative and not a definitive forecast. Confirming specific price movements is crucial before considering any buying or selling decisions, as elaborated in the video. The video provides a comprehensive analysis of the current trend, market structure, and price dynamics. Remember, this educational content is designed to enhance understanding and does not guarantee outcomes. Trading inherently involves substantial risks, so employing robust risk management techniques is essential. 📈🔔

Nas100 Long term ProjectionsNas100 making bullish pennant pattern and after breakout on the upper side we can see the potential projection marked.
Manage your risk for long term trade.

NAS100 NASDAQ Technical Analysis and Trade IdeaIn this video, we delve into a concise analysis of the NAS100 (NASDAQ US100). Despite recent bullish momentum, it’s currently overextended, reaching all-time highs. Our primary objective is to pinpoint a suitable buy entry point within this critical support zone, assuming price action aligns with our analysis from the video.
As always, the video imparts valuable insights on trade entry points, trend analysis, market structure, and price action. Please bear in mind that this content is for educational purposes only and should not be construed as financial advice. 📈🚀📊

NAS100 I Sentiment remains bullish I watch for these key areasWelcome back! Let me know your thoughts in the comments!
** NAS100 Analysis - Listen to video!
We recommend that you keep this pair on your watchlist and enter when the entry criteria of your strategy is met.
Please support this idea with a LIKE and COMMENT if you find it useful and Click "Follow" on our profile if you'd like these trade ideas delivered straight to your email in the future.
Thanks for your continued support!Welcome back! Let me know your thoughts in the comments!

US100 NAS100 Technical Analysis and Trade Idea Taking a comprehensive view of the NAS100 (NASDAQ) , we observe a prevailing bullish trend, particularly evident when analyzing the weekly charts. Notably, we’ve identified bullish price action—a decisive break in market structure on the 4-hour timeframe—which could potentially shift the 4-hour trend to bearish in the short term before it continueds bullish. In our video, we delve into trend analysis, explore price action dynamics, dissect market structure, and introduce key technical analysis concepts. Toward the video’s conclusion, we present a trade idea. It’s essential to emphasize that this information serves educational purposes only and should not be construed as financial advice. 📈🚀📊

NAS100 NASDAQ Technical Analysis and Trade IdeaThe US100 index demonstrates a strong bullish trend on the daily timeframe. Our main goal is to identify a buying opportunity that aligns with this trend. Assuming price action unfolds as described in the video analysis, favorable trading conditions are anticipated. The video covers critical elements, including trend analysis, price action insights, market structure, and a potential trade setup. Always exercise prudent risk management when trading, and keep in mind that this information is purely educational and not financial advice. 🚀📊

NAS100 (NASDAQ, US100) Technical Analysis and Trade Idea The NAS100 (NASDAQ, US100) has traded into a 1D and 4H nested bullish order block. Currently we are seeing an aggressive pullback down into our optimal entry zone. In the video we cover the trend, price action, market structure and I share a couple of trade ideas for consideration
It's important to note that the information shared is intended purely for educational purposes and does not constitute financial advice. Trading entails inherent risks, underscoring the criticality of implementing robust risk management protocols consistently.

NAS100 (NASDAQ / US100) Technical Analysis and Trade Idea The NAS100 has broken market structure (bearish) on the 1W and 1D timeframes. Currently we are seeing a bullish rally on the 1D and 4H US100 into a key resistance level. In the video, we meticulously assess the prevailing NASDAQ trend, market structure, and price behavior, deliberating a prospective buying opportunity.
It's important to note that the information shared is intended purely for educational purposes and does not constitute financial advice. Trading entails inherent risks, underscoring the criticality of implementing robust risk management protocols consistently.

NAS 100 I Potential pullback and long from supportWelcome back! Let me know your thoughts in the comments!
** NAS100 Analysis - Listen to video!
We recommend that you keep this pair on your watchlist and enter when the entry criteria of your strategy is met.
Please support this idea with a LIKE and COMMENT if you find it useful and Click "Follow" on our profile if you'd like these trade ideas delivered straight to your email in the future.
Thanks for your continued support!

NAS100 Scale in pos.08.04.2024
Check my last Nas100 post. Scale in position.
Despite a slight upward movement followed by a significant drop, I'm still adhering to the overall bullish trend. We're currently at a low point where we're likely to witness bullish price action. NAS100 still has liquidity above, so I'm not anticipating bearish pressure, but time will tell.
scale in pos. on aggressive entry module

NAS100 Long Set UpThursday, 04.04.2024
We took the previous weekly low and touched my 8 EMA.
On the daily timeframe, we have two strong daily wick rejections at my daily VWAP low, and we also observed important daily liquidity lows. Now, a small pullback is expected, followed by a long.
Aggressive entry module

NAS100 Technical Analysis and Trade IdeaIn the video, we explore a potential trading opportunity in the NAS100 index. Our analysis involves assessing the current trend, studying price fluctuations, evaluating market structure, and identifying a potential entry point under favourable conditions (if they occur), as explained in the video. Remember to integrate robust risk management principles into your trading strategy. As always, please note that this information is purely for educational purposes and should not be interpreted as financial advice.

NAS100 Technical Analysis and Trade Idea #US100 #NASDAQNAS100 has traded bullish and is currently over extended. In the video we look at the trend, market structure, price action and we discuss two potential trade opportunities on both the 1D and 4H time frames. Not financial advice, manage risk well.

NAS100 Trade IdeaThe US100 index has retraced, entering a bullish 1D order block. Analysis of the prevailing trend on this timeframe indicates a clear bullish trajectory. I am eyeing a potential buy entry opportunity within at 61.8% Fibonacci retracement levels. Employing a risk management strategy, stops will be placed below the preceding low, while targeting the previous high and potentially beyond with the implementation of a trailing stop. However, it's imperative to note that trading carries inherent risks, and past performance is not indicative of future results. Therefore, traders should conduct thorough research and exercise caution before making any financial decisions.

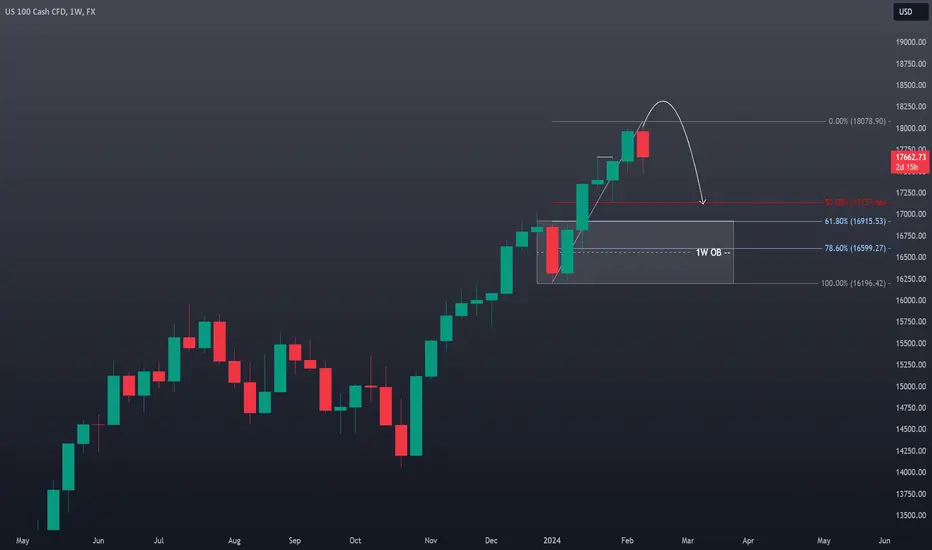
NAS100 Technical Analysis and Trade Idea - Full ExplanationMarket Observations: The #NAS100 has maintained a bullish trajectory. However, price action on the monthly timeframe suggest the #US100 is overextended. Additionally, the weekly chart reveals a double top pattern, hinting at a potential retracement down to the 50-61.8% Fibonacci levels. This area could provide the liquidity needed for major market players to fill long orders.
Trade Strategy: Consider an intraday/swing trade short entry following a potential stop run above the current range. Target an initial profit level around the previous lows near 17250, with a secondary target at 17000 (slightly above the 61.8% Fibonacci level on a 1W chart). Implement a well-placed stop-loss order to manage risk effectively.
Disclaimer: This analysis is based on my observations and does not constitute financial advice. Conduct your own independent research and carefully assess your risk tolerance before making investment decisions.

NAS100 Technical Analysis and Trade Idea
Market Observations: The #NAS100 has maintained a bullish trajectory. However, price action on the monthly timeframe suggest the #US100 is overextended. Additionally, the weekly chart reveals a double top pattern, hinting at a potential retracement down to the 50-61.8% Fibonacci levels. This area could provide the liquidity needed for major market players to fill long orders.
Trade Strategy: Consider an intraday/swing trade short entry following a potential stop run above the current range. Target an initial profit level around the previous lows near 17250, with a secondary target at 17000 (slightly above the 61.8% Fibonacci level on a 1W chart). Implement a well-placed stop-loss order to manage risk effectively.
Disclaimer: This analysis is based on my observations and does not constitute financial advice. Conduct your own independent research and carefully assess your risk tolerance before making investment decisions.
NAS100 Technical AnalysisThe #NAS100 has been on an upward trend, but a potential triple top pattern is forming on the chart. If the #DXY retraces further and rebounds from support, the #US100 could spike above the current high, potentially taking out buy-side stop-loss orders before pulling back down to the 61.8% Fibonacci level. Remember, trading the #NASDAQ involves significant risk. This analysis is just my opinion and shouldn't be considered financial advice.

Nas100 HTF Analysis I expect Nas to reach 17k in the next few weeks. Nas has been pushing up relentlessly last few weeks so expecting ATLEAST a nice pullback. Once we hit 17k tho we could see all time highs again!

NAS100 Trade IdeaThe NAS100 experienced a substantial rally towards the end of last week, displaying signs of being significantly overextended. A retracement may be in store, particularly if the Dollar Index (DXY) maintains and strengthens its position, considering the general inverse correlation between DXY and US100. It is essential to emphasize that this analysis is provided exclusively for educational purposes and should not be construed as financial advice.

Nas100 Short SetupExpecting H4 to change to bearish after taking the previous day’s low so anticipating the H4 making a LH here and dropping. Possibly seeing a move down during Asian session, although this is rare. Risking .5% of my account and targeting 3R.

NASDAQ 100 TECHNICAL UPDATENasdaq 100 technical analysis, as am going long on the indices, looking for the market to go back again on the all time highs.
