$NDX $SPX $DJI forming ominous patternAs we mentioned yesterday, the TVC:NDQ is poised for a big move some time this month.
After posting that, noticed this pattern. Was busy so didn't write it up.
Was out all day celebrating daughter & nephew's bday🎉
Do you see it on the DJ:DJI & CBOE:SPX as well?
We bring up the Head & Shoulder Pattern every so often. It signifies tops.
HOWEVER, this pattern needs the confirmation of breaking the neckline (bottom line - support), especially with volume.
TVC:RUT stays in channel the entire time
#stocks NASDAQ:QQQ AMEX:DIA CBOE:SPX AMEX:IWM
NASDAQ 100 CFD

08092023 - #NDXYesterday, I gave only 1 direction, to long NDX from support below. NDX was unfortunately weak these days and it broke to the next support, but that was at the same time that SPX hit the super strong 4429 support and it was good for a long. But would say it was much whipsaw then before the move higher. Very choppy move nonetheless. Do read what I wrote for SPX but looking for a move higher. DBZ would likely be first resistance offering a pullback; I do not have specific levels for NDX, but looking for SPX 4483 to trade. Overall, NDX is weak so looking to long SPX would be a better trade.

$NDX big move incomingOriginally posted something like this, roughly, 4hours ago
TVC:NDQ is closing in on the 2023 term trendline again.
Weekly this is shown more clearly.
Back to daily charts:
LOWER HIGHS
HIGHER LOWS
What pattern is this? Symmetrical Triangle!
What does that mean? #NDX has a big move coming this month.😱
#stocks

07092023 - #NDXI said to look for longs only for NDX; was looking for a move higher but instead price came down. 15289 given yesterday (at about where WBZ is, though was not looking for it to be traded TBH), gave a good long for a 100points up. What's next? Based on options, looking for possible ranging for the next 2 days, with possible trades to short 15487 for a move down or long 15241 for a move higher.

Short Zscaler ZS againShort ZS again. Argument for a triple top. Weekly might print a long legged doji. Moving average acting as continued resistance. Red line invalidation. Not adavise, good luck.

NASDAQ This 4hour Golden Cross is the buy signal you needNASDAQ / US100 finished forming a Golden Cross on the 4hour time frame yesterday, the first such pattern since March 22nd.
This is a standard technical bullish signal and as long as the 1day RSI stays over its MA, you can remain bullish.
Target 16250, which is the Fibonacci 1.236 extension.
Follow us, like the idea and leave a comment below!!

06092023 - #NDXNDX was much strong yesterday but as mentioned 15550 was the strong resistance and market is rejected by it. Given the strength of NDX, I am more inclined to only go long at 15344/15288 (15344 more likely to trade) as the two strong support levels, with 15749 as strong resistance and possible magnet.

NASDAQ: Aiming at 16300 after this short consolidation.Nasdaq is on the fifth day of consolidation in a row, with the support of the 1D MA50. The 1D timeframe is on bullish technicals (RSI = 57.978, MACD = 55.620, ADX = 42.134) as the Channel Up since the start of the year is still intact. In fact the recent Bullish Cross on the 1D MACD has print a similar pattern to the March 13th bottom on the HL trendline of the Channel Up.
Consequently, this consolidation is similar to the 10day one from March 17th to 28th, both over Fibonacci 0.618. We consider this a buy signal, and we aim a little lower than the 1.382 Fibonacci extension (TP = 16,300).
## If you like our free content follow our profile to get more daily ideas. ##
## Comments and likes are greatly appreciated. ##

Evening Update: What Worries Me in the Short Term?It’s not the Fed.
My perspective is Chairman Powell has been fairly clear in his updates to the markets. The markets simply don’t want to hear any of it.
It’s not bonds, or interest rates.
Those are trackable and I have posted on the 2yr and 10yr bond yields. Yields are creeping higher and have done so since the October lows.
It’s also not corporate earnings.
If NVDA couldn’t save the Nasdaq…then all hope is lost. Well…not all. Lol
Nope, it’s none of that.
It’s the potential for a government shutdown with an October 1st deadline. Is that going to be our catalyst? In truth, I don’t know. But according to CNBC, since the United States is in a Presidential election year, the stock market can’t go down. Have I mentioned CNBC is more detrimental to trading for profit than anything.
I have long contested that the US markets are in a multi-generation reversion to mean cycle. In EWT terms…a super-cycle wave IV. These excuses mentioned above, are all the old paradigms of a 100-year-old bull market which carved out our super-cycle advance in what I am forecasting as a super-cycle wave III top that occurred in January 2022. If my analysis is correct, (and it is by no means a slam dunk as to where we are right now in the indices)…the January 2022 highs will NOT be revisited for a long, long time.
In the short term, let's see if the US Congress proves Fitch's downgrade of US Debt was warranted.
Best to all,
Chris

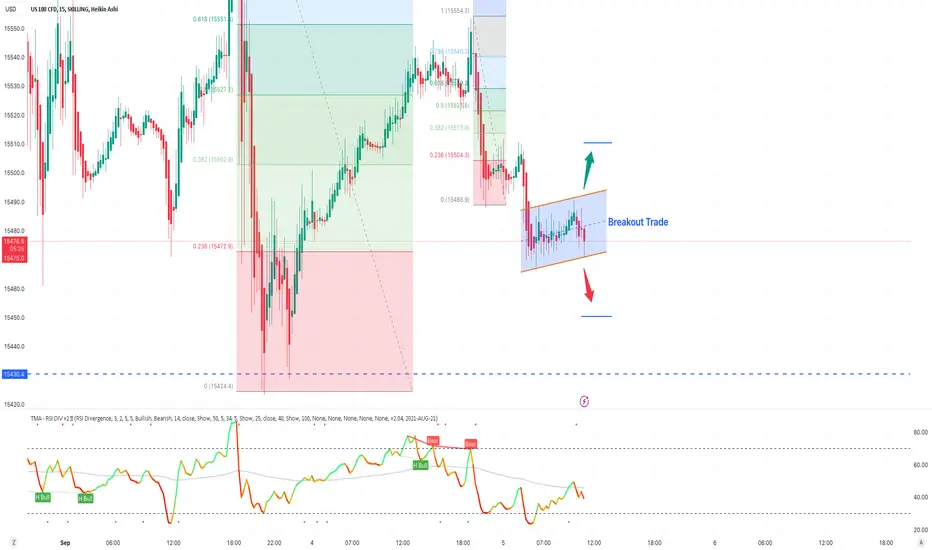
NASDAQ Parallel Channel Breakout TradeNASDAQ wait for breakout and trade in the direction of breakout or place your but and sell stop.
Manage your risk according to account size!
05092023 - #NDXSimilar to SPX, near term price action is looking toppish with at least a possible pullback IMO. Price is at a support level now; looking for a possible up to the PZ which would provide a good level to look for shorts for a move lower with 15345/83 as near term target; 15345 would be good for a good bounce.

$NDX - Rising Trend Channel [MID-TERM]🔹Breakdown support of Rising Trend Channel in the medium long term.
🔹This indicates a slower rising rate at first, or the start of a more horizontal formation.
🔹Approaching resistance at 15800, which may give a NEGATIVE reaction.
🔹Once break upwards through 15800 will be a POSITIVE signal.
🔹Technically NEUTRAL for the medium long term.
Chart Pattern:
◦ DT: Double Top | BEARISH | 🔴
◦ DB: Double Bottom | BULLISH | 🟢
◦ HNS: Head & Shoulder | BEARISH | 🔴
◦ REC: Rectangle | 🔵
◦ iHNS: inverse head & Shoulder | BULLISH | 🟢
Verify it first and believe later.
WavePoint ❤️

$DJI - Rising Trend Channel [MID-TERM]🔹Achieved target price at 35137 after a breakout of the Rectangle Formation.
🔹Support at 34200 and Resistance at 35600.
🔹Technically POSITIVE for the medium long term.
Chart Pattern:
◦ DT: Double Top | BEARISH | 🔴
◦ DB: Double Bottom | BULLISH | 🟢
◦ HNS: Head & Shoulder | BEARISH | 🔴
◦ REC: Rectangle | 🔵
◦ iHNS: inverse head & Shoulder | BULLISH | 🟢
Verify it first and believe later.
WavePoint ❤️

The Slight Depression - Why NFP Numbers aren't tha NB* with TechWhy jobs added or lost won’t have a big effect on the tech stock markets in the future
Every month, I get asked about NFP (Non-Farm Payrolls).
This is a barometer that comes out on the 1stFriday of every month.
It tells us one thing.
Whether the number of jobs were added or lost in the US economy for the previous month (excluding farming jobs).
Well let’s take the NFP number coming out today (1 September 2023)
Prior was 187,000 and the Forecast is 170,000.
So already, they are guessing there’ll be 17,000 less jobs added this month compared to last month.
In the past I would say, anything less than 170K might be a cause of concern to the stock market and companies (especially in tech) as less people were assigned jobs.
But this month, I have a shift in mind and thoughts.
If NFP comes out worse than expected…
I don't necessarily think this will have a bad effect on the NASDAQ.
In fact, the Nasdaq is showing strong signs of upside to come in the next few months.
Between the Falling Wedge, the Price above 200MA, the price jumping from the prior uptrend - It looks like the NASDAQ wants to shoot up!
And companies like Nvidia, META, Alphabet, Microsoft, IBM and even Tesla, I believe, will do just fine cutting jobs and building their empires simultaneously.
And whether the NFP drops or rises, NASDAQ along with tech stocks will do just fine.
Now let's talk about something a little more solemn.
I have a wild thought of the day.
In the era of accelerated technological advancements and revolutionary influence of AI (Artificial Intelligence), there is a paradigm shift happening between the biologics and the non-biologics.
Sure tech companies will need a strong workforce, but I don’t think they need an excessive amount of employees like in the past.
In the AI era with new AI developments, deep and machine learning to optimise and maximise operations and profits…
I think we WILL undoubtedly see a major disruption in the employee force.
But here is where it gets scary…
Those who adapt, grow and evolve will make it.
Those who don't might, fall behind and into what I call.
The Slight Depression
This is where things are getting tough and more expensive.
· Salaries are staying the same while prices are going up.
· Groceries you have to think twice when buying cereals.
· Flights are crazy.
· Rates and taxes are just ridiculous.
· Some restaurants are out of their minds.
· Don’t start with mortgages, bonds, insurance and medical aid.
· Filling up a tank of petrol is showing off nowadays!
Clearly, there is a shift between the lower and upper class.
Where I truly believe the middle class is falling away very quickly.
Soon it’ll be lower and upper class!
No in between and that scares me!
So…
The onus now lies YOU.
You really need to adapt, adopt and integrate to this rapidly evolving landscape.
Foe examples, if you possess the skills to work alongside AI, harness its potential, and contribute to its development, you’ll stand a chance in the job market.
If you continue to learn new tricks, no matter how old or young of a dog you are.
If you continue to upskill yourself.
If you invest in yourself (physically, mentally and financially).
You’ll have the upper hand.
What are your thoughts?
Do you think a lower NFP number is bad for tech stocks and an index like the NASDAQ?
Do you think The Slight Depression is among us?
Answer yes or no.

NASDAQ All going according plan, ATH by the end of the year.Today we make an update on our 1W time-frame Nasdaq (NDX) outlook on the analysis we published 2 weeks ago:
So far the price action is materializing our projection, as the index priced a bottom near the 1D MA100 (red trend-line) two weeks ago and is rebounding aggressively, in similar fashion as the September 2020 fractal. Similar 1W MACD Bearish Cross and more importantly similar 1W RSI rebound within same Rectangle levels.
If the pattern continues to be repeated, then a marginal breach of the 0.786 Fibonacci could deliver a new sharp pull-back to the 0.236 Fib. Weekly candle closings above it should keep investors interest intact and resume the uptrend, eventually to the 1.786 Fib extension and the 16770 All Time High. We are expecting this to take place towards the end of the year.
-------------------------------------------------------------------------------
** Please LIKE 👍, FOLLOW ✅, SHARE 🙌 and COMMENT ✍ if you enjoy this idea! Also share your ideas and charts in the comments section below! **
-------------------------------------------------------------------------------
💸💸💸💸💸💸
👇 👇 👇 👇 👇 👇

NASDAQ Forming Head and Shoulders ReversalNASDAQ Daily
*Note: This is an update to our previous analysis that will be linked below
Price Chart
The NDX is currently trading within an upward channel (Yellow Solids), and has recently tested the bottom trend line a fourth time; the more price retests it the weaker it becomes. This has also formed what could be the neckline (Teal / Red Solid) to a head and shoulders setup and has pushed the price past the mid-point (Teal Dotted) of the double top; which would also be the head. EMA's on the other hand have failed to cross lower with the 12-day and 26-day recrossing higher. Also notable is the spike in selling pressure on July 21; which is the same area the NDX is currently trading.
Relative Strength Indicator
There is a divergence (Teal Solid) from the price which lead to the trend line (Yellow Solid) breaking and the RSI dipping below the 50 level. The RSI has since recovered, however it's re approaching the trend line for a retest.
On Balance Volume
Similarly to the RSI, the OBV has also shown a divergence from the price and moved lower past the mid-point (Teal Dotted) in the double top. After a bounce at the support (Red Solid) the indicator is moving higher to retest the mid-point.
TLDR;
The market is showing strength, but a head and shoulders pattern is possibly forming as outlined above. RSI and OBV are both signaling higher, however, the indicators are nearing a trend line retest and level of resistance respectively. If price action moves past the head then we have an invalidation, but look for lower buying volume in the beginning of September to signal the formation of the shoulder.
What Seems Legit?
Um, not our portfolio if Mr. Market keeps running away from our targets; the market has been on a tear since the reversal in Dec / Jan. I mean, how many times have you heard those Bloomberg boys on the radio be like "omg markut go zhoom moar! wuuuuut?!", then the analyst comes on and is like "OH YEA NO U GOTTA DEPLOY CASH HERE I MEAN U CANT SIT ON THE SIDELINES LIKE WE CALLED THE BOTTOM AND NAO U GOTTA BAI". Layin' it on a little thick, text book transfer of wealth. Let's see if we get that head and shoulders.
Follow us on Twitter for memes, market moves, and not so headline news.
Chart Key
Yellow Solid = Major Trend Line / Channel
Red Solid = Support / Resistance
Teal / Red Solid = H&S Neck Line
Aqua Solid = Divergences
Teal Dotted = Midpoint Resistance
White Dotted = Invalidation of H&S
Green Boxes = Supports / Target Areas

SPY WEEKLY|28th-1st Sep,2023This is my analysis for SPY and be careful and trade as per your risk tolerance.
NOTE: MARKET SHOULD GO DOWN

NQ Futures Weekly Plan08/28 Weekly Plan. NQ Futures September
Weekly Pivot is 14,954
Targets
15,186
15,341 [5 days balance top)
15,490
Targets
14,830
14,700
14,461
Now trading at 14,980

SPX monthly double top?Monthly. SPX (candles) and NDX (line). 🤔
Of course not every double top ends in tragedy...but this looks textbook. Does anyone have knowledge of previous double top calls and what other indicators to watch?

NASDAQ Rebounding exactly at the bottom of the 8month Channel UpNasdaq (NDX) made a Higher Low last Friday exactly at the bottom of the Channel Up pattern that started at the beginning of the year, and broke (as well as closed) yesterday above the 1D MA50 (blue trend-line). The strongest buy confirmation has just emerged today as the 1D MACD forms a Bullish Cross, the first such pattern at such low level since January 08 2023.
As long as the 1D MA100 (green trend-line) stays intact (has been unbroken since January 20), we are targeting 16295 (the 1.236 Fibonacci extension as with the March 31 High). In the unlikely event that a 1D candle closes below the 1D MA100, we will sell and target the 1D MA200 (orange trend-line) at 13600, where the index will turn into a huge long-term buy opportunity again.
-------------------------------------------------------------------------------
** Please LIKE 👍, FOLLOW ✅, SHARE 🙌 and COMMENT ✍ if you enjoy this idea! Also share your ideas and charts in the comments section below! **
-------------------------------------------------------------------------------
💸💸💸💸💸💸
👇 👇 👇 👇 👇 👇

NASDAQ/QQQ Took Support at Predicted Support AreaNASDAQ 100 ( CME_MINI:NQ1! ) took Support at the area suggested in my previous Idea Post (see attached). For further confirmation we will wait to see if it holds above the 50 day EMA on Daily Time Frame. It is currently above the 50 day EMA in the Pre-market session on Tuesday.
If the Confirmation is achieved today, then we will look for another rally up to the Resistance Area from where the pullback started. Possible catalyst for this rally could be NASDAQ:NVDA 's earning Tomorrow AH, or J. Powell's speech at the Jackson Hole Conference on the 25th.
It is important to note that the market is still top heavy and favorable Macro environment is necessary for an uptrend.

NASDAQ Heading Lower For Longer (1D)NASDAQ Daily
Price Chart
We have quite a bit going on here so, pitter patter lets get at 'er. First, we have our second fake out (Highlighted) on the major trend line (Yellow Solid) which is accompanied by less buying volume than the first. EMA's have not crossed yet however we have a solid close below the 50-day and a legit cross of the 12-day and 26-day indicating a change in direction. We're getting the bounce we thought we might (Teal Dotted), which was outlined in the Weekly analysis that will be linked below, and should max out at the top teal dotted line if it pushes past the EMAs; This will be dependent on Nvidia earnings since it's so heavily weighted on the Index. After it begins to come down the first target of support (Green Box) aligns with the 200-day EMA, so that's definitely in play and will most likely see a decent bounce from there.
Relative Strength Indicator
Most notable here is the bearish divergence (Aqua Solid) that played out in the previous months and lead to a break in the major trend line. This lead to a small retest and the beginning of a bounce on the line of support (Teal Dotted). From here we likely see a retest of the 50 level to accompany the bounce and a rejection to downside to confirm our analysis.
On Balance Volume
Similarly to the RSI there was also bearish divergence that played out from previous months that lead to change in the direction of the OBV. The major level of support, or midpoint of the double top, was broken and confirmed the change in direction; This lead to the major trend line on this indicator also snapping. Most recently we've seen the beginning of a bounce on a line of support, which will most likely lead to a retest of the major trend line before resuming it's downward movement. Our target here aligns with another major trend line (Faded Yellow Solid) and the target support (Green Box).
TLDR;
Bro u pittur pattured moar thn u gat @ hur. Yea, well, we're in the business of pittering and the pattering is good. Price action is showing weakness and we're beginning get a small bounce at the second fake out break out of the major trend line; NVDA earnings will determine the height of it. The 12-day / 26-day EMA's actually crossed this time and there's been a solid close below the 50-day. RSI and OBV both show bearish divergences that have played out and confirmed the change in direction; both indicators are also showing a bounce at outlined supports before downward momentum resumes. Current targets are the green boxes.
What Seems Legit?
We bounce from excitement into Nvidia earnings; This seems to big one of the largest earnings calls in awhile, so you know big brain bets have already been placed, no one is showing up fashionably late for this. Earnings come out and the market either goes nuts, or has lackluster performance (our guess) into Friday where our overlords seal the deal for lower price movement.
Chart Key
Yellow Solid = Major Trend Line
Red Solid = Major Support
Aqua Solid = Divergences
Teal Dotted = Support / Bounce Area
Red Box = Major Resistance
Green Boxes = Supports / Target Areas

NASDAQ Long 2 Possible Scenarios of the next 21 DaysWell a chart says more than 1000 words
Overall trend is bullish, but current predicted crrections(See my previouse Nasdaq trading ideas!) and Gap filling has been ocured successfully. Scenario 1: We keep arriving the bottom of the bear area future zone(red marked Time zone) Powell speaking in Jacksonville, but fundamentals are yellow green. If we break 14488, then it means the market will fill the last possible gap, below 13885, an we certanily will go to around 13200 area(Local area) So watch closely the support reaction.
At this area I expect very hard and bloody fight between the bears and the bulls, as the bullish trend has been started at 11890, and 12885-13200 is the first bullish acumulation zone.So the bulls will efend this area, with everything what it takes to survive. Volume is up, and e have a big ,,K,, sshifting of the MP in this area.
That means we have doubled POC(bullish). In senrio 2 we will see a big drop off the market below the last gap, but very quikly and fast agrressively attak of the bulls, that will reat a big V pattern:this is a good area to buy, uz the risk reward managemnet will be high enough to survive or protet the position.
After that we retrurn the green bullish zone whih I have alulated, an then re again:The red area is a natural defene of the bears, so we will expet that the bears will try to push down the market. It is logial. Any kind of speulation will be just ruining your strategy. And the we will fight higher.
This is normal range as we will enter September!
And this month is just jerk. So a sideway movement and lower volatility is expted, if higher volatility omes in, then I ill ertainly be long, to add my positions, whih I have built at 10490 already.
For daytraders and salpers:Trade in trend diretion as the probabilitiy of winners will be higher.
Good luck Traders!
