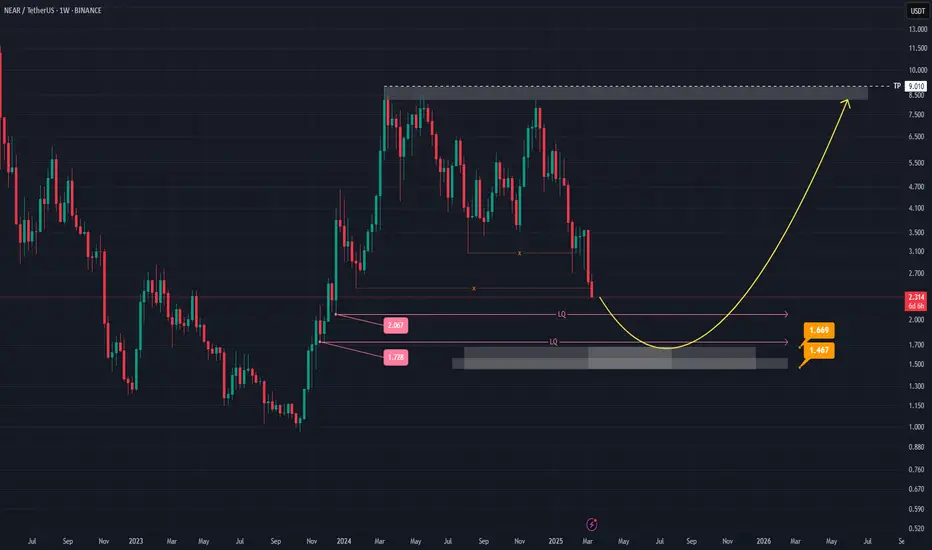
NEAR (NEARUSDT) Weekly Analysis: Potential Reversal in SightHey everyone! Let’s take a look at NEAR (NEARUSDT) on the weekly chart. There’s a chance the price might move into the 1.728–2.067 range, possibly sweeping up some liquidity before heading toward the 1.467–1.669 zone. This area seems like it could act as a launchpad for a potential bounce, aiming for higher targets afterward.
Watch for a spike in trading volume around that zone—if volume picks up, it could indicate stronger buying interest. Another key signal to look out for is a bullish candlestick pattern (like a hammer or a bullish engulfing), which might confirm a reversal if it appears near the 1.467–1.669 level.
Of course, if the price drops below 1.467, it might change this outlook and suggest a different path forward. Since the market can be unpredictable, it’s always important to keep an eye on these levels and stay prepared.
Above all, remember to do your own research and stay informed—this space can move fast, and it’s best to approach it with a curious mind. Keep learning, stay positive, and good luck out there! 📈
NEAR
NEAR/USDT BUYHello friends
Due to the price correction, we have identified important supports for you that are likely to reverse the price, and you can buy steps according to the two specified ranges.
We have also identified price targets for you.
*Trade safely with us*

NEAR Protocol Prepares For Long-Term Reversal (Bullish Breakout)NEAR Protocol (NEARUSDT) has been in a correction pattern since March 2024. It has been sideways within a wide range for an entire year.
The baseline, or long-term support, matches the 0.786 Fib. retracement level for the bullish wave that developed between late 2023 and early 2024. Current price action is happening above this level. Once resistance turned support.
The lowest price since January 2024 was hit just four days ago, 4-March. While this level was a more than a year long low, trading volume was very low. Even on the 2-Feb. drop bear volume was already dropping. Ever since the peak in March 2024, with each successive drop this pair produces, trading volume continues to drop. Revealing a weakening bearish trend.
A trend weakens when it is reaching its end.
But this isn't really a bearish trend but more like a long-term, wide consolidation pattern. It is classic pre bull-market action. There is a long-term lower high but the bottom is flat. When the next bullish wave develops, which is what will happen as the correction ends, the candles that we are seeing now will become almost invisible, same as if you were to look to the deep left side of the chart. Each time bull-market action develops, the preceding candles become really small. This is because bull-markets tend to produce growth that is out of proportion will all previous price action.
NEAR Protocol will hit new All-Time Highs. This is certain. It will be amazing and this amazingness is starting in a matter of days.
It will take months and months and months for the complete bullish cycle to reveal itself, but it will start within days. It tends to start low. Slowly but surely momentum grows, and as if it was never happening, the next moment we are here trading and exchanging, the entire market is experiencing growth.
We will be chatting and exchanging, having fun as our profits grow.
Thank you for reading.
Allow me to be your guide. It will be a tour that will not only change our lives but also the world.
Namaste.

NEAR - Bullish Movement Soon!NEAR has been overall bearish from both long-term and short-term perspectives, trading within the falling channel marked in red.
However, it is currently hovering around a support level, the lower trendline, and the key $3 round number, so we will be looking for longs on lower timeframes.
For the bulls to take over in the short term, a break above the last minor high at $3.025 is needed.
For the bulls to remain in control in the medium term, a break above the $3.65 major resistance is required.
Disclaimer:
This content is for informational purposes only and should not be considered financial or investment advice. Always do your own research and consult with a professional before making any investment decisions.

nearMy personal opinion is this: If it wants to lose this area, it can probably go as far as the support floor we identified. Inside the area, it's important not to lose these two blue lines.

Trading opportunity for NEARUSDTBased on technical factors there is a Buy position in :
📊 NEARUSDT
🔵 Buy Now
🪫Stop loss 3.000
🔋Target 4.000
📏 R/R 1,8
💸RISK : 1%
We hope it is profitable for you ❤️
Please support our activity with your likes👍 and comments📝

NEAR USDTNEAR remains strong on the high timeframe after a solid performance last year.
On the mid-time frame, it’s still consolidating within the wide $3-$8 range.
With liquidity now cleared below, all eyes are on this zone to see if a breakout is coming.


NEAR GETTING READY TO EXPLODEExpected wave C of micro (ii) to be completed and NEAR may soon explode!!!

NEAR IS READY TO MAKE A MOVE !!!Currently we got a Change Of Character on #NEARUSDT on 4hrly time frame, which indicates the sign of strength.
By this, we may see #NEAR tapping into it's support and then bullish move upto targets as mentioned in chart

NEAR: The Complex Case#NEAR has a complex chart, the rise since Oct 2023 doesn't appear motive in any realistic way.
As long as the price stays above $3.50 (the stop-loss), targeting $14.67 is expected, with $8.25 as a key confirmation level.
Breaking $3.50 invalidates this idea.
#NearProtocol

NEAR Price Outlook: Support, Resistance and Alt Season PotentialHello, Traders!
NEAR Protocol has been underperforming during this cycle, showing notable weakness compared to some other assets in the market.
However, it still holds potential for an upside move, especially if we witness a proper altcoin season.
Currently, NEAR is trading around a strong support area in the $4.50–$5.00 price range.
This area has historically been significant, and it seems unlikely that buyers will allow the price to break below it.
If an uptrend is to occur, it is most likely to begin from this area.
The $4.50–$4.80 zone presents an attractive accumulation range for mid-term investors, especially for those looking to position themselves ahead of any potential recovery.
However, for NEAR to convincingly shift into an uptrend, it must reclaim and sustain a position above the $6.00 resistance level.
If the price manages to break and hold above this threshold, we could see NEAR retesting its recent highs around the $8.00 level, with the possibility of pushing even higher depending on market conditions.
It's essential to note that NEAR overall remains weak.
Any significant upside movement would likely require BTC.D to drop below the 55% threshold, signaling a favorable environment for altcoins to rally.
Until then, NEAR is more likely to remain range-bound or continue its downtrend.
Please don’t forget to boost this idea and leave your comments below.

#near possible resistance test levelsBased on our evolutionary ai algorithm, near is getting ready to test resistance levels mentioned in the chart.
Let's see if it is proven right again ? @ScorehoodAI

NEAR Protocol BUY now.Hi fellow traders, NEARUSDT is ready to make a move higher after completing the complex correction in WXY formation. Target the 8.9221 level. Good luck and trade safe!

#NEAR/USDT Ready to go higher#NEAR
The price is moving in a descending channel on the 1-hour timeframe and sticking to it well
We have a bounce from the lower limit of the descending channel, this support is at 4.70
We have a downtrend on the RSI indicator that is about to break, which supports the rise
We have a trend to stabilize above the moving average 100
Entry price 4.90
First target 5.46
Second target 5.83
Third target 6.32

NEARUSDT Long Spot Position / Follow for the UpdatesBINANCE:NEARUSDT
COINBASE:NEARUSD
📊 Position: LONG
The bullish scenario remains active as long as the price consolidates above the yellow zone (triangle). Any long shadow below this zone is considered an opportunity to buy the dip until the price starts to rise.
🟡 Leverage: 1x
📍 Entry: Near $4.70 - 4.80$
🎯 Targets:
TP1: $5.75
TP2: $7.35
TP3: $9.25
TP3: $11.75
🔴 Stop Loss: $3.342 (-14.89%)

NEARUSDT: Golden Pocket Retest & Rebound SetupNEARUSDT is currently testing the golden pocket zone around $4.34 - $4.48 and forming a Descending Broadening Wedge , a bullish reversal pattern. If the price holds at this support level, there's a strong chance of a rebound, with potential targets around $10.80 to $15.20. However, if the support fails, the price could drop further to the $3.79 area. Keep an eye on price action and wait for a breakout confirmation to find a safer entry point!

Trade Setup: NEAR Long OpportunityMarket Context:
NEAR is retracing alongside the broader market, presenting a favorable opportunity for a long spot trade at a key support level. With AI being a strong narrative, NEAR is positioned for potential growth in this sector.
Trade Details:
Entry Zone: Around $4.2
Take Profit Targets:
$5.00
$5.50
Stop Loss: Below $4.00
This trade takes advantage of NEAR's retracement to enter at a critical support level with favorable upside potential. 📈

Near Protocol - 4h - Daily RangeNear Protocol - 4h - Daily Range
Near retesting the 4h suppor line after a HH , this is not bullish at all for now.
But also, no bearish until 4.8 suport line its broken.
Suport - 4.8
Resistance - 5.6 , 6.2
Neutral position

WE are "NEAR" to the GREEN and ReD lights!So We are officially in near game season 1 where same green light and red light is there like a traffic rule the only diff is theres a orange now. The green box is your target, red box is your point of tolerance. Rest
Ready Set, NEAR!

$NEAR Local overviewThe project is quite large in terms of capitalization and I would not expect rapid growth here. I would consider the project only for traders, it is already late enough for investors... The level of 1,414 is a magnet, further I would expect a correction.

NEAR can ascend further!The price has faced a volume shortage after breaking the ascending triangle, which is well indicated by the divergence and volume. Technically, in the first scenario, the price can drop to the support line of the triangle and then reach the 0.618 line, or it may fall below the support line of the triangle and reach the 0.382 Fibonacci line, causing traders to get liquidated as usual, and then price rise up.
Give me some energy !!
✨We spend hours finding potential opportunities and writing useful ideas, we would be happy if you support us.
Best regards CobraVanguard.💚
_ _ _ _ __ _ _ _ _ _ _ _ _ _ _ _ _ _ _ _ _ _ _ _ _ _ _ _ _ _ _ _
✅Thank you, and for more ideas, hit ❤️Like❤️ and 🌟Follow🌟!
⚠️Things can change...
The markets are always changing and even with all these signals, the market changes tend to be strong and fast!!

Alikze »» Near | Ascending channel - 1W🔍 Technical analysis: Ascending channel - 1W
📣 BINANCE:NEARUSDT currency is moving in an ascending channel on the weekly time frame.
🟢 After hitting the channel ceiling and the supply zone, it encountered selling pressure, which extended the correction to the middle of the channel. After that, it encountered demand again in the middle of the channel.
🟢 It is currently facing demand in the green box, which can grow to the channel ceiling in the first step and continue its growth again to the supply zone.
🟢 Considering that the supply zone and the channel ceiling have already been consumed, in case of high momentum, it will be able to break the supply zone
🟢 After that, it can grow to the next supply zone.
💎In the first step, then after breaking the ceiling of the first ascending channel, it can continue its growth to the middle of the second channel with a pullback to it and finally to the width of the first channel to a larger supply zone.
»»»«««»»»«««»»»«««
Please support this idea 💡 with a LIKE 👍 and COMMENT 💬 if you find it useful and Click "Follow" on our profile if you'd like these trade ideas delivered straight to your email 📧 in the future.
Thanks for your continued support.🙏
Best Regards,❤️
Alikze.
»»»«««»»»«««»»»«««
