$NIFTY: Nifty 50 – India’s Market Meltdown or Hidden Gem?(1/9)
Good Morning, folks! ☀️ NSE:NIFTY : Nifty 50 – India’s Market Meltdown or Hidden Gem?
Gift Nifty’s at 22,555, down 65 points, and the index is off 13% since October 2024! Is this a crash landing or a golden ticket in disguise? Let’s unpack the chaos! 🔍
(2/9) – PRICE PERFORMANCE 📊
• Gift Nifty: 22,555, down 65 points (Mar 6, 2025) 💰
• Recent Trend: 13% drop from Oct 2024 highs 📏
• Sector Mood: Autos, real estate dragging, per web reports 🌩️
It’s a bumpy ride, but bargains might be brewing! 🔧
(3/9) – MARKET POSITION 📈
• Index Weight: 50 top Indian firms, 65% of NSE market cap 🏅
• Scope: Spans 13 sectors, from banks to tech ⏳
• Trend: Bearish streak persists, down 13% since Oct 🎯
Still a heavyweight, but feeling the squeeze! 🌐
(4/9) – KEY DEVELOPMENTS 🔑
• Earnings Slowdown: Growth at 5%, down from 20%+ 🔄
• Macro Woes: U.S. tariffs, trade tensions spook investors 🌍
• Market Vibe: Gift Nifty signals a sour start 📋
Tough times, but sectors might shine through! 💡
(5/9) – RISKS IN FOCUS ⚡
• Geopolitics: U.S. tariff threats hit exports 🔍
• Sector Slump: Autos, real estate under pressure 📉
• Volatility: Bearish trend grips tight 🌪️
Rough waters ahead, but storms pass! 🛡️
(6/9) – SWOT: STRENGTHS 💪
• Diversity: 13 sectors, broad economic play 🏆
• Scale: Tracks India’s biggest players 📈
• Value: Potentially undervalued, per web buzz 🔩
A battered champ with fight left! 💼
(7/9) – SWOT: WEAKNESSES & OPPORTUNITIES ⚖️
• Weaknesses: 5% earnings growth, macro drag 📉
• Opportunities: Sector plays in banks, tech shine 📈
Can it dodge the punches and rally? 🤔
(8/9) – 📢Nifty at 22,555 (Gift), down 13%—your call? 🗳️
• Bullish: $24K soon, undervalued steal 🦬
• Neutral: Flatline, risks offset ⚖️
• Bearish: $20K next, bears rule 🐻
Vote below! 👇
(9/9) – FINAL TAKEAWAY 🎯
Nifty’s 13% slide and $116 Gift price signal trouble 📉, but undervalued sectors tease upside 🌱. Volatility’s our mate—dips are DCA fuel 🔥. Buy low, aim high! Hit or miss?
Nifty50

NIFTY: Impulse formationNifty has risen up in an impulsive manner from the bottom of 21964. Any correction is likely to hold above 22175 and extend the recovery towards 22800-23000 zone in the coming days and weeks ahead.

Good closing by Nifty, Now all eyes on tomorrow's weekly closingAnother fantastic day of recovery by Nifty which closed 207 points up today. From the lows of the day recovery was 310.6 from the lows of the day. Thus last 2 days have seen a significant up moves. The resistances now for Nifty remain at 22556, 22800 and 22981 before we reach the major resistance zone of 23139 to 23467.
This zone includes a Mother line, Father line and Trend line resistance. It will take some major good news or significant buying by FII to take us into Bull zone which awaits us above this zone. Supports for Nifty remain at 22240, 21954, 21782 and 21281. Below 21281 there can be a bear mayhem which can see Nifty slipping into recession mode. For now that zone is far away and shadow of the candle currently looks neutral to positive.
Disclaimer: The above information is provided for educational purpose, analysis and paper trading only. Please don't treat this as a buy or sell recommendation for the stock or index. The Techno-Funda analysis is based on data that is more than 3 months old. Supports and Resistances are determined by historic past peaks and Valley in the chart. Many other indicators and patterns like EMA, RSI, MACD, Volumes, Fibonacci, parallel channel etc. use historic data which is 3 months or older cyclical points. There is no guarantee they will work in future as markets are highly volatile and swings in prices are also due to macro and micro factors based on actions taken by the company as well as region and global events. Equity investment is subject to risks. I or my clients or family members might have positions in the stocks that we mention in our educational posts. We will not be responsible for any Profit or loss that may occur due to any financial decision taken based on any data provided in this message. Do consult your investment advisor before taking any financial decisions. Stop losses should be an important part of any investment in equity.

Nifty trying to stage a comeback but big resistances approachingNifty is in the process of staging a grand come back. Toda it closed with heft gain of 1.15% and 254 points. However there is an important trend line resistance including the supply zone between 22394 and 22455. If we get a closing above 22455 by the end of this week we can assume it will be a come back otherwise this bounce can be termed only as a technical bounce from the oversold zone. Once we get a closing above 22455 the next resistances will be at 22692 and 22981. Post this there will be Mother line, Major trend line and Father line resistance which can be seen in the chart at 23163, 23411 and finally 23477. It is a long way to go before we reach there. Bulls can claim a dominating position only after a closing above 23477. Supports for Nifty remain at 22183, 21954 and 21576 currently. All eyes on the closing we get this weekend. Positive or positive to flat closing required in the next 2 days for bull run to gather proper steam. Shadow of the candle currently looks neutral to positive.
Disclaimer: The above information is provided for educational purpose, analysis and paper trading only. Please don't treat this as a buy or sell recommendation for the stock or index. The Techno-Funda analysis is based on data that is more than 3 months old. Supports and Resistances are determined by historic past peaks and Valley in the chart. Many other indicators and patterns like EMA, RSI, MACD, Volumes, Fibonacci, parallel channel etc. use historic data which is 3 months or older cyclical points. There is no guarantee they will work in future as markets are highly volatile and swings in prices are also due to macro and micro factors based on actions taken by the company as well as region and global events. Equity investment is subject to risks. I or my clients or family members might have positions in the stocks that we mention in our educational posts. We will not be responsible for any Profit or loss that may occur due to any financial decision taken based on any data provided in this message. Do consult your investment advisor before taking any financial decisions. Stop losses should be an important part of any investment in equity.

levels to watch There are no exceptions and HCL is also part of the game. As corrections were expected, and the stock has the potential to create substantial wealth in the long run if approached with proper timing. Rather than focusing on short-term speculation, investors should shift their focus towards wealth creation by strategically building a well-rounded portfolio.
The levels mentioned here represent optimal entry points for gradually accumulating HCL shares, with the expectation that the markets will rally past previous highs in the coming months.
This approach hinges on the belief that, with patience and a long-term outlook, investors can benefit from the stock's potential upside as market conditions improve and HCL's performance strengthens.

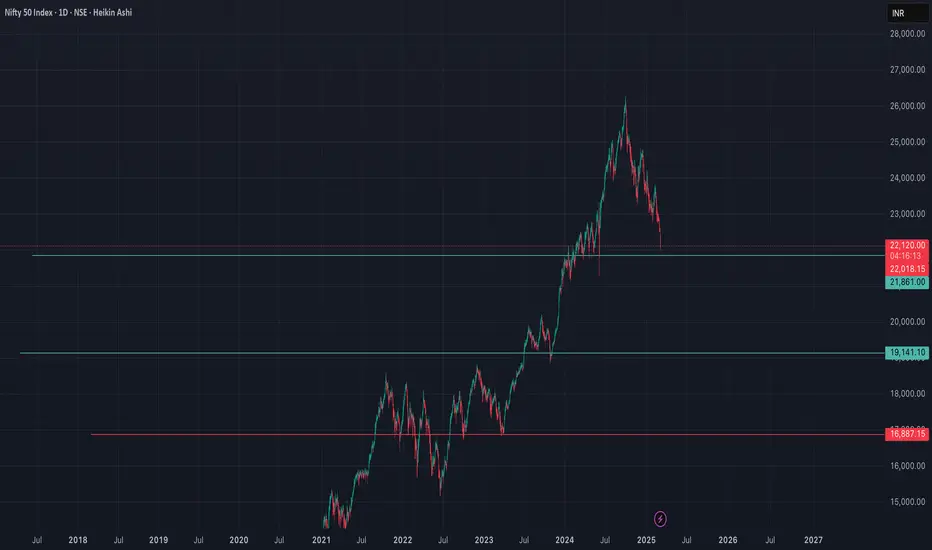
levels to watch out I’ve been bearish on the market since last year, constantly warning about an impending correction. While it seems we've moved past the initial anxiety phase, retail investors are still in denial. Many are clinging to losing positions, hoping for a rally to help them average out their losses. A small 100-200 point uptick might bring temporary relief, but the real panic session is yet to come.
When that moment arrives, it’s likely to trigger a bloodbath, with the market potentially correcting deeper than anticipated, possibly even dipping below the 19,000 mark. That level, in my view, would represent an ideal opportunity for long-term accumulation. Once that floor is reached and the market stabilizes, it could set the stage for a new bull run that breaks through previous highs.

Correction Done?? Some Green candles coming. Here is a quick update.
Watch out this graph. here are few points which is clearly highlighting some upcoming moves in Nifty.
1. Weekly MA 100 is on point to support.
2. as per volume traded, 22000 is strong support.
3. Yellow trend line showing weekly movement. giving hope for some recovery in upcoming days.
4. Please watch out for this high volume area. if it breaks. we fall down to 21600-21000.
Please always use stop loss and trade with your knowledge.

levels to watch I had anticipated a top and currently hold a short position on the index and most of the 50 stocks at 25,200. The market is now approaching the first target of 21,800. Expect a minor bounce in the short term, likely to trap retail investors. However, if the index closes below 21,800, the downward move is likely to accelerate, targeting 19,200.
Additionally, a deeper correction toward 16,900 remains a possibility and should not be ruled out at this stage.
#nifty50 Bhalu bhaiya maan jaao :)Nifty ended the week at 22,124, down 670 points from the previous week's close, with a high of 22,668 and a low of 22,104. As I highlighted last week, the formation of a gravestone doji was a bearish signal, indicating the market was under the influence of selling pressure—and we’ve now witnessed the impact of that pattern. Currently, Nifty is testing the critical support at the WEMA100 level, which could trigger a bounce. However, any rally should be seen as an opportunity to enter fresh short positions.
As mentioned last week, if Nifty closed below the 22,400 level on the monthly chart, we were likely to see further correction, and that’s exactly what transpired. While it may sound negative, I anticipate the index heading toward the 19,500 mark . For long-term investors, there’s no need for concern. This pullback could offer a prime opportunity to buy fundamentally strong stocks at attractive prices. Traders, on the other hand, should focus on a “sell on rise” strategy instead of attempting to pick a bottom and risking substantial losses.
Turning to the S&P 500, as I pointed out last week, the bearish M-pattern was in play. From the recent high of 6043, we’ve seen a 3.5% correction. On the weekly chart, the index has formed a long-legged candle, signaling that demand is emerging from lower levels. For the past four months, the S&P 500 has struggled to break through the significant resistance at 6000, failing to close above it on a monthly basis. A decisive monthly close above 6000 could open the door for the index to reach higher levels, potentially targeting 6225, 6376, 6454, and 6568.
In conclusion, the market remains under pressure, with Nifty at a key support level and the S&P 500 facing resistance. Investors should remain focused on long-term opportunities, while traders should be cautious and adopt a disciplined approach to navigating the current market volatility. Stay strategic, stay patient, and let the market unfold.

The next move for Nifty (2 trades for me)Nifty is undergoing a good correction. The retracement may go deeper if we fail to respect the Rejection block level.
There are 2 trades.
The first one will get triggered at the rejection block for a small pullback to gaps (imbalances).
The second trade is tentative and will depend on market reaction

Market Still Searching for Bottom. Nifty is still searching for a firm bottom from where it can form a base and launch a comeback. RSI of Nifty on Weekly chart is at 34.15. The weekly RSI was this low only during COVID fall when market RSI had gone below the level of 20. Most of the levels are being broken down week after week and day after day.
Now Nifty supports are at 22054 and 21813. 21813 seems to be a very strong support if this support is broken we have only 21281 support which was the Election day low where there was a fear of regime change. If 21281 is broken then 20507 and 19706 Father line of weekly Chart.
Daily RSI is at 22.4 which indicates Nifty might be near the oversold zone. Upside resistances for Nifty are at 22588, 22743. Crossing these 2 hurdles will bring in a formidable Fibonacci resistance of 23214 and 23334 (Mother line of Weekly chart) into picture. Bulls can make a come back only after we get a closing above 23334.
Amongst all these negative indications Nifty 50 PE valuations are at 19.7. The 10 year Average PE of Nifty 50 is at 23.5. Which means lot of stocks are trading below their 10 year Price to Earning average and value buyers can see an opportunity here for long term investment and they can start collecting fallen stars.
Daily Disclaimer: The above information is provided for educational purpose, analysis and paper trading only. Please don't treat this as a buy or sell recommendation for the stock or index. The Techno-Funda analysis is based on data that is more than 3 months old. Supports and Resistances are determined by historic past peaks and Valley in the chart. Many other indicators and patterns like EMA, RSI, MACD, Volumes, Fibonacci, parallel channel etc. use historic data which is 3 months or older cyclical points. There is no guarantee they will work in future as markets are highly volatile and swings in prices are also due to macro and micro factors based on actions taken by the company as well as region and global events. Equity investment is subject to risks. I or my clients or family members might have positions in the stocks that we mention in our educational posts. We will not be responsible for any Profit or loss that may occur due to any financial decision taken based on any data provided in this message. Do consult your investment advisor before taking any financial decisions. Stop losses should be an important part of any investment in equity.

Long Term Nifty Outlook Based on 2023 Fibonacci levels. Based on the Fibonacci levels plotted from the point from where rally started on 2023 towards the peak and reverse Fibonacci from the same 2 points. We can make the following deduction:
Major Supports for Nifty can be around: 22500, 22169, 21845. Negative scenario as of now seems to be near 21227, 20507, Father line support of Weekly chart 19710. Worst case scenario 19170 or 18769. (Possible but improbable) But you never say never.
Major Resistances for Nifty will be at: 23214 Fibonacci level resistance, 23351 Weekly Mother line resistance, 24921 and then previous peak at 26277. Best case scenario for Nifty to make a come back with a bang and show us a new high near 28000+ levels (Possible but improbable) But your never say never.
Disclaimer: The above information is provided for educational purpose, analysis and paper trading only. Please don't treat this as a buy or sell recommendation for the stock or index. The Techno-Funda analysis is based on data that is more than 3 months old. Supports and Resistances are determined by historic past peaks and Valley in the chart. Many other indicators and patterns like EMA, RSI, MACD, Volumes, Fibonacci, parallel channel etc. use historic data which is 3 months or older cyclical points. There is no guarantee they will work in future as markets are highly volatile and swings in prices are also due to macro and micro factors based on actions taken by the company as well as region and global events. Equity investment is subject to risks. I or my clients or family members might have positions in the stocks that we mention in our educational posts. We will not be responsible for any Profit or loss that may occur due to any financial decision taken based on any data provided in this message. Do consult your investment advisor before taking any financial decisions. Stop losses should be an important part of any investment in equity.

Nifty 50 Elliott Wave Analysis: Potential Retracement LevelsNifty 50 Elliott Wave Analysis: Potential Retracement Levels
The wave count for Nifty 50 has been structured from the Covid-19 lows of 23rd March 2020. Since then, the index has undergone a well-defined Elliott Wave progression, forming distinct impulsive and corrective waves. Below is a breakdown of the wave structure and the potential retracement targets.
Wave Count Breakdown:
1. Intermediate Wave (1):
o Completed in October 2021 with a high of 18,604.45.
2. Corrective Wave (WXY) - Intermediate Wave (2):
o A corrective retracement followed, unfolding in a WXY pattern.
o The correction concluded on 13th June 2022, with a low of 15,183.40.
o The retracement was less than 38%, indicating a strong bullish phase.
3. Intermediate Wave (3):
o Nifty commenced its third wave, subdividing into a five-wave structure of a minor degree.
o This bullish wave extended significantly and peaked on 23rd September 2024, with a high of 26,277.35.
Retracement Expectations:
• Wave (3) exhibited an extended Wave 3, and according to the Elliott Wave principle, when Wave 3 is extended within a subordinate wave structure, a retracement typically occurs towards:
o The bottom of subordinate Wave 4 or
o 38.2% Fibonacci retracement level
• Key levels to watch for potential retracement:
o 38.2% Fibonacci retracement: 22,039.45
o Wave 4 bottom (4th June lows): 21,281.45
If the retracement aligns with Elliott Wave rules, we may see a pullback toward these levels before the next bullish wave resumes.
Pls follow for such insightful ideas.
Disclaimer :
This analysis is for educational and informational purposes only and should not be considered as financial or investment advice. Market movements are subject to various factors, and past patterns do not guarantee future performance. Please consult with a certified financial advisor before making any investment decisions.
________________________________________
With these insights, traders and investors can monitor Nifty 50's price action closely to determine whether the expected retracement unfolds as anticipated.

22500 & 22380 Are Good Levels For NIFTY Reversal50% and 61.8% of Y should be good levels for Z (of larger W) to complete and NSE:NIFTY to reverse towards 24K in larger X. Watch out of these levels.

H&S breakdown in GRASIMNSE:GRASIM hourly chart shows head and shoulder breakdown in hourly chart. Most H&S breakdowns are followed by retest so chances are there would be an attempt to reclaim the neckline resistance.

Accumulation Zone Activated in Nifty 50As we discussed before 1 month
Nifty react as well as my Analysis
🔍 Nifty 50 Analysis – Here’s a detailed breakdown of the chart and its implications:
⚔️Key Observations
📌 1. Accumulation Zone (22,625 - 22,821) ✅
🔹 This zone is a "best price range for long-term investment."
🔹 Historically, accumulation zones indicate a potential demand area where institutional buyers may step in.
🔹 If the index holds this level, we could see an upward movement 📈.
📌 2. Strong Resistance Zone (23,050 - 23,178) ❌
🔹 The chart suggests this area is a potential reversal point.
🔹 If Nifty reaches this level, profit booking or selling pressure may emerge.
🔹 A breakout above this zone could signal further bullish momentum 🚀.
📌 3. Projected Price Action (Wave Structure) 🔄
🔹 The pattern (A → D → F) suggests a possible bounce from accumulation to resistance.
🔹 If resistance is broken, Nifty could rally further.
📊 Trading Strategy
✅ Bullish View:
🔹 If Nifty holds above 22,625, it could move toward 23,050 - 23,178.
🔹 A breakout above 23,178 may signal a continued uptrend 🚀.
❌ Bearish View:
🔹 A breakdown below 22,625 could lead to further declines 📉.
🔹 If this happens, new support levels need to be identified.
⚠ Disclaimer: I am not a SEBI-registered analyst. Stock markets are subject to market risks. Please do your own research before investing. 📢📊

Nifty Market Update: Bears Are in Control – A Rough Ride Ahead?The Nifty closed at 22,795 this week, down by 134 points from the previous week’s close, with a high of 23,049 and a low of 22,720. The formation of a Gravestone Doji candle indicates that the market is firmly under the control of the bears, signaling potential weakness ahead. As forecasted last week, Nifty moved within the range of 23,450 to 22,400, aligning perfectly with my predictions.
Looking ahead to next week, I expect Nifty to trade between the 23,300 to 22,250 range. While 22,300-22,400 offers a strong support zone, if the index slips below 22,250, it could test the WEMA100 at 22,050, which could offer some relief.
Digging deeper, I analyzed the Nifty50 monthly chart from 2004 onwards and noticed a recurring pattern: whenever Nifty closes below the monthly EMA21, it tends to test the EMA50, which currently stands at 19,450. If this month’s close is below 22,400, we could be heading toward 19,450, so brace yourselves for what could be a bumpy ride ahead.
On the international front, the S&P 500 is showing signs of forming a bearish M-pattern, a negative signal for the broader market. This is troubling news for Indian markets, which are already under pressure. From the current level of 6,013, a 1.5% correction could see the index testing support levels around 5,900.
The battle between bears and bulls continues, but for now, I believe the bears still have the upper hand. Stay cautious and keep a close watch on market movements – volatility is here to stay!

Reverse Hammer in Nifty (confirmation pending) sign of reversal.A reverse hammer pattern is formed in Nifty in the weekly charts. Usually This kind of formation signals trend reversal. For reversal to be successful we need a closing next week above 23044. If this happens investors and traders can breathe a sigh of relief from the on going market correction.
If the reversal is not successful we might see Nifty fall further to 22427 or in the worst case scenario the next supports will be at 22132, 21718 or even 21302 as of now. On the positive side if the reversal is successful we may see Nifty rising to 23383, 23819, 24205 or close to 25K if we get a weekly or monthly close above 23044 level.
Another point which goes in favour of Nifty is that weekly RSI currently is at 39.39. Last time the weekly RSI was this low was in March 23 when it was 38.80. After this point we saw a rally in Nifty which lasted almost 18/19 months. So a further small dip post which we can see a come back in Nifty as per the Relative Strength Index.
Next week and the week after than will be critical for reversal of Nifty. Shadow of the candle neutral to positive this week. We might be near a temporary bottom (confirmation pending).
Disclaimer: The above information is provided for educational purpose, analysis and paper trading only. Please don't treat this as a buy or sell recommendation for the stock or index. The Techno-Funda analysis is based on data that is more than 3 months old. Supports and Resistances are determined by historic past peaks and Valley in the chart. Many other indicators and patterns like EMA, RSI, MACD, Volumes, Fibonacci, parallel channel etc. use historic data which is 3 months or older cyclical points. There is no guarantee they will work in future as markets are highly volatile and swings in prices are also due to macro and micro factors based on actions taken by the company as well as region and global events. Equity investment is subject to risks. I or my clients or family members might have positions in the stocks that we mention in our educational posts. We will not be responsible for any Profit or loss that may occur due to any financial decision taken based on any data provided in this message. Do consult your investment advisor before taking any financial decisions. Stop losses should be an important part of any investment in equity.

Mother Line again resisting and Trendline supporting. Something got to give now in a big way as Mother line 50 Hours EMA of 1 hour chart is resisting the up move and trend line formed from the base of recent low is providing support to the Nifty. Few things can happen here which everyone can observe for Educational purpose:
1) If Trend line is broken Nifty will again try to seek support at 3 month or more cyclical points of 22802 or 22722. If 22722 is broken Nifty may find itself again searching for Bottom which can be temporarily near 22451.
2) Second thing that can happen is Nifty can just like last 2 days stay range bound and trapped between trend line supports and resistance in the range of 22722 to 23022 (Mother line of 50 hours EMA).
3) We might get a break out if we get a closing above 23022 (Mother line). In such a scenario the next resistance levels based on cyclical 3 month or older data seem to be near 23108, 23200 or 23283 (200 Hours EMA or the Father line). If we get a closing above Father line 23283 the next resistances can be 23494 or 23804.
This is what short term outlook of Nifty looks like.
Disclaimer: The above information is provided for educational purpose, analysis and paper trading only. Please don't treat this as a buy or sell recommendation for the stock or index. The Techno-Funda analysis is based on data that is more than 3 months old. Supports and Resistances are determined by historic past peaks and Valley in the chart. Many other indicators and patterns like EMA, RSI, MACD, Volumes, Fibonacci, parallel channel etc. use historic data which is 3 months or older cyclical points. There is no guarantee they will work in future as markets are highly volatile and swings in prices are also due to macro and micro factors based on actions taken by the company as well as region and global events. Equity investment is subject to risks. I or my clients or family members might have positions in the stocks that we mention in our educational posts. We will not be responsible for any Profit or loss that may occur due to any financial decision taken based on any data provided in this message. Do consult your investment advisor before taking any financial decisions. Stop losses should be an important part of any investment in equity.

Nifty Analysis: Potential Final Low and Key Reversal ZonesNifty Analysis: Potential Final Low and Key Reversal Zones
Pattern & Wave Structure
=====================
1. The market appears to be in the late stages of a higher-degree Wave (4) correction in a classical A‑B‑C formation.
2. Based on current wave counts, the 17th February low could mark the completion of Wave C (and thus Wave (4)).
3. If the price undercuts that low again, the 25th Feb–6th March window stands out as another high‑probability reversal zone.
Price & Time Analysis
================
1. Fibonacci Retracements near the 23,400–22,550 region align with typical corrective targets (0.382 and 0.5 retracements).
2. Several cycle durations (High‑High, Low‑Low, etc.) also converge in the late Feb to early March window, suggesting that if the 17th Feb low fails, price is likely to pivot within this narrow time band.
Momentum Across Multiple Time Frames
==============================
1. Daily (8‑ & 13‑period Stoch RSI): Just triggered a bullish reversal signal, indicating a near‑term upside bias.
2. Weekly Stoch RSI: Currently in a bearish phase but could shift higher if price stabilizes or rallies from current levels.
3. Monthly Momentum: Deep in oversold territory, suggesting the market is nearing a major inflection point (downside risk appears more limited).
Overall Outlook
===========
With three time frames hinting that bearish momentum is losing steam—and a clear confluence of Fibonacci targets and time cycles—downside appears limited if not already exhausted.
A decisive push above recent swing highs would strengthen the case that the 17th Feb low was a significant bottom.
Conversely, a brief extension lower into late Feb–early March could still offer a strong rebound if support is confirmed in that zone.
Conclusion
=========
The interplay of price levels, time cycles, and momentum indicators points to a potential final leg of the correction nearing completion. If 17th Feb was not the turning point, then the upcoming 25th Feb–6th March window may serve as an important inflection date for Nifty. Keep an eye on key Fibonacci support zones and the evolving Stoch RSI signals for confirmation of a sustained upside move.

Nifty stopped by Trendline and Mid-Channel Resistance. Nifty again today was stopped by the trendline and mid channel resistance inside the falling channel. A closing above mid-channel around 22967 will enable some strength to Nifty. However closing above the Mid-Channel will not be enough as there are 50 hours resistance line or the Mother line of hourly chart nearby as well. This Mother line is at 23043. The next resistance if we get a closing above 23043 will be near 23200. After this hurdle is crossed the next hurdle is near 23307. 23307 is the Father line of hourly chart. Post crossing this area the channel top will be near 23494. Supports for Nifty right now are at 22802, 22745. If 22745 is broken channel bottom support is near 22451 and post that trend bottom support near 22114. The closing was negative today but shadow of the candle is neutral to positive. Which can be considered a possible sign of reversal. However it is to early to call it a clear reversal until we get a closing above 23494.
Disclaimer: The above information is provided for educational purpose, analysis and paper trading only. Please don't treat this as a buy or sell recommendation for the stock or index. The Techno-Funda analysis is based on data that is more than 3 months old. Supports and Resistances are determined by historic past peaks and Valley in the chart. Many other indicators and patterns like EMA, RSI, MACD, Volumes, Fibonacci, parallel channel etc. use historic data which is 3 months or older cyclical points. There is no guarantee they will work in future as markets are highly volatile and swings in prices are also due to macro and micro factors based on actions taken by the company as well as region and global events. Equity investment is subject to risks. I or my clients or family members might have positions in the stocks that we mention in our educational posts. We will not be responsible for any Profit or loss that may occur due to any financial decision taken based on any data provided in this message. Do consult your investment advisor before taking any financial decisions. Stop losses should be an important part of any investment in equity.

Maruti : Make or Break?Technical view
Box trading strategy in which you identify or stop consolidating for a couple of days and trading the direction of the breakout in this case Maruti Suzuki india limited is consolidating for past 3 days.
What is the strategy why does this work?
When a stock price moves sideways, it usually happens for two main reasons: either people are losing interest in the stock, or there's a lot of activity but the number of buyers and sellers is balanced.
Now, imagine a group of traders who are watching this stock. They have set their stop-loss orders close to where they bought the stock. This means if the price moves too far against them, they'll automatically sell to limit their losses.
When the stock finally breaks out of this sideways pattern, something interesting happens. New buyers or sellers jump in, excited about the movement. At the same time, those traders who were holding onto their positions start to sell because their stop-loss orders are triggered.
This combination of new traders entering the market and existing traders exiting their positions creates a surge in momentum in the direction of the breakout. So, if the price breaks upward, it can rise quickly as both new buyers come in and former holders sell out, pushing the price even higher.
Pro Tip
Entry at 15m tf Strong Candle Close (Outside the Box)
StopLoss is at Entry Candle high or Low (Not more than (0.8%)
Targets :- 12,887.50 (Upside) 12,411.25 (Downside)
Fundamental View
Profit: Maruti Suzuki India Ltd reported a consolidated net profit of ₹3,727 crore for Q3 FY25, a 16% YOY increase. However, another source indicates a standalone net profit of ₹3,525 crore, up 13% YOY, but below market expectations of ₹3,624 crore.
Revenue: The company reported revenue of ₹38,764 crore, a 16% YOY increase.
Sales Volume: Total sales were 566,213 units, up 13% from last year3. Domestic sales were 466,993 units (up 8.7%), and exports were 99,220 units, a significant increase of 38.2%.
EBITDA: Operating profit (EBITDA) increased by 14.4% YOY.
Not an Investment Advise

Great 234 point comeback by Nifty from lows of the day. Nifty made a great comeback of 234 points from lows of the day that is 22725 to close at 22959. The momentum has to carry forward tomorrow in order for any rally to sustain. Only when we get a closing above Mother and Father line Bulls can take a sigh of relief. Mother line and Father line are at 23530 and 23587 respectively. Before we reach there there are cyclical resistances 3 months or older at 22984, 23229 and 23435. Supports for Nifty will be at 22725, 22438 and 22159. If we get a weekly closing below 22159 the next supports will be at 21810 and 21302 only. So despite a good closing we are not out of danger zone as of now. Shadow of the candle is neutral as of now.
Disclaimer: The above information is provided for educational purpose, analysis and paper trading only. Please don't treat this as a buy or sell recommendation for the stock or index. The Techno-Funda analysis is based on data that is more than 3 months old. Supports and Resistances are determined by historic past peaks and Valley in the chart. Many other indicators and patterns like EMA, RSI, MACD, Volumes, Fibonacci, parallel channel etc. use historic data which is 3 months or older cyclical points. There is no guarantee they will work in future as markets are highly volatile and swings in prices are also due to macro and micro factors based on actions taken by the company as well as region and global events. Equity investment is subject to risks. I or my clients or family members might have positions in the stocks that we mention in our educational posts. We will not be responsible for any Profit or loss that may occur due to any financial decision taken based on any data provided in this message. Do consult your investment advisor before taking any financial decisions. Stop losses should be an important part of any investment in equity.
