LongThe intrinsic value of Reliance Industries is currently estimated at ₹2,481, while the stock is trading significantly lower at ₹1,250. This presents a compelling opportunity for long-term investors, I am long at ₹1,220.
Given the strong market capitalization of Reliance and its impressive track record of growth and performance over the years, these current levels appear to be an attractive entry point. As the company continues to expand its footprint in sectors like telecommunications, energy, retail, and digital services, the stock is poised for substantial long-term appreciation.
For investors looking to build or add to their positions, the current price levels offer a promising opportunity to accumulate shares at a discount to its intrinsic value, with a potential upside towards ₹2,481 in the medium to long term.
Nifty50

longThe outlook for this automotive giant looks extremely promising, especially with the future of the electric vehicle (EV) market in the next 5 years. As EV adoption continues to accelerate globally, this company is well-positioned to capitalize on the growing demand for sustainable transportation solutions.
I am currently long at 750 and have a plan to add more to my position if the market pulls back from its current levels. Should we see a dip, I believe it presents a valuable opportunity to accumulate more shares at favorable prices.
With the increasing shift toward electric vehicles, the company’s strong market presence and technological advancements should drive substantial growth. Holding for new highs over the next several months and years seems a solid strategy, as the long-term potential remains strong in an evolving, green-focused automotive landscape.

longThe market has recently bounced from the 50% retracement level, presenting a great opportunity for investors to enter long positions. This pullback has created an attractive entry point for those looking to position themselves for future gains. I am currently long at 2,700, with a positive outlook for the coming months and years.
If the market experiences any further drops from the current levels, the 2,400 range also provides a solid entry opportunity. This level could act as strong support, offering an ideal spot to accumulate more positions at favorable prices.

longThe market has presented an excellent opportunity for investors to enter long positions, with strong potential for growth over the coming months and years. For those looking to build a long-term position, it’s important to hold and accumulate on dips as the market progresses.
I’m currently long at the 2,300 level, and the 1,880 area also looks promising for new entries. These levels offer solid risk-reward setups, so consider using them as key buy zones.

long Investors should monitor these key levels as potential entry points for long positions, especially if you're positioning for the next bull run. It’s crucial to time your buys carefully and maintain a balanced approach when building long positions. Start accumulating gradually as these levels offer a good risk-to-reward ratio, but be mindful of the market's volatility.
Personally, I’m long at 4,700 and looking for further opportunities to scale in as the market develops. Keep an eye on price action around these zones and consider dollar-cost averaging to manage risk effectively.

Parallel Channel hourly candles suggests Nifty is delicate zone.Parallel Channel of Nifty suggest that we are in delicate zone with shadow of the candle being positive. Nifty has thrice taken support on the channel bottom as you can see in the chart. A strong support zone for Nifty is seeing strong buying emerging near the channel bottom. This strong support zone is between 23509 and 23263.
The Three important resistances however are not allowing Nifty to grow further. These 3 resistance are:
1) Mother line resistance near 23775.
2) Father and trend line combine resistance near 24010.
3) Third important resistance for Nifty to conquer will be near 24288 which is the mid channel resistance.
When we will get a closing above 24288 the Bull can breath a little easy and try and push Nifty upwards towards 24510, 24779 or even above 25K.
The zone between 25033 and 25200 will again be a tough zone to conquer as the Nifty will again hit the top of the parallel channel.
Conclusion: All is good till we do not get a closing below 23K levels. Below 23K levels weekly closing Bears will have position to overpower the market and drag Nifty further down. For long term investors this is good opportunity to invest big go long and hold on.
Today ONGC, Reliance, ITC, Asian Paints, Dr Reddy, Wipro and TCS are the few large cap stocks which saw buying.
The laggards for Nifty today were Apollo Hospitals, Trent, Shriram Finance, Bajaj Auto, ultratech and few other Large cap stocks.
Disclaimer: The above information is provided for educational purpose, analysis and paper trading only. Please don't treat this as a buy or sell recommendation for the stock or index. We do not guarantee any success in highly volatile market or otherwise. Stock market investment is subject to market risks which include global and regional risks. I or my clients might have positions in the stocks that we mention in our posts. We will not be responsible for any Profit or loss that may occur due to any financial decision taken based on any data provided in this message. Do consult your investment advisor before taking any financial decisions. Stop losses should be an important part of any investment in equity.

Fibonacci Support & Resistances for Nifty (Medium term outlook).Important Fibonacci support for Nifty drawn on daily line chart of Nifty is at 23349. Below 23349 closing bears can have a field day and can create havoc but that looks less likely as of now. The closing today is 23207 which is just above 200 days EMA or the father line which is a good sign. Father line was at 23700. On the upside the Fibonacci resistance for Nifty seem to be at 23902, 24170 (Important Mother line Resistance) 24236, 24467, 24780 and finally Fibonacci Golden ratio from the current levels is at 25185. It will take some doing from the Bulls to close above this level. This presents the medium time frame outlook for the Nifty.
RSI indicator also seems to have taken an upward swing but mid level is yet to be crossed for that indicator.
MACD indicator suggests that Moving averages are fighting hard to converge and bring back some bullish momentum into the market to infuse some life into the Bull who are trying to come out of comma.
Disclaimer: The above information is provided for educational purpose, analysis and paper trading only. Please don't treat this as a buy or sell recommendation for the stock. We do not guarantee any success in highly volatile market or otherwise. Stock market investment is subject to market risks which include global and regional risks. We will not be responsible for any Profit or loss that may occur due to any financial decision taken based on any data provided in this message.

Nifty 50 Index Futures is Sideways NowLongTerm Trend is Up
Short Term Price Action is Sideways.
Will post a long Term View and Short Term view in this Thread

Support, Resistance and Bollinger Band suggest limited downside.I have just drawn Supports, Resistance, Mother, Father lines and added Bollinger band to Nifty chart. The indication is limited downside for now in Nifty unless the Chinese Virus is overplayed in the market by the bears and other forces. My discussion with medical fraternity and other knowledgeable people suggest that the threat of HPMV is overplayed and mortality rates might not be as high as COVID in the recent virus outbreak. This is the information I have however I advise utmost caution would wish you to verify the information with friends in the medical field in your knowhow. Currently Bollinger band is not suggesting a heavy downside. However things will be more clear by end of this week as the market plays out. Not more than 2 to 5% (max) down side is visible to me in the short term unless there is a global catastrophe of massive order. RSI has taken a turn hopefully soon it will embark towards bullishness.
Supports for Nifty Remains at: 23249, 23466, 23555. Below 23249 flood gates for further downside can open.
Resistances for Nifty: 23720, 23795, 23855 (Mother line or 50 Hours EMA), 23942 (Mid-Bollinger band level), 24061 (Father line or 200 Hours EMA), 24146, 24231 and finally 24326 (Bollinger band top).
Disclaimer: The above information is provided for educational purpose, analysis and paper trading only. Please don't treat this as a buy or sell recommendation for the stock. We do not guarantee any success in highly volatile market or otherwise. Stock market investment is subject to market risks which include global and regional risks. We will not be responsible for any Profit or loss that may occur due to any financial decision taken based on any data provided in this message.

5 waves down in NIFTY ...5 waves down in NSE:NIFTY so trend remains downward, though it seem to have started pullback of the down move. Unless we break today's low in morning tomorrow, chances are tomorrow we would see pullback on the upside.

Nifty50 Trendline Retest – What’s Next for Traders?The Nifty50 is at a decisive point, retesting a key breakout level. Here's my take on the key levels to watch and how traders can approach the market
Nifty50 Analysis - 5th January
What's Happening?
Nifty 50 is at a make-or-break point. It recently broke out of a downward trendline, which is usually a good sign for bulls, but now the index is retesting that breakout. How it reacts at these levels will set the tone for the next move.
Key Levels to Watch:
- Resistance Zones:
- 24,222
- 24,347
- 24,528
- Support Zones:
- 23,990
- 23,897
- 23,790
- 23,592
Possible Scenarios:
1. The Bullish Path:
If Nifty holds above 24,057 and shows strength, we could see a move to 24,222, and if the momentum is strong enough, it might even test 24,347 or 24,528.
2. The Bearish Path:
If the price drops below 23,897, things could get dicey, with the index likely heading toward 23,790 and 23,592.
How to Trade This?
- For the Bulls:
Look for sustained buying above 24,057 to go long. Targets: 24,222, 24,347. Stop loss: Below 23,897.
- For the Bears:
If the price slips below 23,897, you might want to short. Targets: 23,790, 23,592. Stop loss: Above 24,057.
Final Thoughts:
This is one of those moments where patience pays off. Let Nifty show its hand before jumping in. Watch those key levels closely, and always trade with a plan (and a stop loss!).
NSE:NIFTY
Let me know your thoughts on this setup! Do you think bulls will hold, or will bears take over?

#nifty50 What Lies Ahead for Nifty & S&p500, 6-10th Jan 2025The Nifty Index this week staged a rally, closing at 24,004, a 200-point surge from the previous week. This bullish move, driven by a classic "W" pattern as predicted, saw highs of 24,226 and lows of 23,460. However, profit-taking by large players triggered a decline, confining the index within my anticipated range of 24,300-23,400.
For the upcoming week, I expect a trading range of 24,500-23,400 . A breach below 23,400 could find support at the 23,200-23,300 zone. A weekly close below this level would be a significant bearish signal, potentially triggering further selling pressure towards the 22,250 level. Conversely, a sustained move above 24,770 would signal a resumption of the uptrend, though this scenario currently appears challenging.
The S&P 500 also exhibited resilience this week, closing at 5,942 despite breaching the crucial support of 5,850. This formed a long-legged candle, indicating strong demand at lower levels. To reignite its upward momentum, the S&P 500 needs to close consecutively above 6,093. This bullish confirmation could propel it towards 6,142, 6,225, and even 6,376, providing a much-needed boost to global markets

Mid-Channel Resistance on Hourly charts Stops Nifty. The parallel channel is a channel in which the stock or index travels for a particular period of time. The upper frame of the channel acts as a strong resistance and the lower frame of the index acts as a support. Mid channel works in a dual way. If the price or the index level is above the Mid-Channel it acts as support if the price or the index level is below the Mid-Channel the line acts as resistance. Also on the daily chart of Nifty the level of 24212 was a Mother line Resistance of 50 day's EMA. Nifty today made a high of 24196 and retreated from there so it can be safely said that these 2 levels 24212(Mother line) and 24226 (Mid Channel resistance see in the chart will be most important resistances moving forward into the next week and probably full month. There is also a news of HPMV Virus outbreak in China as Trump resumes Presidency. Quarterly Results have already started flowing in and good results are expected this time around unlike traditionally weak October quarter. Additionally we are near the budget and there are news trickling in about relief to the Middle Class. Which can spark a pre-budget rally. So the signals from international market, technical analysis and on the local front. Next week is very important with perspective of full month of January.
Nifty Supports Remain at: 23989, 23902 (50 Hours Mother Line), 23797, 23540 (channel bottom Support) and finally 23279. Below 23279 closing Nifty has potential to fall totally into the bear grip. This does not look likely unless there is a catastrophic global event.
Nifty Resistances Remain at: 24086 (200 Hours EMA or the Father line Resistance), 24226 (Mid Channel Resistance), 24348, 24556, 24779, 24919 and finally 25025 (Channel top resistance).

Blue or Red - Which Alternative Would Play Out in NIFTY50?I see two major possibilities in NSE:NIFTY from Elliott Wave perspective, marked in red and blue.
As per blue counts, B of ABC down was done at 24857.75 and we are in C down. The downmove in C so far was corrective W (internally WXYXZ, or triple zigzag) so the bounce this week should be X. X has already retraced more than 50%, though less than 61.8%, so there is a possibility this X is complete and wave Y down within larger wave C will unfold next week. Having said that, X may not be over and might do 61.8% or more so that leaves some more room on the upside followed by Y down.
On the other hand, as per red counts, we are still in wave B of ABC down. 61.8% of the A is around 25125 so B might make an attempt towards or beyond that level. Once that's done, C should unfold on the downside.
Bigger picture is that, C down is still pending (or already in progress as per blue count) in both scenarios. If we break the low of 23460 then blue wave counts would likely play out. But if we break this week's high of 23226.70 then either blue or red counts could be in play as per the upside levels mentioned in both cases.
Let's see on which side camel will sit ...

INDIAN MARKET PILLER NIFTY 50 ANALYSIS Here we analyzed Nifty50 in hourly and 15/30 minutes time frame.
23968-23900 IS A LAST SUPPORT ZONE IF NIFTY BREAKS THAT THIS TRADE WILL BE TERMINATED
PRO ABOUT THIS TRADE :-
We analyzed Nifty50 Sector on that base we traded Nifty50
Britannia, Axis Bank, Bpcl and few others on favor
CONS:-
Nifty50 Got rejection from weekly supply zone Today.

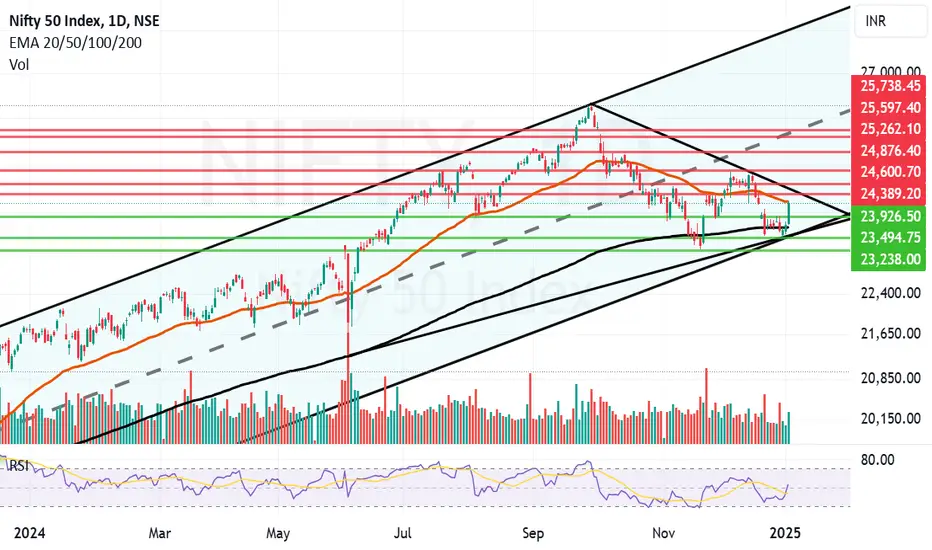
Nifty Stages Massive Comeback. But Will The Mother Line Relent? Nifty has staged a massive comeback today on the back of FII buying today. Nifty made a high of 24226 but Mother line Resistance (50 day's EMA at 24221) pushed it back a bit and it ended the day at 24188. If the mother line relents tomorrow and if we can get a weekly closing above 24221 tomorrow Bulls have potential to take the momentum forward into January with a possibility of Budget rally.
The supports for Nifty remain at 23926, 23698 (Father Line Support of 200 day's EMA), 23494 and finally 23238. Below 23238 all hell can break loose and bears will have potential to Pull Nifty further down.
Resistances on the upper side remain at 24221 (Mother Line Resistance of 50 day's EMA) followed by 24389, 24600 and 24876 before Nifty snatches back 25K levels.
Shadow of the candle remains neutral to positive but it can turn neutral or even negative if Mother line resistance comes into play again. The best possibility for Nifty remains if it can get a gap up opening above 24221. This can happen if we get good support from International indices and Gift Nifty tonight. Tomorrow's closing will be very important as it is the first weekly closing for the year.
Disclaimer:
The above information is provided for educational purpose, analysis and paper trading only. Please don't treat this as a buy or sell recommendation for the stock. We do not guarantee any success in highly volatile market or otherwise. Stock market investment is subject to market risks which include global and regional risks. We will not be responsible for any Profit or loss that may occur due to any financial decision taken based on any data provided in this message.
The Year that was and the year that can be. 2024/2025 story.Highlights of 2024:
a) Single digit return for Nifty in 2024. Nifty and Sensex rise 9% each.
b) Mid and Small Cap both rise 24% each.
c) Pharma and Real Estate both rise 40% each.
d) Trent, M&M and Bharti Airtel are the best performing Nifty stocks.
e) Asian Paints, Indusind Bank and Nestle are the worst performing Nifty stocks.
f) Dixon, BSE, OFSS and RVNL are the best performing Midcap stocks.
g) Vodafone Idea, AU SFB & Bandhan Bank are top Mid cap loosers.
Zones Where Nifty can form base and give closing in 2025.
Pessimistic Zone: In case of very negative year and some global catastrophe we can find Nifty forming a bottom between 19922 to 18476. *(Looks very unlikely as of now)*
Negative Zone: In case we have a negative closing for the year we may find Nifty closing the year between 21137 to 19922. *(Possible but we might get a bottom here and then the index might move upwards)*
Neutral Zone: The combination of Neutral to negative and neutral to Positive zone ranges from 26277 to 21137. Nifty can consolidate in this range. *(These are the lows and high of 2024).*
Positive Zone: We can see Nifty making a new high above 26277 and 27880. After which we can see a dip and further consolidation. *(A probable scenario)*
Optimistic Zone: In case we have a fantastic year we might see Nifty making a major peak between 27880 and 30060. *(This is a very optimistic scenario and less likely but you can never say never)*
Above assumptions of Nifty in 2025 are made based on Fibonacci Retracement applied from top to bottom and Bottom to top on the 2024 candle.
Disclaimer: The above information is provided for educational purpose, analysis and paper trading only. Please don't treat this as a buy or sell recommendation for the stock. We do not guarantee any success in highly volatile market or otherwise. Stock market investment is subject to market risks which include global and regional risks. We will not be responsible for any Profit or loss that may occur due to any financial decision taken based on any data provided in this message.

Nifty analysis for intraday 31/12/2024.Nifty has been trading in a range for the last 7 trading sessions.
Index is trading around the 20 EMA and giving sharp recovery on both sides.
Today it has closed below the moving averages. If the market starts trading below the No trading zone, bearish entry can be created for next support levels.
On the upper side the break out 23900 can clear the round number figure and test the Daily 20 EMA.
Wait for the price action near the levels before entering the trade.

Nifty after multiple efforts not able to close above 23900.Nifty again tried to climb up and made a high of 23915 however there was tremendous selling pressure at that level and not only it could not sustain 23900 but also it failed to sustain 23800 or even 23650 levs. Nifty closed at 23644 levels. This is a closing below the Father line (200 days EMA) which was at 23693. This closing is indicative of weakness. Shadow of the candle has turned negative as of now. There is a strong support at 23567. If this support is broken the door way towards 23273 or even 22800 will open up. Relative strength index is 37.40 and RSI support is at 30 and 27.54 levels. Incase of positive closing tomorrow which looks little difficult as of now the resistances will be at 23650, 23693 (Father Line), 23809, 23961 and finally 24159 and finally Mother line (50 Days EMA) Resistance at 24266.
So as of now it looks like we will have a modest close for the year. It has been an year for Nifty which Amplifies with 'what could have been'. Right now we are around 10% of the peak and at 9% yearly gains as compared to yearly closing. Hoping that law of averages catches up next year and we reach new highs next year and close the year robustly.
Disclaimer: The above information is provided for educational purpose, analysis and paper trading only. Please don't treat this as a buy or sell recommendation for the stock. We do not guarantee any success in highly volatile market or otherwise. Stock market investment is subject to market risks which include global and regional risks. We will not be responsible for any Profit or loss that may occur due to any financial decision taken based on any data provided in this message.

#Nifty50 Outlook for upcoming week 30-3rd Jan 2025The Nifty roared this week, gaining a solid 226 points, closing at a strong 23813! It reached a peak of 23938 before dipping to 23647. As predicted, the Nifty stayed within the 24100-23000 range, forming an interesting inside candle pattern. Excitingly, a bullish "W" pattern has emerged on the weekly chart!
If the Nifty can hold above the crucial 23900 level next week, we could see it trading between 24300 and 23400 . However, while a bounce is expected, the bearish Monthly chart might tempt big players to unload their positions. Stay alert!
Across the pond, the S&P500 took a 2.5% hit, closing at 5970 after reaching a high of 6049. The 5870-5850 support zone is critical. A breach could trigger a faster selloff, potentially testing the 5637/5551 support levels. For an upward move, the S&P500 needs to conquer 6050, paving the way for resistance levels at 6094/6142/6225.
Bottom line: Use any bounce next week as an opportunity to lock in profits. Stay informed and trade wisely!"
Wishing everyone a very happy & prosperous New Year.

Nifty on Weekly chart delicately placed. (Medium Term Outlook)Nifty is placed delicately on a weekly chart. Shadow of the candle is slightly positive but as the closing of the year looms large FIIs and the Bears might again try to sell on rise. On the positive side if FII will be on the buying side for the 2025 beginning and create fresh positive positions we might see a positive rally on the upside. The supports for Nifty remain at 23532, 23271 and 22724. 22724 is a very important support below which we might see a free fall which as of now can range till 21302 or even 20587. However there does not seem any trigger as of now which can bring Nifty to this levels but you never say never. On the positive side if there is a fresh buying trigger and a positive rally overall the resistances on the upper side seem to be near 23901, 24300, 24881 and finally 25409. 25409 is a strong resistance and closing above it will not only open the doors for touching the previous highs 26277 but also push Nifty towards making new highs.

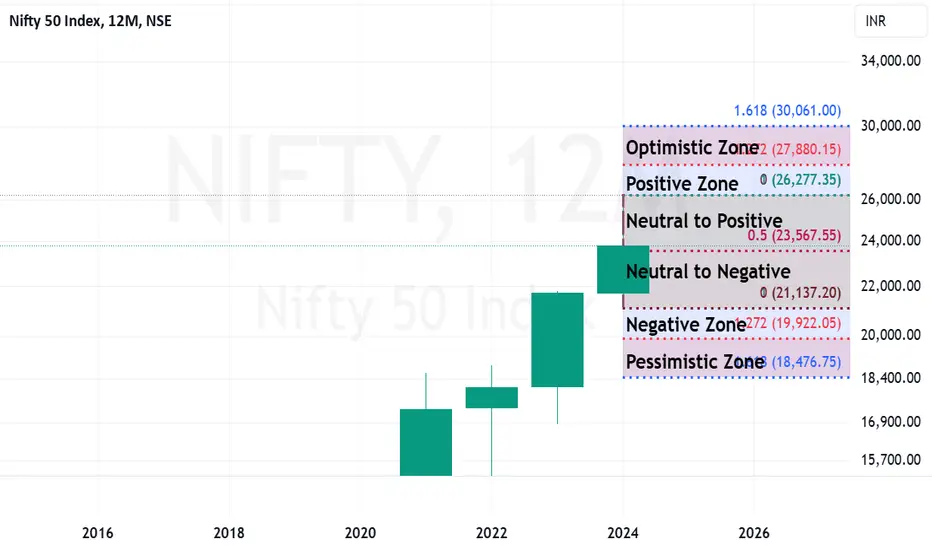
Fibonacci retracement on Yearly Candle gives us 2025 levels. We will continue out study of reading charts Today we will try to understand how to read the chart with the help of only 1 candle and Fibonacci series we will try to predict the range in which Nifty can move in the year 2025. First thing that one must understand that reading the charts is not a rocket science.
What we have done is very simple and anyone can do. The candle stick that we have take in a 12 Month Candle. That means, all movement of Nifty for the full year has been encompassed by a single candle. I have then applied Fibonacci retracement and reverse retracement. Which has given us various zones that determine levels of Nifty. In Case you do not know about Fibonacci Golden ration you may read about it in my previous articles about the subject in Smart Investment. Fibonacci series was seen in ancient Indian Sanskrit and Maths in the works of Pingala and Hemachandra few Thousand years ago. The series derives its name however from Italian mathematician who made it famous in the modern era.
Neutral Zone: The results that we got by applying Fibonacci and reverse Fibonacci on 12-month candle tell us that the neutral zone in case of sideways movement throughout the year would see Nifty moving between 21137 to 26277. Candles however seldom repeat on yearly scale but you never say never. These are the highs and lows of the current year.
Negative Zone: If something very negative happens in the budget or thereafter on local or global scale we might see Nifty pivot to this range or 21137 to 19922. Where it could find support and reembark its journey upwards.
Pessimistic Zone: In case of a catastrophe or some thing very negative on global or local / Macro or Micro economic front the range that we could see will be Nifty deteriorating towards 19922 to 18476. However, this looks unlikely as of now and even if it happens the upward journey might soon begin as PE investors might see a great value buying opportunity.
Positive Zone: If things fall in place and economic progress continues, there is no deterioration of GDP or inflation and if Rupee recovers swiftly the zone between 26277 pervious peak and 27880 is possible. We may see a new peak of Nifty in this range.
Optimistic Zone: In case the FII return enemas and economy continues to bloom with few elections and political stability / border stability and GDP growth continues it is quiet possible that we may see Nifty reaching new highs which will be in this range between 27880 and 30061. This seems a little distant dream as of now but you can never say never. At least if we hit the sweet spot of economy and Fibonacci golden ration even this ‘Everstsesque’ peak might be summited by Nifty.
Here we have given different hypothetical scenarios of Nifty based on Fibonacci and candlestick analytics. For indepth understanding of Techno-Funda investing you can read my book which is The Happy Candles Way to Wealth creation. This book is available on Amazon in paperback and Kindle version. The book contains valuable tips for you to maximise your profits from stock market and wealth creation. It also explains my much coveted Mother, Father and Small Child Theory.
Disclaimer: The above information is provided for educational purpose, analysis and paper trading only. Please don't treat this as a buy or sell recommendation for the stock. We do not guarantee any success in highly volatile market or otherwise. Stock market investment is subject to market risks which include global and regional risks. There is also chance of bias in our opinion. I, my family or my clients may have a long position in the stock. We will not be responsible for any Profit or loss that may occur due to any financial decision taken based on any data provided in this message.
Nifty IntradayPure technical levels...
if the early morning momentum continues during after noon session can test 24100 levels
currently forming a flag with lesser volume and also forming a base
Momentum has to be there for upside
