nifty forecast for 2nd Dec'2024Market may grab sell-side liquidity, create an inducement, target buy-side liquidity, and then turn bearish.
Niftytrading

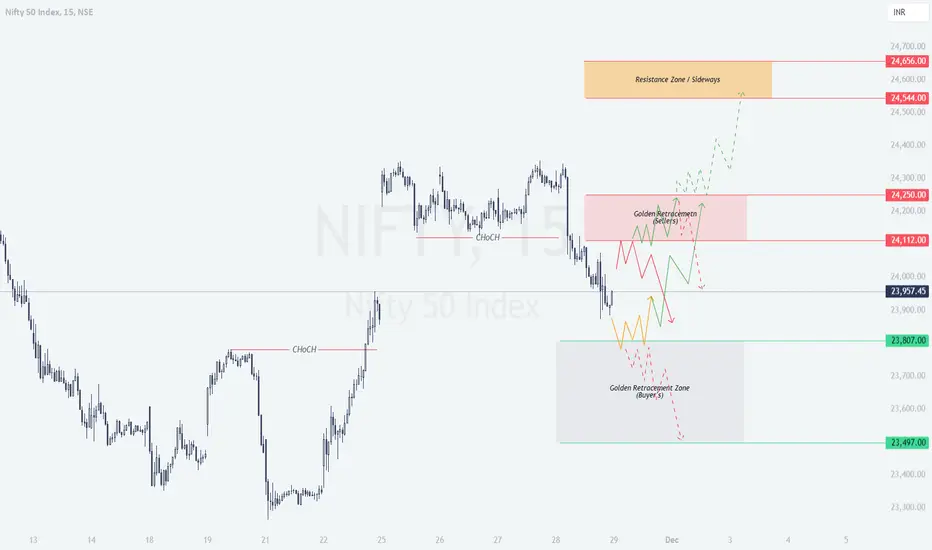
NIFTY : Analysis and Levels for 29-Nov-2024
On the previous trading day, Nifty exhibited a significant shift in momentum. A Change of Character (ChoCH) was observed, indicating a possible transition between bullish and bearish phases. The index traded near the golden retracement zones, showing both buyer and seller activity. The yellow trend represents a sideways market, green signals a bullish trend, and red indicates bearish sentiment.
After a consolidation, NIFTY has shown a significant trending move on last trading session, so most probably nifty can trade sideways or in a range on Friday, but based on the chart, I have prepared trading plans for three possible opening scenarios: Gap Up, Flat, and Gap Down openings.
Gap Up Opening (+100 points or more above ₹23,957)
Resistance Focus (₹24,112-₹24,250): If Nifty opens above ₹24,057, it will directly test the golden retracement zone for sellers. Watch for bearish patterns, such as shooting stars or evening stars, in this area. If selling pressure emerges, initiate a short position.
Action Plan:
Entry: Short below ₹24,200 after confirmation of rejection.
Target: ₹23,957 (the current close) and ₹23,807 (demand zone).
Stop Loss: Above ₹24,300 to manage risk.
Breakout Potential (₹24,250+): If Nifty breaks above ₹24,250 with strong volumes, it may head toward the Resistance Zone (₹24,544-₹24,656). Consider a long trade upon breakout confirmation.
Action Plan:
Entry: Long above ₹24,250 after a 15-minute candle close.
Target: ₹24,544 and ₹24,656.
Stop Loss: Below ₹24,100 to safeguard against false breakouts.
Flat Opening (Near ₹23,957)
Golden Retracement (₹24,112): If the market consolidates around ₹23,957, wait for a decisive move. The immediate focus will be the golden retracement zone at ₹24,112.
Action Plan:
Entry: Long above ₹24,112 if the price breaks this level with volume.
Target: ₹24,250 and ₹24,544.
Stop Loss: Below ₹23,900 to minimize risk.
Demand Zone (₹23,807): If Nifty fails to sustain above ₹23,957, it could test the Golden Retracement Zone for Buyers (₹23,807-₹23,497). Look for bullish reversal patterns in this zone for long entry.
Action Plan:
Entry: Long near ₹23,807 if bullish candles like hammers form.
Target: ₹23,957 and ₹24,112.
Stop Loss: Below ₹23,497 to protect against breakdowns.
Gap Down Opening (-100 points or more below ₹23,957)
Demand Zone Test (₹23,807-₹23,497): If Nifty gaps down and opens near or below ₹23,807, focus on the demand zone. This zone is critical for potential reversals.
Action Plan:
Entry: Long near ₹23,807-₹23,497 after confirming bullish patterns.
Target: ₹23,957 and ₹24,112.
Stop Loss: Below ₹23,497 to limit losses.
Breakdown Scenario (Below ₹23,497): A breakdown below ₹23,497 signals strong bearish momentum. Short positions can be taken if confirmed by volume and candle patterns.
Action Plan:
Entry: Short below ₹23,497 after confirmation.
Target: ₹23,300-₹23,100.
Stop Loss: Above ₹23,600 to avoid unnecessary risks.
Risk Management Tips for Options Trading
Limit your position size to ensure no single trade risks more than 2% of your capital.
Use hedging strategies, such as buying protective puts or selling covered calls, to offset potential losses.
Avoid trading during the first 15-30 minutes of market opening, as this period is highly volatile.
Monitor implied volatility (IV) for options and select contracts with reasonable premiums to avoid overpaying.
Summary and Conclusion
This trading plan is designed to cater to multiple scenarios, ensuring you're prepared regardless of the market's direction. The key lies in observing critical levels like ₹24,112 and ₹23,807 and waiting for confirmation before entering trades.
Remember: Yellow trends indicate sideways movement, green signals bullish momentum, and red shows bearish sentiment. Stick to the plan, respect stop losses, and prioritize capital preservation.
Disclaimer:
I am not a SEBI-registered analyst. This trading plan is for educational purposes only. Please consult with your financial advisor or conduct your analysis before making any trading decisions.
A Long View of NIFTYA Long View of NIFTY on daily timeframe basis, as per price action nifty form Head & Shoulder Pattern.
As per price action and trend analysis nifty begins downtrend, the next tgt are as follow:-
Tgt1- 23224
Tgt2- 21290
This is only for Education purpose only.

Nifty pre market opening levels Nifty pre market opening levels
Expecting a gap up open and slide down side for take entry on retracment area focus on your buy entry levels
Market is on up trend so dont get trapped at small retracment
Happy Trading 🥰


Nifty pre market opening levels Comment which stock to analysis and post next
Nifty pre market opening levels
Happy Trading 🥰

Nifty pre market opening levels Comment which stock , index to analysis and post next
Nifty pre market opening levels
Happy trading 🥰

Njfty comment buy or sell ?Comment which stock to analysis and post next
Also Comment nifty is buy or sell

NIFTY on the cusp for potential correction!Dear Traders,
I trust this message finds you well in both your trading endeavors and personal pursuits. I am pleased to present a compelling opportunity through a new NIFTY analysis that indicates an imminent significant market shift. The recent upward surge in the market has prompted concerns, as my analysis over the past two months has consistently pointed to an anticipated correction owing to market overvaluation and distinct completion patterns.
Technical details:
I. Resistance I: 25,388 ~ 25,430 (Extended trend line from 17th JUN'22)
II. Resistance II: 25,490 ~ 25,510 ~ 25,526 (Conj. Extended trend line from 24 JAN'24 & 24 JUN'24)
III. Resistance III: 25,590 (Extended trend line from 29 FEB'16 – Long & strong Resistance)
*** Please note that these values serve as indicative levels of support and resistance.
The wave patterns depicted in the diagram
signal the completion of the trend.
imgur.com
Additional observations:
Time series Forecasting:
Top - Top
- Today (04/09/2024) = 1690 D from 20jan'20 (1710 = 360*4 + 270)
= 1053 D from 19oct'21 (1080 = 360*3)
= 644 D from 01dec'22 (630 = 360+270)
= 356 D from 15sept'23 (~360)
Bottom – Top
- Today (04/09/24) = 1626 D from 24mar'20 (1620 = 4*360+180)
= 811 D from 17jun'22 (810 = 720 + 90)
= 315 D from 26oct'23 (exactly an important angle)
= 535 D from 20mar'23 (540 = 360 + 180)
Given these short and long-term observations, the time resistance(s) are notably robust.
Historical Repetition:
The ongoing 14-day winning streak, continuously setting new records, typically precedes short-term corrections ranging from 3% to 24%, as historically observed. For instance, in May 2006, Nifty’s non-stop 9-day rally culminated in a 24% index decline in the subsequent month, while a similar trend in February 2000 resulted in an 11% decline in the subsequent month.
Consequently, a market breather is anticipated, with profit booking potentially driving the market to deeper levels before embarking on a new uptrend (anticipated correction in the monthly scale, evident in the 3M time frame). Further details will be provided as the market unfolds.
A correction of this magnitude is expected to materialize, with the following scenarios:
The initial focus is to prioritize the trend line-based correction scenario. The primary support levels are identified at 23,100. Any subsequent breakout will result in distinct scenarios.
Scenario 1: From 15,183.40, retracement towards 21,500 = 4,000 pts (38.2%R) (-12 to 15%), highly probable given the aforementioned reasons.
Scenario 2: From 16,828, retracement towards 21,100 levels = 4,400 pts (50%R) (-13% to 17%), also plausible within the realm of reality.
One of these scenarios is poised to unfold as the market progresses into correction.
Fed and Markets:
Considering the correlation between interest rates and market fluctuations, it is wise to take them into account. Typically, their relationship is inversely proportional. However, the Fed has been delaying the easing process due to economic conditions such as employment and inflation data. This month may bring many surprises.
If everything goes according to plan, interest rates will be reduced, theoretically boosting investment in gold and stock markets. On the other hand, if the dovishness in the rate decision continues, it will likely unsettle the markets, at least in the short term.
Further data releases this month will help in forming a consensus.
IMPORTANT DATES TO REMEMBER!!!
Sept - 5, 6, 11, 12, 18 (FOMC)
Strategy :
1. Being bullish beyond this point is not recommended.
2. Bearish bets are prudent from 25, 300 – 350, 400 for FOMO traders.
Risky traders may consider waiting for the 25,500 levels to be tested.
Disclaimer:
Before concluding, I must underscore that the insights shared are based on my analysis. It is imperative for you to conduct your research and, if necessary, consult with a financial advisor before making any trading decisions. The dynamic nature of financial markets necessitates that your strategies align with your financial goals and risk tolerance.
Your feedback is genuinely appreciated, and I would encourage you to share your thoughts in the comments section. I am committed to engaging with each response.
Fellow Traders,
Countless hours of dedication and effort have gone into creating this valuable analytical resource. If you find it useful, I humbly ask for your support by liking and following me. Your comments and thoughts on this idea are highly valued, and I am committed to engaging with each one personally.
Thank you for investing your time in reading this article,
Your readership is greatly appreciated.
Wishing you profitable and joyful trading!!!

NIFTY Podcast 28 Aug 2024Two trades were taken today.
1st trade was on OI line entry on 5min timeframe. It was taken with Credit Spread, because I was expecting the market to be sideways and also take advantage of decay in premium prices.
2nd trade was on Podcast levels, again with Credit Spread to take advantage of decay in premium prices.
Notes:
- Credit Spread works when market is sideways or there's 50% risk to be taken

Nifty anlaysis for tomorrow 28 july 2024 (Nifty Intraday Setup)Today After breaking previous day high nifty consolidated from 12 pm to 2 pm and failed to sustain at higher level.
And Nifty closed with a selling swing today.
So for tomorrow if with opening market created a selling swing then a bounce will be expected and day high break or price near high will be expected. Look for W pattern on 5 min.
(SELLING SHOULD NOT BE VERY SHARP AND BIG).
And
If Price move upside and take rejection below todays high & created a lower High (M Pattern on 5 mins.) then intraday low break will be expected.

Review and plan for 2th August 2024 Nifty future and banknifty future analysis and intraday plan in kannada.
Positional trading ideas included.
This video is for information/education purpose only. you are 100% responsible for any actions you take by reading/viewing this post.
please consult your financial advisor before taking any action.
----Vinaykumar hiremath, CMT

#nifty50 analysis for next week 26-30th Aug 2024Nifty surged nearly 300 points last week, closing at 24,823. It reached a high of 24,867 and a low of 24,522. As predicted, Nifty remained within its 25,200-23,900 range.
For the coming week, I anticipate a Nifty range of 25,500 to 24,200. Breaking these levels could trigger significant market movements. If Nifty closes above the strong resistance of 24,860 this week, it could pave the way for levels like 25,500 and 25,800 in the near future. However, Monday's opening is crucial. If it equals the daily high or reaches 24,825, bearish sentiment might return, potentially leading to support levels at 24,625, 24,486, 24,346, and 24,200 being tested.
Meanwhile, the S&P 500 closed at 5,634, up 70 points from the previous week. Interestingly, it closed right at the important Fibonacci level of 5,637. If it can close above this level for two consecutive days, the path to 5,700, 5,806, and even 6,142 could be open, potentially benefiting Indian markets as well.

Nifty live predection and analysis for intradayNifty looking bullish
if sellers again try to push towards support and break resistance then upmove is expected
watch chart on 5 min.
THIS OVERVIEW IS FOR VERY SHORT PERIOD.
Disclaimer: Any of my posts should not be considered as a Buy/ Sell/Hold recommendation. This analysis is for educational and learning purpose only.
I always recommend using Stop Loss and following risk management rules.

Nifty 50 Live Update 31 July 1:50 PMOverall trend is bullish in nifty 50
Price is trading in Triangle Pattern.
If breaks upside then Sharp upmove is expected

Nifty Analysis for Monday 29 july 2024Nifty created sharp upside momentum in last 2 days, it's ultimate goal is 25000.
So I am providing highest probability intraday setup in Nifty50
My overview is bullish in nifty for Monday... it will good if Market opens gapdown or flat & creates a selling swing in first 30-45 mins then after creating a support price will bounce.
If Market opens gapup or flat and moves upside in first 30-45 min. then there is a very less probability of continuation so if Market creates M pattern then selling swing will be expected and intraday low break is min. expected.

NIFTY - Correction ahead of BudgetAt this juncture, nifty is expected to correct to the mentioned levels & to continue its rally towards 25,000 ~ 25,400 levels before any monthly correction can happen. The correction will be progressing through various barriers of supports(FIBONACCI & T.lines).
SI - 24,162
SII - 24,010
SIII - 23,881 ~ 23,855 levels (V.imp support coincidence of .5% & mid T.line)
The strategy is to take short today after testing the previous High @ 24,401 (the move might start today or 2 days later, Tentative)
Trade Accordingly

Nifty Intraday (05-Jul-2024)The image is a chart displaying the 15-minute price movements of the Nifty 50 Index for July 3rd and 4th, 2024. It includes technical analysis with marked buy and sell signals:
-Buy Signal: A suggestion to buy above 24,350 with a target open for 24,450 or more.
-Sell Signal: A recommendation to sell below 24,275 with a target of 24,125 or lower.
The chart also shows the 20-period Exponential Moving Average (EMA), which helps traders gauge the trend direction and potential support or resistance levels.

NIFTY - Trend ContinuationAs it happens there seems to be some strength left in the bullish cycle.
This is based on the fact that the trendlines that were resisting till now can't hold it anymore & need much stronger resistance which is where the market is headed (to 24,300 levels)
All of this analysis is attributed to the development of interim weekly correction that collapsed the overall wave analysis done earlier (it calls for an additional 3 waves --> UP-DOWN & UP)
Strategy:
Long only if the market stays above 23,680 with a limited position only
SL: 23,620

Nifty Intraday (01-07-2024)The image displays a trading chart for the Nifty 50 Index, showing a 15-minute interval, as observed on July 1, 2024. Here are the key features of the chart:
Candlestick Format: Each bar represents a 15-minute trading interval with indications of opening, high, low, and closing prices.
Exponential Moving Average (EMA): A blue line represents the 20-period EMA, providing insight into the trend's direction and potential support or resistance levels.
Trading Signals:
-Buy Signal: A green arrow suggests buying if the Nifty moves above 24,035, with an open target above 24,150.
-Sell Signal: A red arrow indicates a selling position if the index drops below 23,950, aiming for a target of 23,825.
Technical Overview: The chart captures the intraday movement of the Nifty index, illustrating volatility and potential trading zones based on the EMA and past performance.

NIFTY - High probability Correction ahead..!!!The move testing the highs of 21st JUN is about to conclude, following which the correction begins in one larger degree. the trendlines & supports can be seen in the charts
Important points of support will be,
SI - 22,665
SII - 22,535 to hold temporarily
SIII - 22,130 ~ 21,830
SL - Any higher moves beyond 23,750
PS: The correction has equally arguable alternate probabilities, to be exact 2.
1. The correction from 20MAR'23 (16,828 levels) - A LP Outcome
2. The Possibility of an extending triangle - meager probable outcome.
*The discussed outcome is highly probable among all these. However, the data from the market's forthcoming sessions are mandatory for confirming the same - to eradicate the alternatives!!!
Short positions can be taken from 23,690 ~ 23,700 levels
Trade Accordingly.

NIFTY - On the verge of a correction There is a possibility that the market is being interrupted by the intersection of two strong resistances (mid-trend line intersection) which calls for a correction in the monthly time frame.
However, the penultimate move is yet to be completed.
The market is about to test the previous day's low @23,442.60 & after that, there will be a struggling upward move testing again at 23,664. The correction progresses from there to the 21,280 ~ 21,200 levels
Today support for the upcoming penultimate move will be,
SI - 23,442.60
SII - 23,435 ~ 417
SIII - 23,382
NO recommended SL for this trade setup (Any substantial increase above 22,664, calls off the trade).
The resistance to the final move is 23,664 & is expected to surpass the said levels by a minimum margin.
Trade accordingly.

