Nasdaq (NQ1!) Weekly Chart Analysis – What’s Next? (Week 16)📌 Title:
NASDAQ – 18,000 Holding, But Downside Risk Remains
Review of Last week's outlook:
I said that buying between 18,600 and 18,700 on the 12-hour chart would be reasonable,
but if a 12-hour candle closed below 18,500, it would be a major warning signal.
That strategy was valid at least until Tuesday.
But then three more 12-hour candles formed,
and Tuesday's closing price was 18,938.
The market opened Wednesday with a gap down at 18,790.
Looking at the chart at that time,
price had dropped below the 200-day line on the 2-day chart,
and the 12-hour chart was also not looking good.
So the strategy of buying near 18,600 on the 12-hour chart was no longer valid.
I had mentioned that if a 12-hour candle closed below 18,500,
it could get very dangerous.
And on the 4-hour chart, I had suggested short-term scalping was possible in the low 18,000s.
As expected, there was one bounce from that level,
but the price continued to fall after that.
📋 Description:
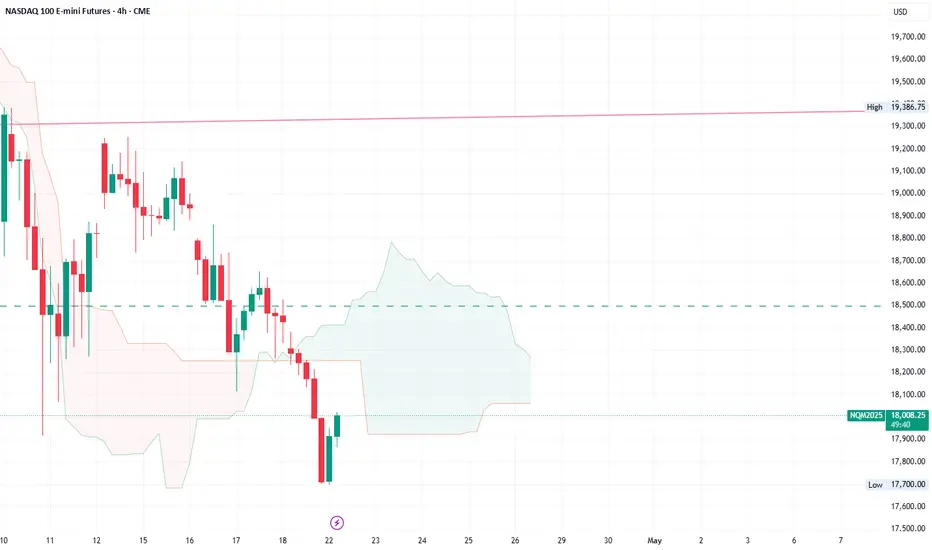
Now, NASDAQ is currently hovering near 18,000.
Although volatility remains low, price action continues to drift lower with weak momentum on higher timeframes.
Key Technical Observations:
• 📉 Still inside the 5-day bullish Ichimoku cloud
• 📍 17,000 = Bottom of the Bi-weekly Kumo + 3D 200SMA
• 📍 16,500 = Previous swing low, potential double bottom area
• 📈 18,400 = Needs to be reclaimed by weekly close to consider range recovery
A clean break below 17,700 could open the path toward 17,000, and possibly lower.
For now, this is a watch-and-react zone not yet a clear buy or sell signal, but conditions are forming for the next move.
🔁 Bias: Neutral to Bearish
⏳ Strategy: Wait for confirmation at 17,700 or breakdown
NASDAQ 100 E-MINI FUTURES
Gold Daily Orderflow explanationCOMEX:GC1!
Gold is currently trading at ATH. I personally am unable to trade ATH. But this is how you can frame your intraday based on the daily expansions

NASDAQ Decision making becomes easy after seeing this chart.NASDAQ (NDX) is currently on the 3rd straight red month (1M candle), following the February High and subsequent sell-off due to the Trade War. This has been analyzed extensively in previous analyses and how the fundamental scene is only now starting to show some positive progress but still has a long way to go.
Technically though, the picture is very clear and favors long-term investing. The market has been trading within a Fibonacci Channel Up since the U.S. Housing Crisis in 2008 and along with the 2022 Inflation Crisis, those have been the only real Bear Cycle events in the past 18 years.
In between those there have been another 5 shorter term corrections, that offered great buying opportunities for the long-term and the recent 3-month one classifies as one.
There reasons are three. First it has come very close to the 1M MA50 (blue trend-line), which only broke during the Major Corrections. Second, the 1M RSI hit the 50.50 Symmetrical Support, which has held during all those 5 prior Minor Corrections. Third, those corrections only range between two Fibonacci levels.
The current correction fulfills all those conditions. And since the 'weakest' rally we've have on this 5 event sample has been +37.57% and the strongest +96.77%, we have a medium-term Target on Nasdaq at 22800 and a long-term one at 32500.
Do you still reserve doubts at investing long-term after seeing this macro chart?
-------------------------------------------------------------------------------
** Please LIKE 👍, FOLLOW ✅, SHARE 🙌 and COMMENT ✍ if you enjoy this idea! Also share your ideas and charts in the comments section below! This is best way to keep it relevant, support us, keep the content here free and allow the idea to reach as many people as possible. **
-------------------------------------------------------------------------------
💸💸💸💸💸💸
👇 👇 👇 👇 👇 👇


NQ KEY ICT LEVELS - 21st APRIL 2025Levels marked on the chart using my free indicator which marks out all of the ICT key levels which can be used for potential POIs where price might react

NQ KEY LEVELS - 21st APRIL 2025Key levels marked by using low volume nodes for potential key levels where we may see price react.

NQ for the weeki don't see a lot of options for shorters here if you didn't catch the move, possibly you can you get some short in lower time frame toward that ray i pointed out there, some options if you want to buy is wait for that thursday low get taken and patiently wait for a reversal. IF today have been this volatile, i don't suggest to trade tomorrow.

Weekly Market Forecast: Stocks Markets Are Stalled! Patience!In this video, we will analyze the S&P 500, NASDAQ, and DOW JONES futures for the week of April 21 - 25th
The Markets are stalled! No bullish follow through from the previous week. Last week failed to break the previous weekly high. This stall out looks consolidative and unclear. Wait for clarity! Let the markets break the high or low of the range convincingly... and trade accordingly.
Enjoy!
May profits be upon you.
Leave any questions or comments in the comment section.
I appreciate any feedback from my viewers!
Like and/or subscribe if you want more accurate analysis.
Thank you so much!
Disclaimer:
I do not provide personal investment advice and I am not a qualified licensed investment advisor.
All information found here, including any ideas, opinions, views, predictions, forecasts, commentaries, suggestions, expressed or implied herein, are for informational, entertainment or educational purposes only and should not be construed as personal investment advice. While the information provided is believed to be accurate, it may include errors or inaccuracies.
I will not and cannot be held liable for any actions you take as a result of anything you read here.
Conduct your own due diligence, or consult a licensed financial advisor or broker before making any and all investment decisions. Any investments, trades, speculations, or decisions made on the basis of any information found on this channel, expressed or implied herein, are committed at your own risk, financial or otherwise.

Will Nasdaq Test Liquidity at 17,800 Before an Upside Move?NASDAQ is experiencing bearish slow down at the support level for the past 3 weeks. A re-test of the recent low looks imminent. and if price could be rejected after clearing H4 liquidity at 17,800, then we could see a sharp upside move.
Key risks: Fed commentary, major tech earnings, and geopolitical headlines.
N.B!
- NASDAQ price might not follow the drawn lines . Actual price movements may likely differ from the forecast.
- Let emotions and sentiments work for you
- ALWAYS Use Proper Risk Management In Your Trades
#nq!
#nasdaq

A Tolled BellThe first bell has rung. A bridge is being paved across the $6000 range.
IF it blows up, it likely won't happen until the bridge is constructed and sentiment improves. Expect a few heartfelt endeavors to shoot above $6,660. Base case is long term crab market.

GC1! Gold Futures Weekly Outlook. Expecting Mid week reversalCOMEX:GC1!
Expecting a massive meltdown on Gold after $3400. On the Daily Internal Range Liquidity.
Trading All Time Highs is different compare to trading when you have a data on the left. Very volatile conditions on GOLD. I will buy from a 4H orderflow upto $3400. Then would short from $3400 CME_MINI:NQ1!

E-mini S&P 500 Outlook for next week. Thought process is the same just like NQ1!. Want massive buyside expansion. But weekly profiles need to be there. Tuesday/Wednesday Low of the Week is what I' personally looking for.
So expecting an SMT Divergence on the Previous Weekly Sellside . And then a massive push up.
2nd Stage Distribution on Market Maker Buy Model. Offset it is. Crosshairs on 5529

E-mini Nasdaq 100 Weekly Overview & Outlook for next weekIntroduction of Gap Quadrants. Weekly Orderflow Review. Expecting classic Weekly "Power of Three" next week. Along with a SMT Divergence on the lows with ES1!

Stock Market Forecast | TSLA NVDA AAPL AMZN META MSFTStock Market Forecast | NASDAQ:QQQ AMEX:SPY
Mag 7 Forecast | NASDAQ:TSLA NASDAQ:NVDA AAPL AMZN META MSFT

MNQ!/NQ1! Day Trade Plan for 04/17/2025MNQ!/NQ1! Day Trade Plan for 04/17/2025
📈18594 18670 18740
📉18440 18365 18290
Thanks to all my followers! Truly appreciate the support!
Please like and share for more NQ levels Tues & Thurs 🤓📈📉🎯💰
*These levels are derived from comprehensive backtesting and research and a quantitative system demonstrating high accuracy. This statistical foundation suggests that price movements are likely to exceed initial estimates.*

NASDAQ: Stop the noise. Long term investors are buying here.Nasdaq may be recovering on its 1D technical outlook but remains bearish on the 1W (RSI = 37.616, MACD = -451.790, ADX = 38.564) as the timeframe is still under the dramatic effect of the 3 month correction. The market however appears to be finding support a little over the 1W MA200 and may turn out to be the new long term technical bottom as the 1W RSI rebounded from oversold grounds.
The last three times that happened, the index rose aggressively. The 15 year pattern is a Bullish Megaphone and every rally inside it obviously gets stronger. As long as the market is holding the 1W MA200, the trend will be bullish and this is the right opportunity to buy for the long term, aiming at another +113.90% bullish wave (TP = 36,000) to get hit towards the end of 2027.
## If you like our free content follow our profile to get more daily ideas. ##
## Comments and likes are greatly appreciated. ##

NQ! Short Idea (MMXM, Quarterly Theory) LONDON REVERSALHello everyone, today you will see my current Short Idea on the Nasdaq. I want to see the reaction of the 15M OB that we are sitting in, if we show Disrespect of that Area, I will be looking for Shorts.
Praise be to God
-T-

MNQ!/NQ1! Day Trade Plan for 04/15/2025MNQ!/NQ1! Day Trade Plan for 04/15/2025
📈19130 19280
📉18670 18520
Thanks to all my followers! Truly appreciate the support!
Please like and share for more NQ levels Tues & Thurs 🤓📈📉🎯💰
*These levels are derived from comprehensive backtesting and research and a quantitative system demonstrating high accuracy. This statistical foundation suggests that price movements are likely to exceed initial estimates.*

Daily Price Action: Futures Nasdaq NQ1! Tuesday 4/15/2025In this video, we are looking into the potential daily price action of NQ1!.

Does the Nasdaq keep dropping after approaching the nearby high?I have 2 zone that are coded as a "no close above" that should have held no issue
The reason why I am short mainly is because we haven't visit 50% of the New Week Opening Gap and we have rejected from 50% of the bearish gap above the range. As well as volumetric divergence after the rally.
I want to see this gap at least partially filled before anything else this week can happen.

NASDAQ Trump's 2 TRADE WARS are identical! What you need to knowNASDAQ (NDX) had a massive bullish reversal 1W candle last week as, despite a Lower Low opening, the intra-week rebound surpassed the opening of the previous week. The sell-off reached almost as low as the 1W MA200 (orange trend-line) , which has been the Support level of the late 2022 Inflation Crisis bottom and has been untouched for more than 2 year.
This is not the first time we see this pattern. In an interesting twist of events, we saw the exact same formation during Trump's 1st Trade War, which bottomed on the week of December 24 2018, near the 1W MA200 as well and exactly on the 0.382 Fibonacci retracement level from the Top.
The similarities don't stop there as both Trade War periods were manifested within Megaphone patterns. Their sell-off/ Bearish Leg was -25% (now) and -23% (2018) respectively, while the set-up leading to those Megaphones was a +103.50% and +113.50% Bull Cycle respectively. Also both sell-offs got an oversold (30.00 or lower) 1W RSI bottom.
So, since NDX has currently completed a -25% correction near the 1W MA200 and the 0.382 Fib with the 1W RSI bouncing off the oversold barrier, it is very likely that we've formed the pattern's bottom, especially if the global fundamentals point towards trade deals.
If this Low remains intact, we expect a similar +35% short-term Top at 22500 within a 3-4 month period and then long-term rally near the -0.382 Fibonacci extension at 29000.
-------------------------------------------------------------------------------
** Please LIKE 👍, FOLLOW ✅, SHARE 🙌 and COMMENT ✍ if you enjoy this idea! Also share your ideas and charts in the comments section below! This is best way to keep it relevant, support us, keep the content here free and allow the idea to reach as many people as possible. **
-------------------------------------------------------------------------------
💸💸💸💸💸💸
👇 👇 👇 👇 👇 👇

Nasdaq Technical Analysis. What Makes Nasdaq a Trader’s Favorite📊 Nasdaq Technical Analysis – Week 15, 2025
This week’s Nasdaq structure suggests a high probability of sideways movement between 19,500 and 18,700,
despite recent macro-driven volatility.
Key headlines include: – U.S. tariff adjustments & China’s 125% retaliation
– March CPI hitting the lowest level since early 2021
– Bond market instability and capital outflows
From a technical perspective:
🔹 volatility on the weekly is overheated — suggesting reduced volatility ahead
🔹 Fibonacci 0.618 near 20,084 may act as short-term resistance
🔹 Ideal long zone sits between 18,600 and 18,700, with invalidation below 18,500
(by 12H closure)
🔹 Ideal long zone sits between 18,000 and 18,300, with invalidation below 17,900
(Just a touch of 17,900 might invalidate this idea)
This analysis includes trendline setups held since 2023, confirming the value of clean charting.
A full structure review from Yearly to 4H charts is included.
No news-based guesswork. Just structured, chart-driven insight.
📌 If this chart aligns with your bias, feel free to save, comment, or follow.

Weekly Market Forecast: Stocks Markets Could Push Higher!In this video, we will analyze the S&P 500, NASDAQ, and DOW JONES futures for the week of April 14-18th.
The Stock Market Indices ended a turbulent week on a bullish note, and next week could see some continuation. The markets have peeked above the consolidation, and could be on the way to resume the overall bullish trend.
Wait for confirmations of the trend before jumping in! One bad report of tariffs or geo-political news can turn the markets down at any time.
Enjoy!
May profits be upon you.
Leave any questions or comments in the comment section.
I appreciate any feedback from my viewers!
Like and/or subscribe if you want more accurate analysis.
Thank you so much!
Disclaimer:
I do not provide personal investment advice and I am not a qualified licensed investment advisor.
All information found here, including any ideas, opinions, views, predictions, forecasts, commentaries, suggestions, expressed or implied herein, are for informational, entertainment or educational purposes only and should not be construed as personal investment advice. While the information provided is believed to be accurate, it may include errors or inaccuracies.
I will not and cannot be held liable for any actions you take as a result of anything you read here.
Conduct your own due diligence, or consult a licensed financial advisor or broker before making any and all investment decisions. Any investments, trades, speculations, or decisions made on the basis of any information found on this channel, expressed or implied herein, are committed at your own risk, financial or otherwise.
