NQ KEY LEVELS - 1st MAY 2025Key levels marked by using low volume nodes for potential key levels where we may see price react.
NQ1

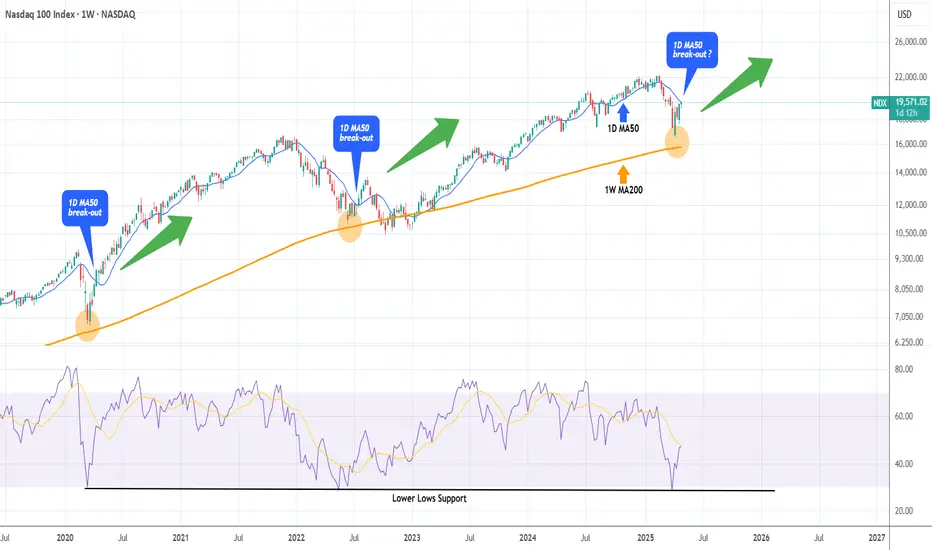
NASDAQ testing its 1D MA50. Break-out or Fake-out?Nasdaq (NDX) has reached its 1D MA50 (blue trend-line) for the first time since February 24. Following the (near) rebound on the 1W MA200 (orange trend-line), this looks like a textbook recovery from a correction to a new long-term Bullish Leg.
Chronologically the last such correction was the March 2020 COVID flash crash, which after it almost touched the 1W MA200, it recovered as fast as the current rebound and when it broke above its 1D MA50, it turned it into the Support of the new long-term Bullish Leg.
What wasn't a break-out but a fake-out was the rebound after the June 13 2022 (near) 1W MA200 rebound, when the break above the 1D MA50 was false as it produced a new rejection and sell-off later on. The difference is that 2022 was a technical Bear Cycle both in terms of length and strength.
Whatever the case, Nasdaq has seen the lowest 1W RSI (oversold) reading among those 3 bottoms. So do you think today's 1D MA50 test is a break-out or fake-out?
-------------------------------------------------------------------------------
** Please LIKE 👍, FOLLOW ✅, SHARE 🙌 and COMMENT ✍ if you enjoy this idea! Also share your ideas and charts in the comments section below! This is best way to keep it relevant, support us, keep the content here free and allow the idea to reach as many people as possible. **
-------------------------------------------------------------------------------
💸💸💸💸💸💸
👇 👇 👇 👇 👇 👇
anyone that is buying is missing outgreat discounts I guess sir Warren Buffet is to buy now? still this good discounts are for everyone to buy.

NASDAQ: Rejected on the 1D MA50. Can it break it?Nasdaq is neutral on its 1D technical outlook (RSI = 52.608, MACD = -100.810, ADX = 23.609) as it got rejected today on the 1D MA50. That is the first serious Resistance test of the April 7th rebound and until it breaks, we can see a technical pullback to the 4H MA100 in order to establish the new Support. With the 1D RSI confirmed the new long term bottom with a DB, buying the dips on every such pullback is the most effective strategy on such occasions. Our short term target is the R1 level (TP = 20,300).
## If you like our free content follow our profile to get more daily ideas. ##
## Comments and likes are greatly appreciated. ##

#NQ1! "E-Mini Nasdaq 100" Index Market Bullish Robbery Plan 🌟Hi! Hola! Ola! Bonjour! Hallo! Marhaba!🌟
Dear Money Makers & Robbers, 🤑 💰💸✈️
Based on 🔥Thief Trading style technical and fundamental analysis🔥, here is our master plan to heist the NQ1! "E-Mini Nasdaq 100" Index Market Heist. Please adhere to the strategy I've outlined in the chart, which emphasizes long entry. Our aim is to escape near the high-risk YELLOW MA Zone. It's a Risky level, overbought market, consolidation, trend reversal, trap at the level where traders and bearish robbers are stronger. 🏆💸"Take profit and treat yourself, traders. You deserve it!💪🏆🎉
Entry 📈 : "The heist is on! Wait for the Crossing previous high (19800) then make your move - Bullish profits await!"
however I advise to Place Buy stop orders above the Moving average (or) Place buy limit orders within a 15 or 30 minute timeframe most recent or swing, low or high level for Pullback entries.
📌I strongly advise you to set an "alert (Alarm)" on your chart so you can see when the breakout entry occurs.
Stop Loss 🛑: "🔊 Yo, listen up! 🗣️ If you're lookin' to get in on a buy stop order, don't even think about settin' that stop loss till after the breakout 🚀. You feel me? Now, if you're smart, you'll place that stop loss where I told you to 📍, but if you're a rebel, you can put it wherever you like 🤪 - just don't say I didn't warn you ⚠️. You're playin' with fire 🔥, and it's your risk, not mine 👊."
📍 Thief SL placed at the nearest/swing low level Using the 2H timeframe (19200) Day trade basis.
📍 SL is based on your risk of the trade, lot size and how many multiple orders you have to take.
🏴☠️Target 🎯: 20500
🧲Scalpers, take note 👀 : only scalp on the Long side. If you have a lot of money, you can go straight away; if not, you can join swing traders and carry out the robbery plan. Use trailing SL to safeguard your money 💰.
💰💵💸NQ1! "E-Mini Nasdaq 100" Index Money Heist Plan is currently experiencing a bullishness,., driven by several key factors. .☝☝☝
📰🗞️Get & Read the Fundamental, Macro Economics, COT Report, Geopolitical and News Analysis, Sentimental Outlook, Intermarket Analysis, Index-Specific Analysis, Future trend targets with Overall outlook score... go ahead to check 👉👉👉🔗🔗🌎🌏🗺
⚠️Trading Alert : News Releases and Position Management 📰🗞️🚫🚏
As a reminder, news releases can have a significant impact on market prices and volatility. To minimize potential losses and protect your running positions,
we recommend the following:
Avoid taking new trades during news releases
Use trailing stop-loss orders to protect your running positions and lock in profits
💖Supporting our robbery plan 💥Hit the Boost Button💥 will enable us to effortlessly make and steal money 💰💵. Boost the strength of our robbery team. Every day in this market make money with ease by using the Thief Trading Style.🏆💪🤝❤️🎉🚀
I'll see you soon with another heist plan, so stay tuned 🤑🐱👤🤗🤩

NQ1! High Resistance Liquidity Run Market ProfileCME_MINI:NQ1!
Wanted to short NQ for daily FVG . Unable to get the draw after the displacement. Took two stops and stayed side lines for the rest of the day


NQ KEY ICT LEVELS - 29th APRIL 2025Levels marked on the chart using my free indicator which marks out all of the ICT key levels which can be used for potential POIs where price might react

NQ KEY LEVELS - 29th APRIL 2025Key levels marked by using low volume nodes for potential key levels where we may see price react.

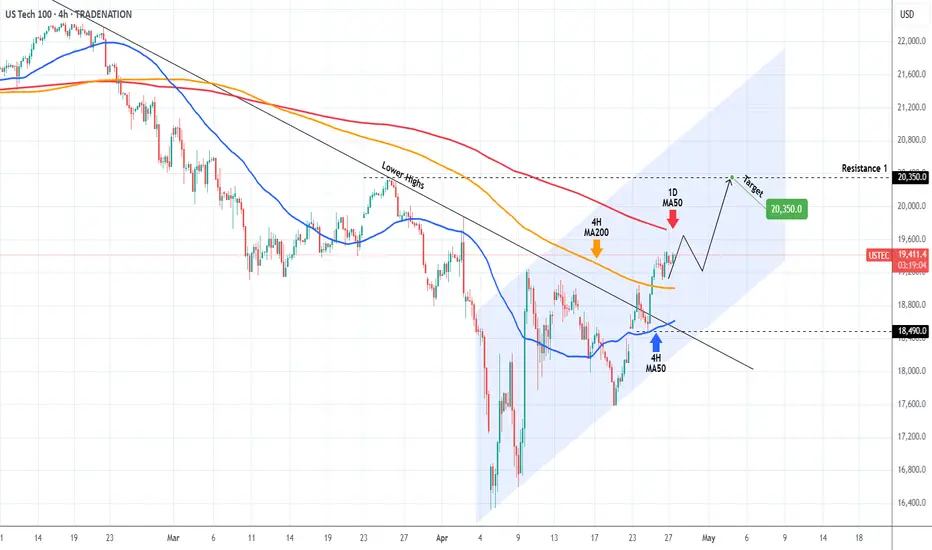
NASDAQ ahead of the most critical Resistance test.Nasdaq (NDX) not only broke above the Lower Highs trend-line of its All Time High (ATH) last week but managed to break and turn the 4H MA200 (orange trend-line) into Support.
It is now aiming for the 1D MA50 (red trend-line), which is the most crucial Resistance level of this recovery attempt and is what technically turns bearish trends into bullish if it turns into Support.
We expect a short-term rejection there, which should give a buy opportunity near the 4H MA200. Our Target for this is 20350 (Resistance 1).
-------------------------------------------------------------------------------
** Please LIKE 👍, FOLLOW ✅, SHARE 🙌 and COMMENT ✍ if you enjoy this idea! Also share your ideas and charts in the comments section below! This is best way to keep it relevant, support us, keep the content here free and allow the idea to reach as many people as possible. **
-------------------------------------------------------------------------------
Disclosure: I am part of Trade Nation's Influencer program and receive a monthly fee for using their TradingView charts in my analysis.
💸💸💸💸💸💸
👇 👇 👇 👇 👇 👇

NQ KEY ICT LEVELS - 28th APRIL 2025Levels marked on the chart using my free indicator which marks out all of the ICT key levels which can be used for potential POIs where price might react

NQ KEY LEVELS - 28th APRIL 2025Key levels marked by using low volume nodes for potential key levels where we may see price react.

Weekly Market Forecast: Buy Stocks! Sell Oil! Buy Gold!In this video, we will analyze the S&P 500, NASDAQ, DOW JONES, Oil, Gold and Silver futures, for the week of April 28 - May 2nd.
Markets are looking tradeable again.
The indices look bullish, creating +FVGs as they move higher.
Oil has corrected a bearish impulse, so it could be poised to move lower from the Daily and Weekly -FVG.
Gold took a breather last week and could move higher from the Weekly +FVG it just created.
Let's go!
Enjoy!
May profits be upon you.
Leave any questions or comments in the comment section.
I appreciate any feedback from my viewers!
Like and/or subscribe if you want more accurate analysis.
Thank you so much!
Disclaimer:
I do not provide personal investment advice and I am not a qualified licensed investment advisor.
All information found here, including any ideas, opinions, views, predictions, forecasts, commentaries, suggestions, expressed or implied herein, are for informational, entertainment or educational purposes only and should not be construed as personal investment advice. While the information provided is believed to be accurate, it may include errors or inaccuracies.
I will not and cannot be held liable for any actions you take as a result of anything you read here.
Conduct your own due diligence, or consult a licensed financial advisor or broker before making any and all investment decisions. Any investments, trades, speculations, or decisions made on the basis of any information found on this channel, expressed or implied herein, are committed at your own risk, financial or otherwise.

Nasdaq WE ARE DOOMED! IF Trump will keep doing same bs)NQ on top of the range, have to wait for weekly opening because there are few direction where it can go
1 - without correction all the way up till 20044 and 20200( daily IFVG)
2 - correction till breaker ~19200, liq grab rebalance here and all the way up
3 - it will be deviation of the range that we had then aggressive market shift( ChoCH) with FVG small pull back to 19200-19400 (depends on FVG) and then all the way down till 18-17-16k (red line)

MNQ1!/NQ1! Day Trade Plan for 04/25/2025MNQ1!/NQ1! Day Trade Plan for 04/25/2025
📈 19430 19580
📉 19140 18980
Thanks to all my followers! Truly appreciate the support!
Please like and share for more NQ levels Tues & Thurs 🤓📈📉🎯💰
*These levels are derived from comprehensive backtesting and research and a quantitative system demonstrating high accuracy. This statistical foundation suggests that price movements are likely to exceed initial estimates.*

Nasdaq 100 Fills "Liberation Day" Gap – New Bull Market?The Nasdaq 100 ( CME_MINI:NQ1! ) has officially filled the Liberation Day gap from April 3rd.
It took three weeks of grinding to recover from a three-day crash.
Bulls are now calling this the start of a new bull market... really?
📌 Technical Recap:
Gap filled ✅
Resistance area retested ✅
Next step: Follow-through needed above 19,600 to confirm strength.
🚨 Caution: A gap fill is not a breakout. FOMO is high. Momentum needs to prove itself now or risk a hard rejection.


NQ KEY ICT LEVELS - 25th APRIL 2025Levels marked on the chart using my free indicator which marks out all of the ICT key levels which can be used for potential POIs where price might react

NQ KEY LEVELS - 25th APRIL 2025Key levels marked by using low volume nodes for potential key levels where we may see price react.

US100 - Corrective Pullback into FVG + Golden Pocket setup?This 1H Nasdaq chart paints a classic structure of retracement within a bullish leg, offering potential for continuation after a clean corrective move into inefficiency. It's all about balance restoration before the next impulse.
---
1. Resistance Reaction & Local Distribution
Price faced strong rejection at a clearly defined Resistance Zone , marking a point of supply where sellers stepped in with aggression.
- The sharp rejection indicates profit-taking from earlier longs or a short-term distribution zone.
- Structure is transitioning from impulsive to corrective, suggesting a pullback is unfolding rather than a trend reversal (at least for now).
---
2. Short-Term Demand Zone Holding Price (Gray Box)
Before reaching deeper liquidity, price is hovering above a local demand block —a previously unmitigated consolidation that supported the last push up.
- This gray zone may provide temporary support, but lacks depth of imbalance.
- It's a weak floor, and smart money typically seeks deeper fills for proper re-accumulation.
---
3. Fair Value Gap Below (Primary Draw on Liquidity)
The key area of interest lies just below, where a clean Fair Value Gap (FVG) is formed. This imbalance represents a void in price action where buy-side inefficiency remains.
- Aligned with the 0.618–0.65 Fibonacci retracement range (confluence entry).
- Price is likely to seek this inefficiency for proper rebalancing.
- It’s not just a “fill the gap” play—it’s a liquidity grab where smart money is most likely waiting.
This zone is ideal for reaccumulation before resuming the move higher.
---
4. Internal Structure Suggests Bullish Intent After Fill
Price is forecasted to:
- Step 1: Break beneath the short-term demand to draw in liquidity
- Step 2: Tag the FVG zone, tapping into fresh demand
- Step 3: Shift structure via higher low formation and breakout
This is the behavior of an engineered retracement—not panic selling.
---
5. Macro Bias Still Bullish – Controlled Pullback
While the short-term price action looks bearish, the context remains supportive of upward continuation:
- No signs of aggressive selling below structure
- Current flow is corrective, not distributive
- FVG zone is strategically placed in alignment with optimal trade entry levels (OTE)
If this zone holds, expect a return to bullish expansion targeting inefficiencies left behind on the push down.
---
Conclusion:
This setup is textbook:
- Efficient rejection at resistance
- Controlled retracement into FVG with Fibonacci confluence
- Potential structural shift post-rebalance
Watch for bullish intent to return once the imbalance is filled. Until then, this is not a breakdown—it's a setup.


NQ KEY ICT LEVELS - 24th APRIL 2025Levels marked on the chart using my free indicator which marks out all of the ICT key levels which can be used for potential POIs where price might react
