Trading the Impulse Rally Retracement — Price and Time Symmetry Trend is observed from an impulse run’s lowest/highest point and projected outwards in symmetrical fibonacci retracement via price/time from the first reversal candle to the end of the rally, creating crosshairs. These ‘crosshairs’ visually represent the trending ‘price distribution projection’ in price/time symmetry.
Using this concept, I draw a ‘projection trend line’ from the bottom or top of the impulse run thru the projected 78.6% price/time retracement value, to identify the price distribution structure in a linear form.
Now to introduce my STOP LOSS TRIANGLE.
This is a concept of decaying price and time as an underlying move towards our theoretical projection, where if the underlying enters our built faded cross-section, the SL is triggered to avoid sideways consolidation and decaying contract premiums.
This ‘right’ triangle that is ‘sclene’ by nature is created by taking the furthest projection in price/time symmetry (78.6%) and drawing a vertically placed straight line to the highest/lowest point in the rally previously identified. Here, I create a ‘right triangle’ by turning 90 degrees towards my final point, which is made by the nearest projection in price/time symmetry (38.2%). In its entirety, this forms the stop loss triangle.
Come follow me on X @askHVtobidIV for more!
CHEERS!
NVDA

Bad News from NVDA and ASML Put Pressure on AI StocksTwo pieces of bad news hit the chip sector in a single day.
First, the U.S. announced new restrictions on Nvidia, blocking the sale of its H20 chip to China. H20 was the only AI chip Nvidia could legally sell to China under existing regulations. The company stated the new restrictions could cost up to $5.5 billion.
The second blow came from ASML’s earnings report. ASML is the sole producer of EUV machines, which are critical for manufacturing advanced chips, including those used in AI. ASML's revenue miss, combined with the Nvidia news, weighed heavily on technology stocks. However, there is a silver lining: the revenue miss was due to weaker DUV machine sales, which are used for more basic chips. EUV sales actually beat market expectations by 33.54%, indicating that investment in AI infrastructure remains strong.
Nvidia shares are down more than 6% in premarket trading. This downward pressure may continue after the market opens. If the price drops below 100, it could present a buying opportunity for medium- to long-term investors. AI investment continues globally, and countries outside the U.S. are likely to accelerate their efforts to catch up. Despite the recent negative sentiment, there is no major change in the long-term outlook for the sector.

$SPX Sell in May, Go Away, $5k, Dead Cat to $5.3k, $4.8k by EOMAlrighty. My forecast is as follows. I made a video explaining just a quick thought and here's the video in a written version for the most part. Basically, I'm a pattern chart trader and I spend the majority of my days looking for specific candlestick patterns that match candle for candle. I cannot find anything remotely close to today's Price Action besides October 2001. I have been and will continue to be doubted and that's okay. I am not here for anyone except myself and anyone that wants to gain a fresh unbiased perspective. People have called me a Permabear but that only pertains to my personality, which is that of a realist. I do not believe investing for the next 20-50 Years will work for everyone. You'd have to do it well and continuously contribute even during the down days. Either way. This is the analog I will be following. Fib is Extended way beyond Blow Off Top measurements imo. The market gained 50% in One Year and Three Months. I'd like to think that the uncertainty being priced in will cause these Deeper Fib Retracements. We already crashed down to the 1.61 GOLDEN POCKET from above and now bounce back to Secon Golden Pocket at 2.61. Based on the past behavior, now we move back to 2.0 for a move to the original extension of the 1.00 Fib. If we lose this, we start moving back to the 1.27 near $4.74k on SPX where I will then be looking for one final dead cat to $5300 by mid August, Every July dip being grabbed up ... Final Sell in August for an End of Year Crash to Mark 2025 as one of the worst years ever in Life as far as the Market goes. Good Luck everyone. Tips always welcome.

Was this the best buying opportunity since 2011?Sure, here's a rewritten version of your text in an engaging tone:
"Have you ever heard of the Zweig Breadth Thrust? Well, let me tell you, it’s an incredible metric that can really shed some light on the current market situation!
So, what would it take for me to believe that this bounce isn't just another bear market rally? My first step would be to dive into the breadth indicators and look for signs of that elusive breadth thrust.
Think of a breadth thrust like a rocket taking off. You need a strong initial boost to break free of gravity's grip. If the thrust is weak, the rocket can’t escape, and the same applies to stock market reversals. When we see a robust breadth thrust, that's a signal that a significant reversal is underway. Without it, we could be facing another false bounce.
Now, let’s talk numbers! As of Friday, April 25th, the SPX has surged an impressive 14.2% from its recent lows, and while that’s quite a leap, it’s essential to keep it in perspective. Just think back—this index was down 21.35% from its all-time high earlier in February during the panic sell-off. Now, with the recent strength, it’s only 10.75% off its peak.
The Zweig Breadth Thrust is calculated based on the 10-day EMA of NYSE Advances divided by the sum of Advances and Declines. A bullish signal pops up when the ZBT shifts from below 0.40 to above 0.615 within just ten days or less. Keep an eye on that—it might just help us navigate these choppy waters!"
On the monthly chart, it’s clear that what we’ve been seeing in the broader economy (you know, Main Street) is actually showing us some bearish divergence—a concept I've mentioned in my previous ideas.
Since 2009, we've had four notable instances on the Monthly chart where the ZBT dipped below 0.40, only to bounce back up past the 0.6 mark. Remember back in November 2011? That was when we got a significant signal with a low reading of 0.31, which climbed back to 0.62 by February 2013. That surge sparked a bull run that peaked in February 2020!
So, the takeaway here is that this breadth thrust is generating the positive momentum we need to reach new stock market highs this year. Exciting times ahead!

MAGS SUPER STRUCTURE FORMING CAUTION!We have MEGA superstructures forming everywhere. H&S Eiffel Towers, etc.. None will be more devastating to 401ks and people's portfolios than the MAGS breaking down from this mammoth structure.
Last chance to GTFO forming.
CAUTION is in order!
Click Boost, Follow, Subscribe. Let's get to 5,000 followers ))

𝗧𝗲𝘀𝗹𝗮 𝗕𝗿𝗲𝗮𝗱𝗸𝗼𝘄𝗻: Priced for perfectionPriced for perfection in an imperfect market
NASDAQ:TSLA nearly hit its 200dma and key resistance area (~288–292) after a roughly 20% post-earnings squeeze, and as long as it stays below that level, it risks retesting the long-term uptrend line that has marked major lows twice since COVID.
𝘛𝘢𝘳𝘪𝘧𝘧 𝘢𝘯𝘥 𝘴𝘶𝘱𝘱𝘭𝘺-𝘤𝘩𝘢𝘪𝘯 𝘳𝘪𝘴𝘬: Tesla depends heavily on Chinese-made battery and electronic components now hit by reciprocal U.S. tariffs, while over 60% of global neodymium and dysprosium—vital for its EV motors—are mined and processed only in China, creating a critical bottleneck that could sharply elevate its input costs.
𝘔𝘢𝘳𝘨𝘪𝘯 𝘱𝘳𝘦𝘴𝘴𝘶𝘳𝘦 𝘷𝘴. 𝘭𝘰𝘧𝘵𝘺 𝘷𝘢𝘭𝘶𝘢𝘵𝘪𝘰𝘯: Q1 price cuts of up to 20% on core models drove Tesla’s auto gross margin to its lowest since 2020, calling into question the sustainability of its >70× forward P/E multiple, which assumes exceptionally high profits from future ventures like robotics and autonomous fleets.
$NQ_F NASDAQ:NDX NASDAQ:QQQ NASDAQ:AMZN NASDAQ:META NASDAQ:NVDA NASDAQ:SOX $ES_F AMEX:SPY SP:SPX TVC:DXY NASDAQ:TLT TVC:TNX TVC:VIX #Stocks #TrumpTariffs 🇺🇸 #ChinaTariffs 🇨🇳

$NVDA one more leg lower $58-76 targetNASDAQ:NVDA bounced off the lows at $86 but is now finding resistance, I think it's likely that we turn lower next week and start falling towards the targets below.
I think it's very likely that we make it down to the lower supports at $63-58 before we see a sustainable bounce form.
Let's see how it plays out over the coming weeks.

Nvidia Prepares For New All-Time High, Last Chance To Buy Low!The market always gives as second chance. This is a phrase that I love to share and it is true, it is confirmed here on this very chart.
The action for NVDA moved back down to produce a higher low —your second and last chance. This higher low is happening within a very strong buy-zone and this can mean the difference between massive profits or an opportunity that is lost. From here on, Nvidia will grow long-term set to produce a new All-Time High in the coming months.
The minimum target and price level for this rise stands around ~150 within 1-3 months. Then a correction and then higher, much higher... Up, up and up go we.
I can entertain you with tons of details I have the ability but I will not do so. I will go straight to the point.
» The next All-Time High and main target for this wave is 194, this can take a little more, or less, than 6 months.
What will happen next, we will have to wait to ask the chart.
It is my pleasure to write for you again.
Make sure to boost if you would like more updates.
If you boost and comment, we can move to daily updates as the market grow.
Go in, go now, buy-in and go LONG!
Nvidia is going up! Together with Bitcoin and the Altcoins.
Thanks a lot for your continued support.
Namaste.

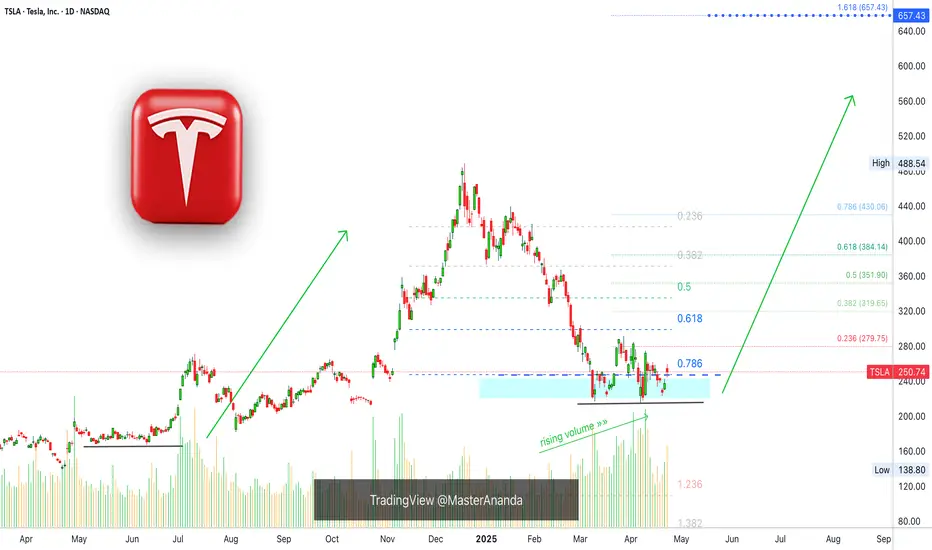
Tesla Finds Support, 657 Next Easy High & All-Time HighTesla is looking pretty good right now, support has been found. The correction amounted to -55.5%. It started in mid December 2024 and the first low was hit in March 2025.
Since March TSLA has been in the process of forming a bottom.
The action moved below 0.786 Fib. retracement level in relation to the last bullish wave. The action is back above this level now and this is pretty good. As long as the action happens above the magic blue dashed line, Tesla is good and set to grow.
This signal, perfect symmetry, is supported by rising volume.
Buy volume is rising massively as TSLA moves into a long-term support zone.
(Smart people, smart money and smart traders buy when prices are low —this volume signal reveals the highest buying in years as TSLA hits support.)
The most revealing fact from a logical standpoint is the size of the correction, a 55% correction is a lot by any standard. When a market goes through such a strong correction, it tends to reverse and produce next a new move. It moves in waves. It goes up and down, up and down. We are seeing the end of the down-move and this will automatically lead to an up-wave.
When the bottom was hit, last month, the action goes flat. Tesla was clearly moving lower but as support was found the bottom stays flat. This is another revealing signal for the logical mind. No longer a downtrend but a consolidation phase, which is part of a transition period.
» So the market was bullish and from bullish turned bearish, from bearish it went sideways and from sideways it will grow.
This is an easy buy.
Thanks a lot for your comment and continued support.
Namaste.
NVDA Recovery in Motion — Bullish Setup BrewingNVDA 6H TECHNICAL ANALYSIS 📈
OVERALL TREND
📈 UPTREND — The chart confirms an early-stage recovery from a key pivot low (April 22), with moderate confidence (4.8%). The structure is forming higher lows, and price is currently above several critical short-term MAs. Trend Score sits at +0.10.
📉RESISTANCE ZONE
🔴 153.1300 — SELL STOPLOSS | PIVOT HIGH
🔴 149.8423 — SELL ORDER 2
🔴 143.18875 — SELL ORDER 1
🎯ENTRIES & TARGETS
🎯 139.8280 — EXIT BUY & TP 4
🎯 127.7263 — BUY ORDER & TP 3
🎯 119.8750 — BUY ORDER & TP 2 | MID PIVOT
🎯 108.5705 — BUY ORDER & TP 1
📈SUPPORT ZONE
🟢 97.0121 — BUY ORDER 1
🟢 89.9455 — BUY ORDER 2
🟢 86.6200 — BUY STOPLOSS | PIVOT LOW
✍️STRUCTURAL NOTES
Recent bounce from 86.62 pivot low signals strong bullish interest
Key reentry occurred above 97.01, aligning with short-term moving averages
All major short-term and mid-range MAs (10–100) are BUY-rated
Oscillators mixed: MACD and Ultimate Oscillator lean bullish, while Momentum and Williams %R flash caution
Ichimoku Base Line neutral — awaiting trend confirmation
Hull MA diverges from other MAs — short-term caution on overheated price
📉TRADE OUTLOOK
📈 Bullish bias toward TP3 @ 127.72 and TP4 @ 139.82
📉 Short-term pullback likely at 108.57 or 119.87 — use dips as potential reentry
🔍 Watch for rejection near 143.18–153.13 to reassess continuation vs correction
🧪STRATEGY RECOMMENDATION
CONSERVATIVE TREND FOLLOW:
— Entry: 97.01
— TP: 108.57 / 119.87 / 127.72 / 139.82
— SL: Below 86.62
AGGRESSIVE REVERSAL:
— Entry: 86.62 (Pivot Low Defense)
— TP: 97.01 / 108.57
— SL: Below 83.00
“Discipline | Consistency | PAY-tience™”

$PLTR Trade: Buy $90.86 , Target $101.35Beep Beep. Hope everyone is taking care of their trading accounts during this volatile phase in the markets. I noticed an identical setup on the weekly from back in August 24' and I'm looking to take advantage. We have a trend reversal on the Tom Demark sequential that helps identify trend exhaustion through a 9 Count. Currently on a 2 Count, we're testing the gap while simultaneously testing the 10WMA at 90.86.There is also a weekly gap at 101.35 ... Entry would be the 10WMA. Target the weekly Gap. Trade is as follows:
Trade Idea - Swing NASDAQ:PLTR $95 Calls 4/25
Entry - 10 WMA @ $90.86
Target - Gap on Weekly at $101.35

Nvidia - The Chart Just Told Us So!Nvidia ( NASDAQ:NVDA ) might just still head a little lower:
Click chart above to see the detailed analysis👆🏻
After Nvidia perfectly retested the previous rising channel resistance just a couple of months ago, it was quite expected that we'll see a retracement. The overall trend however still remains bullish and if Nvidia drops a little more, the overall bullrun continuation rally might just follow.
Levels to watch: $80
Keep your long term vision,
Philip (BasicTrading)

cup with handle pattern on the 1-hour time frameWelcome to today's analysis! Let’s break down the current price action on NASDAQ:NVDA and potential trade setups.
🌐 Overview: NASDAQ:NVDA Forming a Cup with Handle Pattern
📈 NASDAQ:NVDA is currently forming a cup with handle pattern on the 1-hour time frame. This pattern is typically bullish and could indicate a potential upward move.
🔄 Current Scenario:
NASDAQ:NVDA has formed a cup shape and is now developing the handle. The handle is a consolidation phase before a potential breakout.
The key level to watch is the resistance at the top of the handle. A breakout above this level could signal a bullish continuation.
🔑 Key Levels to Watch
🔴 Resistance: Top of the Handle (Needs breakout for continuation)
🟢 Target: Measured move equal to the depth of the cup, projected from the breakout point.
🛠️ Trade Scenarios
📌 Bullish Scenario (Breakout Above Resistance)
If NASDAQ:NVDA breaks and holds above the handle resistance, it could move toward the target level.
This breakout would confirm the cup with handle pattern and suggest a potential upward trend.
📌 Bearish Scenario (Failure to Breakout)
If NASDAQ:NVDA fails to break out and instead moves lower, it could retest the support levels within the cup or handle.
A failure to hold above key support levels could indicate a potential reversal or further consolidation.
📌 Conclusion
NASDAQ:NVDA is forming a cup with handle pattern on the 1-hour time frame. A breakout above the handle resistance could signal a bullish move toward the target level. If the price fails to break out, further consolidation or a retest of support levels may be necessary.

$SPX Urgent! My <3 & My Soul: Slow Bleed Crash to 3k by Q4 26' Do be warned. Very important post here. I put my heart and soul into this. I made a video earlier and then it got deleted by accident, so I made a less happy one right after. I've got news for all the bulls and investors out there that feel they will be able to continue buying every single dip out there. Get ready for the dip that keeps dipping. Big names already cracking heavy. NASDAQ:META NASDAQ:TSLA NASDAQ:AMD NASDAQ:NVDA to name a few. Big tech is getting cleaned out and layoffs are on the rise. Tariffs create huge amounts of uncertainty. I don't feel like this is rocket science. Buffet is all cash. 89% of Hedge Fund managers believe the US market is the most expensive its ever been and Tutes have been selling at the highest rate ever before. I think it's time the US finally gets a shake down. Bullish conditioning has been running rampant, and I've seen Social Media Accounts discourage charting and only paying attention to price action? Price action involves the entire collective, not just one Timeframe. Anyways, here's an overlay from 01' ... the only one I could find that matches. Says short 560 around May 7th and then take profits around 500 again. Let's make this a nice one. Calls till 560 into May then flip to Puts into June. From then short 530 every time you can. $450 is My first target after we break previous lows. I will update as we go. Have a good one yall.

NVDA’s Wild Crash Alert: I’m Braced for a Heart-Stopping Drop!NVDA’s like a rocket losing altitude, and I’m on edge! It’s at $95.99, but I’m seeing it tumble to $90, maybe $88.95, then $83.59 if the bears go wild. If that breaks, whoa—$77.48 could hit hard! I’m glued to $90 for the first clue—big selling there, and it’s game on for a slide.
Kris/Mindbloome Exchange
Trade Smarter Live Better

Down Nearly -5.5% The Nvidia Death Cross. Formed and Diverging?!NVIDIA (NVDA) Looks to be showing a formed death cross of the 65 Day and 200 Day Exponential Moving Averages . Price is down almost -5.50% by Midday.
What could happen next?

$2.29 to $20.00 in massive +773% $UPXI while overall market redDoes it get any better than this? Finding a power runner stock of the day in early premarket which turns out to run $2 to $20 in about 2 hours while the rest of the market drops to new lows of the year?
NASDAQ:UPXI

We're seeing a nice box breakout NVDA | Bullish?We're seeing a nice box breakout here, which could indicate a good opportunity for a deeper correction. Therefore, we're setting the target at $91.5 and would continue moving lower until we see another box breakout in the opposite direction. Additionally, there is a major resistance level around the $91.5 zone, which will give us insight into how far NVDA's downtrend might go—or whether this could mark the turning point.

NVDA: Buy the Dip or Miss the Run?NVDA 💥🔥
Let’s be real, the market’s been shaky. Between the spike in volatility and the new tariff chatter coming out of the Trump camp, tech stocks are getting tossed around. But here’s the thing—volatility is where the setups live. And NVDA, sitting at the center of the AI revolution, isn’t going to stay down forever.
This might be the window. We’re talking a solid entry zone between 90 and 70, right where volatility meets opportunity.
Our profit targets?
✅ 110 for a clean bounce
✅ 125 as momentum builds
✅ 145+ if the bulls take the wheel again
It’s not about chasing—this is about timing the wave before it rips. So if you’re into smart risk, layered entries, and riding volatility like a pro… NVDA just rang the bell.
Disclaimer: This is not financial advice. All trading involves risk, especially in volatile conditions. Always do your own research or speak to a licensed financial advisor before making any trading decisions.

IM BEARISH ON NVIDIA WITH A TARGET OF $55.00. HERE IS WHY:NVIDIA (NVDA) Known for their GPUs, recently has experienced a decline in asset price. Trump tariff's may have been a bearish news catalyst, but do the technicals show a bigger bearish picture?
1 Day chart: While the RSI recently signaled oversold conditions, the RSI line looks to be crossing down the RSI based moving average. Furthermore the 200 Day EMA and 65 Day EMAs appear to be forming a death cross. DMI is still indicating bearish, and the ADX is still above 20.
With recent political news, the tech company has been working on bolstering their U.S based production. But with inflation cooling (6 month low) , I believe many high performing blue chip stocks may see a dip as traders and institutions price in deflation, new news and political events.
My opinion on a target is $55.00 , and there is significant open interest on long puts for this price that are expiring in the coming months.
Will NVIDIA pull out of this downtrend? Or will it become a great value buy for investors?
Disclaimer: Not financial advice.

Stock Market Forecast | TSLA NVDA AAPL AMZN META MSFTStock Market Forecast | NASDAQ:QQQ AMEX:SPY
Mag 7 Forecast | NASDAQ:TSLA NASDAQ:NVDA AAPL AMZN META MSFT

Nvidia: Bullish Monday?A new week is about to get started and we would like to know if the NVIDIA Corporation (NVDA) chart supports a bullish Monday.
What is the chart saying on the daily timeframe?
The chart has many positive signals and support a strong week but...
Good Sunday my fellow Cryptocurrency trader, how are you feeling in this wonderful day?
I hope you are doing great.
Let's read the chart; together, let's trade!
The chart looks really good and the short-term can always surprise, anything goes.
The chart is saying, "up, straight up," and even though the markets are unpredictable, I can easily tell you what the market is doing and is most likely to happen after the weekly close.
NVDA is super bullish and likely to continue growing based on multiple signals:
1) The falling wedge pattern is already confirmed. The action broke above it.
2) The trading volume supports a continuation of the pattern breakout.
3) The correction was really strong but the reaction to support was even stronger. Such a strong reaction indicates that traders were anxious and ready to buy. The only reason to sell was based on political bad news. With the bad news removed, up we go. NVDA is solid and with Bitcoin and mining growing, the market expanding, AI, NVDA is set to follow and also grow.
4) Both the 0.786 and 0.618 Fib. retracement levels are major support and gauge the strength of a stock. If the action is happening below, bearish; when the action happens above bullish. The fact that the action moved below just to recover makes this a strong bullish signal. A failed signal for the bears because they failed to move prices lower. A strong bullish signals for the bulls because the action is back above long-term critical support.
5) The session 10-April closed as a hammer and this also points up.
6) Finally, NVDA managed to close daily above EMA8, EMA13 and EMA21. Short-term bullish bias is now valid, active and confirmed.
All these are bullish signals saying that the market will move higher next.
What needs to happen for all this to become invalid?
NVDA would need to close daily below the last low.
No need to worry about short-term moves and noise. We are going up long-term.
The correction here reached more than 43%. Believe it or not, a 43% drop is a very strong drop. For the market to go lower, it would need to be the end of the company or worse. What need is there for a stock like this one, with a great product in huge demand, to drop by 80%, for what reason?
We are going up.
Namaste.

April 17, 2025 - Powell, Japan & TrumpHello everyone, it’s April 17, 2025. Yesterday’s U.S. trading was pure market carnage. Semiconductors ( NASDAQ:NVDA , NASDAQ:AMD , NASDAQ:ASML ) were steamrolled as AI chip bans to China kicked in and Trump dropped another tariff bomb, hiking duties to 245%. That wiped $200 billion off Nvidia alone.
In Chicago, Powell stoked the flames, warning tariffs will fuel inflation and choke growth, and insisted he’s in no rush to cut rates. The CME_MINI:NQ1! tumbled 3%, the CME_MINI:SOX1! lost 4.1%, and bond futures plunged.
This morning, U.S. futures are up about 0.75% on headlines that Trump’s talks with Japanese negotiators are “going very well,” sparking rallies across Asia: Nikkei +1%, Hong Kong +2.7%, Shanghai +1%. It seems even a whiff of détente with Japan sends everyone scrambling back into risk assets.
On commodities, BLACKBULL:WTI jumps to $63.35 amid fresh U.S. sanctions on Iran and OPEC output cuts; OANDA:XAUUSD rockets to $3,352 /oz; INDEX:BTCUSD hovers near $83,500.
Today watch the ECB’s rate cut, Powell’s next speech, Philly Fed and jobless claims before the Good Friday shutdown. With Trump’s erratic tariff theatrics and Powell’s warning of higher inflation and slower growth, volatility is set to reign supreme. Buckle up.
