OGN still lagging but looking greatOGNUSDT had the perfect retest on the breakout zone. Now slowly creeping higher and could easily keep pushing. Super clean chart
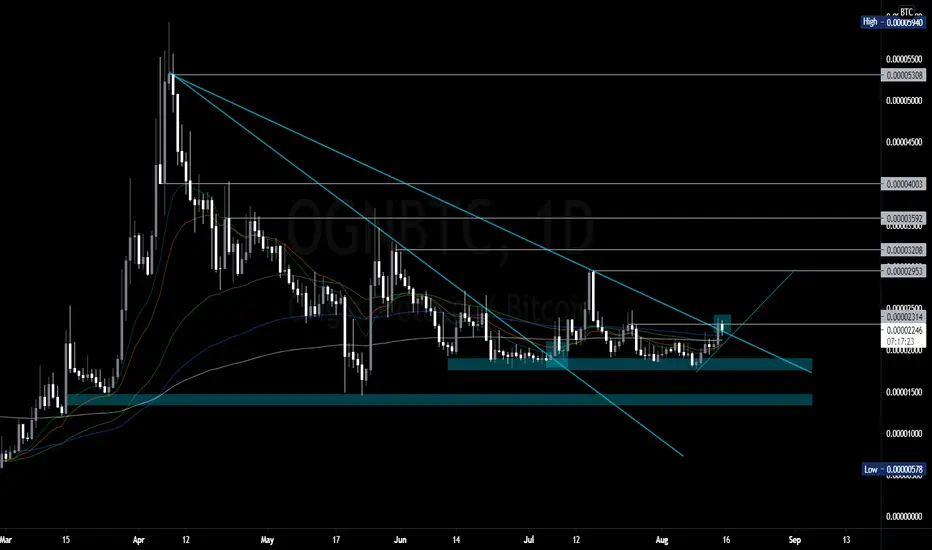
OGNBTC another massive accumulation zone and the chart is looking super hot. Clearly bottomed out and sellers are exhausted. Once the ATHs get broken the upside could accelerate.
Origin protocol could benefit from the NFT boom and is definitely a coin with huge potential and big backers.
OGN

OGNUSDT GONNA BULLISHOGNUSDT create cup & handle pattern! And now at trend support with hidden bullish divergence!


OGN/USDTBuying OGN here ,
Formed ADAM & EVE pattern on daily time frame , also EMA100 is flipped into support here .
Targets are :
- $1.32
- $1.59
- $1.76

OGN breakout resistance trendline !!!I just post my prediction
Always make your analaysis before a trade
not financial advice....

OGNUSDTHello to you all. Mars Signals team wishes you high profits at all times.
We are in a 4-hour time frame. As you can see, the price has moved upwards after hitting the support line again, and as long as the price is above the support line, it can touch our target. But in case of penetration into the support line, we consider more fall.
Warning: This is just a suggestion to you and we do not guarantee profits.
Wish you luck!

#OGNBTC [ ORIGIN PROTOCOL ]#OGNBTC
The chart looks juicy 👀 entry at the current price
We've detected the following: Golden Cross - Bollinger Breakout - Failure Swing - Trend Line Breakout
%1000 gain from here to $12resistances in the way of $12:
R1=$1.58
R2=$2.22
R3=$2.72 *main resistance*
R4=$4.45
R5=$7.82

OGNUSDT TECHNICAL ANALYSISGET NOW EARN AT LEAST 41%.We got some signals from @EngineeringRobo and the candles already break out down trend-line. Our next target may be $1.15 . Let's follow our chart together.
"NFA"

OGNUSDTHello to you all. Mars Signals team wishes you high profits at all times.
We are in a 4-hour time frame. As you can see, the price above our support line is fluctuating. As long as the price is above the line, it is an uptrend and can touch its target. However, in case of infiltration below the support line and stabilization of the fall to the next support line, we consider.
Warning: This is just a suggestion to you and we do not guarantee profits.
Wish you luck!


OGN|USDT💥Hey hey my friends👋
Looking to buy a small amount in this support zone and then more on a confirmed breakout of the trendline...
Solid project and solid NFT|DEFI news coming to OGN it should move nicely

SHIBA INU INCREASE TREND SIGNALHello trading friends,
SHIBA INU INCREASE TREND SIGNAL
See also the before target chart.
✅Like and subscribe to not miss a new idea!✅ Thanks

Possible Inverse Head & Shoulder on OGN/BTCPossible inverse Head & Shoulder on OGN/BTC on Daily, Weekly and Monthly. They all look same. What you guys think let me know.

OGNUSDTHello to you all. Mars Signals team wishes you high profits at all times.
We are in daily time frame. As you can see, after the fall and failure of the current support line, the price has been able to appear above the support line with a strong candlestick, and we intend the price to reach our target. In case of re-falling below the support line, we consider more fall.
Warning: This is just a suggestion to you and we do not guarantee profits.
Wish you luck!

OGN / USDT AnalysisOGN / USDT
OGN is on critical support
It still hold uptrend line since beginning of 2021
If bulls continue hold current support expecting pump soon
If uptrend line lost we go to re-accumulation zone again and price will consolidate for a long time
This idea just analysis for educational purposes
not a financial advice for buying or selling
Best of wishes

50 Weekly EMA at 33850. That price could decide a lot todayJust sharing the weekly graph for a better view of the situation. Check my comments on the daily graph underneath.

Global base scenario for OGNUSDT. Weekly chart.1 On the weekly chart, we can see a potential variation of the double bottom pattern usually called "Adam and Eve" (sharp bottom first, following by a gradual accumulation later). Typically, the accumulation occurs 2-3 times longer than the first bottom, so it can be assumed that the market accumulation will continue at least until the end of summer.
2 It is important to follow the global trend line (black line), as well as the moving average MA50 (green line). They are both now at the same level (the moving average is "hugging" the trend line at the moment), this is a strong support.
3 Taking into consideration the fact that, generally, accumulation occurs with low volatility, the width of the accumulation range will depend on the conditions of the whole crypto market, therefore, short-term price dives below the trend line would still provide excellent buying opportunities.
4 After the price breaks the accumulation zone, minimum potential price targets will be - $ 1.44; $ 1.81; $ 2.18 which are perfectly matched with the Fibonacci retracement levels.
Have a nice week everyone!


