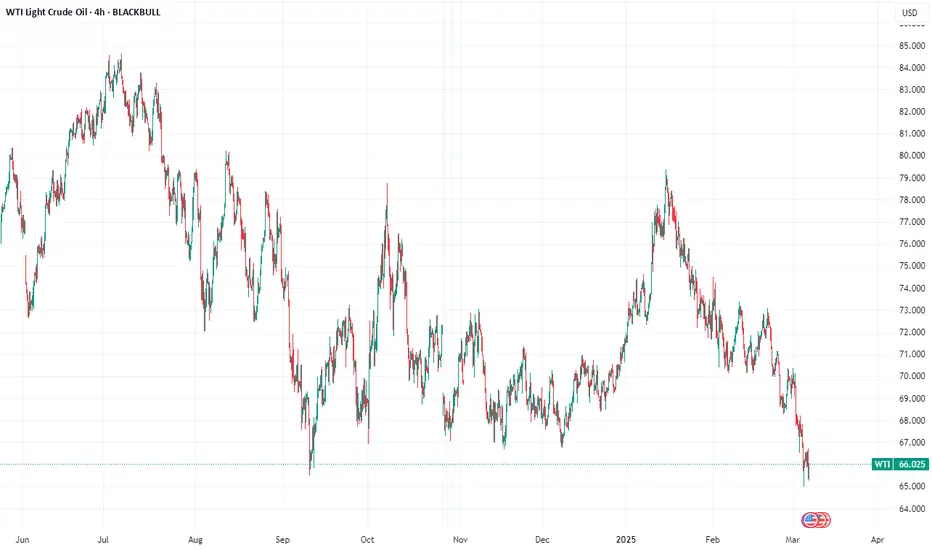
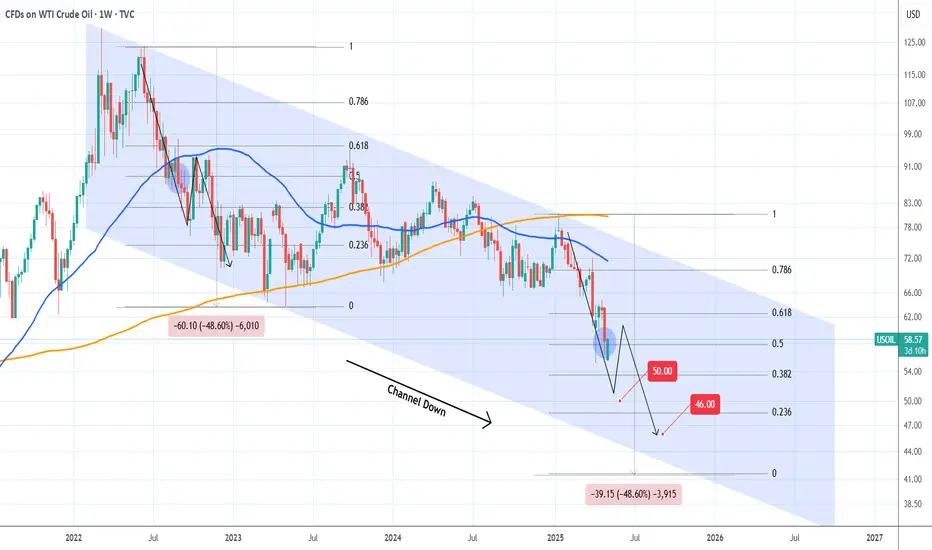
WTI OIL May be closer to $50 and below than a recovery.WTI Oil (USOIL) is having a strong green 1W candle but remains on a strong selling sequence since the January 13 2025 rejection on its 1W MA200 (orange trend-line). So far this is technically the Bearish Leg of the Channel Down that started after the March 07 2022 market top.
The Bearish Leg that was initiated then, declined by -48.60% so if the current one repeats this we are looking at prices close to $41 by the end of the year or beginning of 2026. Technically, as long as the 1W MA50 (blue trend-line) holds, the immediate Targets within a 3-month horizon are $50 and $46.
-------------------------------------------------------------------------------
** Please LIKE 👍, FOLLOW ✅, SHARE 🙌 and COMMENT ✍ if you enjoy this idea! Also share your ideas and charts in the comments section below! This is best way to keep it relevant, support us, keep the content here free and allow the idea to reach as many people as possible. **
-------------------------------------------------------------------------------
💸💸💸💸💸💸
👇 👇 👇 👇 👇 👇
Oilsignals
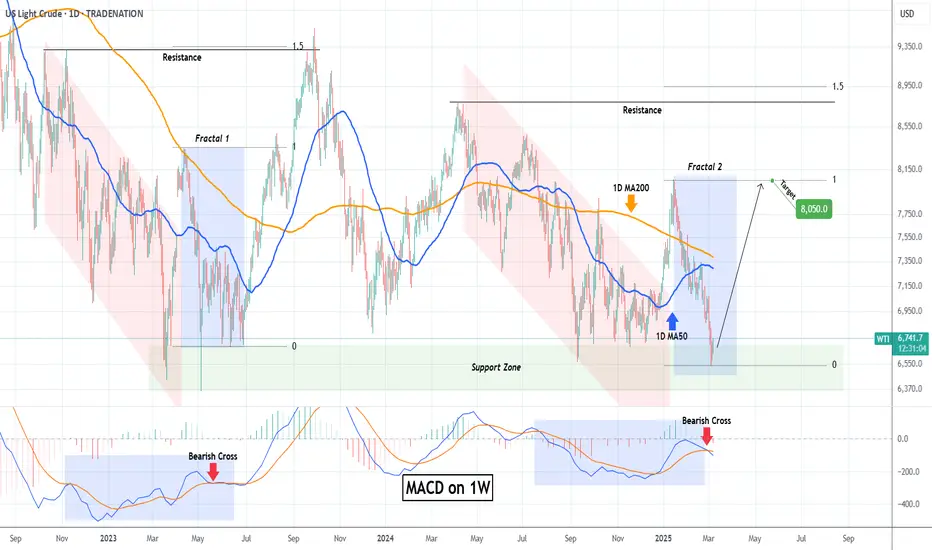
WTI OIL Bearish Cross confirming more selling ahead.WTI Oil (USOIL) has been trading within a Channel Down pattern since the December 06 2024 Low. The last Bearish Leg started on a 1D MA200 (orange trend-line) rejection and was confirmed with a 1D MACD Bearish Cross 3 days after.
At the moment we have had a 1D MA50 (blue trend-line) rejection and today we will complete a new 1D MACD Bearish Cross. As a result, we almost have a new sell confirmation. Once completed, sell and target $53.50 (-19% from the point of the rejection).
-------------------------------------------------------------------------------
** Please LIKE 👍, FOLLOW ✅, SHARE 🙌 and COMMENT ✍ if you enjoy this idea! Also share your ideas and charts in the comments section below! This is best way to keep it relevant, support us, keep the content here free and allow the idea to reach as many people as possible. **
-------------------------------------------------------------------------------
Disclosure: I am part of Trade Nation's Influencer program and receive a monthly fee for using their TradingView charts in my analysis.
💸💸💸💸💸💸
👇 👇 👇 👇 👇 👇

Crude oil---sell near 63.00, target 60.00-58.00Crude oil market analysis:
The recent crude oil daily line has also begun to decline. Yesterday, the daily line closed negative, and the selling began to decline. Today's idea is to consider selling opportunities near the rebound of 63.00. Crude oil continues to be bearish. No matter the fundamentals or technical aspects, there is no sign of bullishness. Today, crude oil is expected to fluctuate and fall. Don't chase the rebound. We are considering it. In addition, crude oil will also close the monthly line. Pay attention to its monthly line.
Fundamental analysis:
This week is a data week. Starting from Wednesday, big data will be released one by one. In addition, continue to pay attention to the situation of the US dollar and the changes in tariff policies.
Operation suggestions:
Crude oil---sell near 63.00, target 60.00-58.00

Crude oil------sell near 64.30, target 60.00-58.00Crude oil market analysis:
Crude oil has been fluctuating recently. Today, we focus on the rhythm and range of its fluctuations. The suppression near 65.30 is successful. The selling trend is downward. Let's sell on the rebound today. Pay attention to the suppression near 64.00. There is still room for selling. The recent data and tariff war on crude oil have not had a big impact on it, so it has been hovering.
Crude oil market analysis:
Crude oil has been fluctuating recently. Today, we focus on the rhythm and range of its fluctuations. The suppression near 65.30 is successful. The selling trend is downward. Let's sell on the rebound today. Pay attention to the suppression near 64.00. There is still room for selling. The recent data and tariff war on crude oil have not had a big impact on it, so it has been hovering.
Operational suggestions
Crude oil------sell near 64.30, target 60.00-58.00

OIL...SHORT BLACKBULL:WTI
is approaching the key resistance zone at .
I'm watching closely for a valid reaction before considering any position.
***If the level breaks and price retests it successfully, I may consider a counter-directional setup.

Crude oil---sell near 64.00, target 63.00-62.00Crude oil market analysis:
Recently, crude oil has been running up. Yesterday, the daily line had a technical retracement under the pressure of 65.00. Today, we are still bearish. Let's continue to sell when it rebounds. There is still a lot of room for crude oil to fall. Today's crude oil rebounded near 64.00 and sold. If it breaks below 60.00, it will open up a new space for a big drop. The recent data and fundamentals of crude oil are suppressing it. Buy today and expect a big rebound.
Operational suggestions:
Crude oil---sell near 64.00, target 63.00-62.00

WTI OIL Oversold rebound at the bottom of 7-month Channel Down.WTI Oil (USOIL) hit last week the bottom (Lower Lows trend-line) of the 7-month Channel Down while its 1D RSI turned oversold (<30.00), the lowest it's been since March 2020 and the COVID crash.
Naturally, the price rebounded but still hasn't even tested the 1D MA50 (blue trend-line), which indicates that it remains a strong medium-term buy opportunity. With the previous Lower Low almost reaching the 0.786 Fibonacci retracement level, we expect to see at least $72.50 in the medium-term.
-------------------------------------------------------------------------------
** Please LIKE 👍, FOLLOW ✅, SHARE 🙌 and COMMENT ✍ if you enjoy this idea! Also share your ideas and charts in the comments section below! This is best way to keep it relevant, support us, keep the content here free and allow the idea to reach as many people as possible. **
-------------------------------------------------------------------------------
Disclosure: I am part of Trade Nation's Influencer program and receive a monthly fee for using their TradingView charts in my analysis.
💸💸💸💸💸💸
👇 👇 👇 👇 👇 👇

Crude Oil Found Support: What's Next?FenzoFx—Crude oil tested the $58.9 level as support and bounced back from it. The primary trend is bearish; therefore, it will likely resume if the price closes and stabilizes below this support.
If this scenario unfolds, the next bearish target could be the $55.15 support level.
>>> Win $160.0 prize every week by joining FenzoFx contest.

WTI OIL Buy opportunity or more meltdown coming?WTI Oil (USOIL) has been trading within a long-term Channel Down since the September 25 2023 High and the recent Trade War sell-off helped the price drop towards the pattern's bottom (Lower Lows trend-line) much quicker.
Technically this has been a 1W MA50 (blue trend-line) rejection, previously a Lower High rejection on the 1W MA200 (orange trend-line). Notice how the 1W RSI has also been trading within a Channel Down of its own, with the indicator near its bottom as well.
Being more than -31% down (more than the -29% of the first Bearish Leg), we can technically claim that this is a solid level for a medium-term buy again. The previous Bullish Leg marginally exceeded the 0.618 Fibonacci retracement level before the Lower High. As a result, our new Target is $70.00.
-------------------------------------------------------------------------------
** Please LIKE 👍, FOLLOW ✅, SHARE 🙌 and COMMENT ✍ if you enjoy this idea! Also share your ideas and charts in the comments section below! This is best way to keep it relevant, support us, keep the content here free and allow the idea to reach as many people as possible. **
-------------------------------------------------------------------------------
Disclosure: I am part of Trade Nation's Influencer program and receive a monthly fee for using their TradingView charts in my analysis.
💸💸💸💸💸💸
👇 👇 👇 👇 👇 👇

Buy oil! Target 63-65!Crude oil is currently in a short position overall, and the rebound momentum is relatively weak. However, in the short-term structure, oil has shown obvious signs of stopping the decline, and the support of the 60-59 area below is still valid.
After hitting the low point of 58.9, oil began to rebound, and the rebound low gradually shifted upward. At present, oil holds the support near 60, and is expected to build a W-bottom structure in the short-term structure, which is conducive to further rebound of oil prices.
Therefore, in terms of short-term trading, you can try to go long on crude oil in the 60.5-59.5 area, and the rebound target will first look at 63, followed by 65
The trading strategy verification accuracy rate is more than 90%; one step ahead, exclusive access to trading strategies and real-time trading settings

Crude oil-----sell near 63.70, target 62.00-60.00Crude oil market analysis:
We continue to be bearish on crude oil today, and continue to sell on rebounds. The position of 63.80, which was pulled up last night, is today's major suppression position. This position is a selling opportunity. Crude oil has not broken the previous low point, but it will have a big bottom shock and a big repair after the data is over. Today's crude oil will wait for the opportunity to sell. In addition, the recent data on crude oil also suppresses it. Crude oil has not effectively stood on the major pressure before, and the short-term rebound is just a rebound. The weekly trend is still bearish.
Fundamental analysis:
The US tariffs on the world are still brewing, which has also led to a sharp drop in global stock markets, and the market is not optimistic about expectations. Later this week, we will focus on the heavyweight CPI data.
Operation suggestions:
Crude oil-----sell near 63.70, target 62.00-60.00
Crude Oil Technical AnalysisFenzoFx—Crude Oil trades are bullish, stabilizing above $70.60. Stochastic signals overbought. A correction toward the 50-SMA is likely before the uptrend resumes.
Trade Crude Oil without Swap Charges at FenzoFx.

WTI OIL Approaching a potential rejection level.Our last short-term analysis (March 18, see chart below) on WTI Oil (USOIL) hit the $70.00 Target and is currently extending the uptrend:
We believe however that this uptrend may be coming to a temporary end as not only does it approach the 1D MA200 (orange trend-line) that has been intact since February 03, but also the 73.40 Symmetrical Resistance that kick started the -7.70% September 24 2024 rejection.
As you can this this is also where the 1D RSI 67.00 Resistance is, which has also caused 2 rejections.
Based on that, we will wait for a short on the 1D MA200 to target $68.00.
-------------------------------------------------------------------------------
** Please LIKE 👍, FOLLOW ✅, SHARE 🙌 and COMMENT ✍ if you enjoy this idea! Also share your ideas and charts in the comments section below! This is best way to keep it relevant, support us, keep the content here free and allow the idea to reach as many people as possible. **
-------------------------------------------------------------------------------
💸💸💸💸💸💸
👇 👇 👇 👇 👇 👇

CRUDE OIL (WTI): More Growth Ahead
After a 4-days long accumulation on a key daily resistance,
WTI Oil bounced strongly on Monday, violating a key daily resistance.
The market is likely to continue advancing.
Next resistance is 72.5
❤️Please, support my work with like, thank you!❤️

USOil Sell 70.000Crude oil has been fluctuating and rising recently, reaching a three-week high. From a fundamental perspective:
Supply: The United States has intensified its energy sanctions against Iran. Attacks on Saudi facilities have affected their performance. The OPEC+ will gradually lift the voluntary production cuts starting from April and may increase production for the second time in May. The 30-day ceasefire agreement between Russia and Ukraine has not been effectively implemented in substance. However, recently, the United States, Russia, and Ukraine have reached some consensus on Black Sea navigation and the protection of energy facilities.
Inventory: According to API data, for the week ending March 25, U.S. crude oil inventories dropped significantly by nearly 9 million barrels. However, commercial crude oil inventories have been increasing continuously for several weeks, and the overall inventory remains at a high level.
Geopolitics: The U.S. airstrikes against the Houthi armed group in Yemen and Israel's military operations in the Gaza Strip have heightened concerns about the disruption of crude oil supplies in the Middle East. The United States' continuous strengthening of sanctions against Iran and Venezuela also includes a plan to impose a 25% tariff on countries importing Venezuelan crude oil.
Production Increase Pressure: The daily supply increments of non-OPEC countries (such as the United States and Brazil) far exceed the global demand growth rate, which has long-term downward pressure on the oil price center.
💎💎💎 USOIL 💎💎💎
🎁 Sell@70.000 - 70.200
🎁 TP 68.5 68.0 67.5
The market has been extremely volatile lately. If you can't figure out the market's direction, you'll only be a cash dispenser for others. If you also want to succeed,Follow the link below to get my daily strategy updates

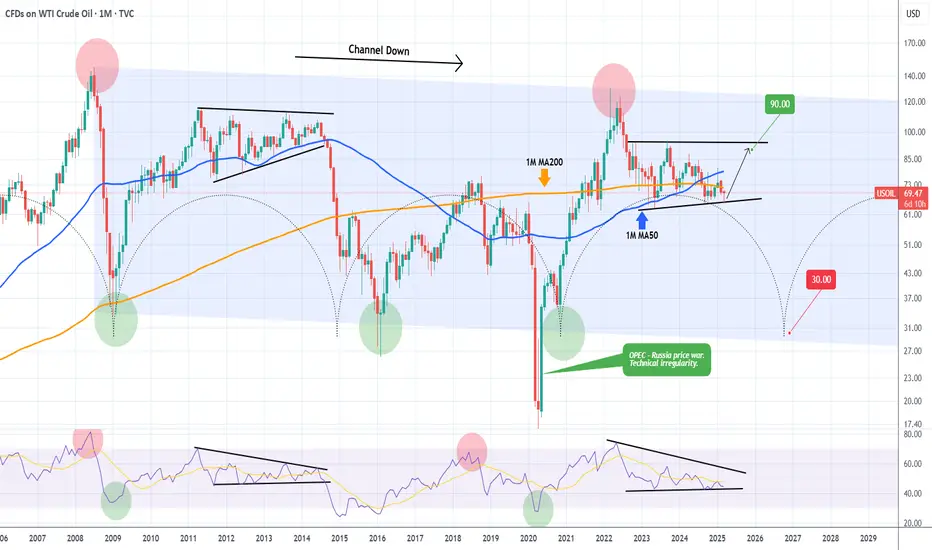
WTI OIL Ultimate long-term guide.WTI Oil (USOIL) has a tendency, like a number of key traditional assets, to follow long-term Cycles. Market psychology more times than not makes investors and the market behave in similar ways (euphoria buying, panic selling) given the same market conditions. Fundamentals and catalysts can often be used as reasons and excuses to confirm the technical trends and long-term Cycles.
Oil is no different and on this 1M time-frame analysis we see why. The dominant multi-year pattern is a Channel Down and it has started on the July 2008 All Time High (ATH). Right now it appears that we are inside a Wedge pattern similar to 2011 - 2014 and more specifically on the final Bullish Leg towards the top.
The 1M RSI sequence among those two fractals is identical so based on all these parameters we believe WTI will test $90.00 by late 2025 - early 2026 and if rejected, start a brutal long-term sell-off towards the bottom of the Channel Down and the 35.00 - 30.00 range by late 2026 as the Time Cycles suggest.
-------------------------------------------------------------------------------
** Please LIKE 👍, FOLLOW ✅, SHARE 🙌 and COMMENT ✍ if you enjoy this idea! Also share your ideas and charts in the comments section below! This is best way to keep it relevant, support us, keep the content here free and allow the idea to reach as many people as possible. **
-------------------------------------------------------------------------------
💸💸💸💸💸💸
👇 👇 👇 👇 👇 👇
OIL Today's strategyIn the medium term, because the lower edge of the channel has been broken, the short force is relatively dominant, and crude oil may face certain downward pressure.
However, today's crude oil prices are affected by tightening expectations on the supply side, geopolitics and other factors, and the short-term trend is strong, and there is a certain upward momentum on the technical side. Investors need to pay close attention to the breakout of key support and resistance levels.
OIL Today's strategy
buy@67.5-68
tp:69-69.5
We share various trading signals every day with over 90% accuracy
Fans who follow us can get high rewards every day
If you want stable income, you can contact me

OIL Today's strategyIn the short term, there is a simultaneous advance of the long positions in crude oil. The price has tested the vicinity of $68.5 several times but encountered resistance. Moreover, after reaching around $65.2 at the lower level, it rebounded rapidly. The market still needs further testing. In the short term, it is advisable to sell high and buy low within the range of $68.5 to $65.2.
OIL Today's strategy
sell@67.5-67.9
buy:65.7-66.2
If you don't know how to do it, you can refer to my transaction.

WTI OIL turned the 4H MA50 into Support and aiming higher.WTI Oil (USOIL) has broken above the bearish trend of the former Lower Highs and a Channel Up emerged. The 4H MA50 (blue trend-line) broke for the first time in almost a month and has now been turned into Support.
As long as this holds, we expect Oil to target the 4H MA200 (orange trend-line) at $70.
-------------------------------------------------------------------------------
** Please LIKE 👍, FOLLOW ✅, SHARE 🙌 and COMMENT ✍ if you enjoy this idea! Also share your ideas and charts in the comments section below! This is best way to keep it relevant, support us, keep the content here free and allow the idea to reach as many people as possible. **
-------------------------------------------------------------------------------
Disclosure: I am part of Trade Nation's Influencer program and receive a monthly fee for using their TradingView charts in my analysis.
💸💸💸💸💸💸
👇 👇 👇 👇 👇 👇

BRENT SELL/SHORTBy utilizing Fibonacci retracement levels, historical patterns, , we can formulate a hypothesis that the market might follow a similar trajectory if bearish sentiment prevails.

WTI OIL Massive 4-year Support hit. Bullish reversal ahead??WTI Oil (USOIL) hit on last week's 1W candle the 1M MA100 (red trend-line), a massive long-term Support level that has been holding since the week of April 26 2021, i.e. almost 4 years.
At the same time, the price entered the 2-year Support Zone, which has produced all major Bullish Phases (green Rectangles) during this time span. The last one got rejected twice on the 1W MA200 (orange trend-line).
Given the fact that this most recent rejection formed the current 2-month Bearish Phase (red Rectangle), which even based on 1W RSI terms, is similar to all previous Bearish Phases that found Support on the 2-year Support Zone, we have a massive long-term Support Cluster in front of us.
Naturally, until the 1W MA200 breaks, that should be the first Target of any buy attempts. As a result, we expect $80.00 to be tested by June 2025 the earliest.
-------------------------------------------------------------------------------
** Please LIKE 👍, FOLLOW ✅, SHARE 🙌 and COMMENT ✍ if you enjoy this idea! Also share your ideas and charts in the comments section below! This is best way to keep it relevant, support us, keep the content here free and allow the idea to reach as many people as possible. **
-------------------------------------------------------------------------------
Disclosure: I am part of Trade Nation's Influencer program and receive a monthly fee for using their TradingView charts in my analysis.
💸💸💸💸💸💸
👇 👇 👇 👇 👇 👇

WTI OIL hit its 2-year Support. Major rebound possible.WTI Oil (USOIL) didn't fail us on our last bearish idea (February 20, see chart below), where we called the 1D MA50 rejection:
The decline didn't just hit our $69.00 Target but also broke below the medium-term Channel Up and entered the 2-year Support Zone.
The long-term dynamics should gradually start emerging now and the principle parameter is that every time this Support Zone gets hit, WTI starts strong medium-term rallies.
Technically (even on 1W MACD terms), the decline since mid January is very similar with the one of mid April 2023. Both were produced after another Support Zone rebound and before that a long-term Channel Down (red) preceded them.
As a result, we expect a strong rebound for at least the next 2 months, which (as in the case of Fractal 1) should initially target at least January's High at $80.50.
-------------------------------------------------------------------------------
** Please LIKE 👍, FOLLOW ✅, SHARE 🙌 and COMMENT ✍ if you enjoy this idea! Also share your ideas and charts in the comments section below! This is best way to keep it relevant, support us, keep the content here free and allow the idea to reach as many people as possible. **
-------------------------------------------------------------------------------
Disclosure: I am part of Trade Nation's Influencer program and receive a monthly fee for using their TradingView charts in my analysis.
💸💸💸💸💸💸
👇 👇 👇 👇 👇 👇
Crude Oil Prices: Double-Edged Sword for Indian Marketers
The global crude oil market, a volatile beast, dictates the energy landscape for nations worldwide.1 For India, a nation heavily reliant on oil imports, the fluctuations in crude oil prices carry significant implications.2 While a dip in crude oil prices might seem like a welcome relief, especially for consumers, it presents a complex and often challenging scenario for oil marketing companies (OMCs) operating within the Indian market. This seemingly beneficial drop in prices acts as a double-edged sword, bringing with it a unique set of complexities that stem from market dynamics, government policies, and the intrinsic characteristics of the oil and gas sector.3
The initial and seemingly positive impact of lower crude oil prices is the potential for reduced import costs.4 For a country like India, where a substantial portion of its energy needs are met through imports, this can lead to a decrease in the overall expenditure on crude oil. This reduction can, in turn, alleviate pressure on the nation's current account deficit and theoretically translate to lower fuel prices for consumers. However, this potential benefit is often overshadowed by the ever-present threat of government intervention through excise duty hikes.
Governments, seeking to bolster their revenue, often capitalize on falling crude oil prices by increasing excise duties on petrol and diesel.5 This strategic move allows them to capture a significant portion of the savings that would otherwise be passed on to consumers. For OMCs, this translates to a reduction in the potential for increased margins. While they still benefit from reduced raw material expenses, the extent of the gain is substantially diminished. This delicate dance between market forces and government policies creates a complex environment for OMCs to navigate.
Furthermore, the expectation of price cuts for end consumers becomes a significant challenge for OMCs. Consumers naturally anticipate a corresponding reduction in fuel prices when crude oil prices decline. However, OMCs must carefully balance this expectation with the need to maintain their financial health. Rapid and substantial price cuts can strain their profitability, especially when coupled with excise duty adjustments. This balancing act requires a delicate approach, as OMCs must ensure their financial stability while remaining responsive to consumer demands.
Beyond the immediate impact on OMCs, lower crude oil prices pose a significant challenge to the upstream oil and gas sector. Upstream companies, involved in exploration and production, are directly affected by the decline in realized prices for their crude oil. This can lead to reduced profitability, delayed or cancelled investment projects, and even financial distress for some companies. The economic viability of many oil and gas fields is contingent on a certain price threshold. When prices fall below this level, production becomes less attractive, potentially hindering future energy security.
The impact on the gas sector is particularly noteworthy. Natural gas economics are often intertwined with crude oil prices, with gas prices sometimes linked to oil price benchmarks.6 A decline in crude oil prices can thus indirectly affect gas prices, making gas production and distribution less profitable. This can have broader implications for the energy sector, as natural gas is increasingly seen as a cleaner alternative to other fossil fuels.7 Reduced investment in gas infrastructure and production can hinder the transition towards a more sustainable energy mix.
Moreover, the volatility associated with fluctuating crude oil prices creates uncertainty for OMCs and the entire energy sector.8 Long-term planning and investment decisions become more difficult when the market is subject to rapid and unpredictable price swings. This uncertainty can deter investment in new projects and hinder the development of a stable and reliable energy supply. This volatility necessitates a robust and adaptable strategy for OMCs to navigate the unpredictable market.
From a macroeconomic perspective, while lower crude prices can potentially stimulate economic activity by reducing fuel costs for businesses and consumers, the potential for reduced government revenue due to lower oil prices (if excise duties are not increased) must be considered. In a country like India, where government revenue is crucial for funding infrastructure projects and social programs, a significant decline in oil-related revenue can have far-reaching consequences. This highlights the need for a balanced approach to fiscal policy, ensuring that government revenue remains stable while providing relief to consumers.
The challenges posed by lower crude oil prices highlight the need for a balanced and nuanced approach to energy policy. Governments must strike a delicate balance between providing relief to consumers, maintaining fiscal stability, and supporting the long-term health of the oil and gas sector. This requires careful consideration of excise duty adjustments, pricing mechanisms, and investment incentives. A coherent and forward-looking energy policy is essential to navigate the complexities of the global crude oil market and ensure the nation's energy security.
In conclusion, while lower crude oil prices may appear to be a boon, they present a complex set of challenges for OMCs and the broader Indian oil and gas sector. The potential for excise duty hikes, concerns about price cuts, and the impact on upstream realisations and gas economics create a double-edged sword scenario. Navigating this complex landscape requires careful policy decisions and a comprehensive understanding of the intricate dynamics of the global energy market. OMCs must remain adaptable and resilient, while governments must implement policies that balance consumer needs with fiscal stability and long-term energy security.