WTI (US OIL) Potential Bearish Crab Pattern In Play On 1 Hr TFThis is by no means a trade signal. even if the pattern completes you can enter at your own risk. i will not simply enter the trade even if the pattern completes. there are some other technical analysis needs to be done before simply just entering the trade. But hey anyways if there are any updates i will be updating here accordingly.
Opec

WTI (US OIL) At 61.8 Previous Monthly Swing High! At One time OIL was crashing and burning like a Meteoroid and This past number of months it has been recovering quite well it would suggest. However in the path of OIL recovery there lies a strong resistance of 74, which not only happens to be a crucial support but also a 61.8 golden ratio retracement of the pervious Monthly swing high. Refer to the image below (Monthly charts). A Short opportunity looks great and the probability is also in our favor however i feel the correction will be a minor one and the price might test the crucial 55 level before resuming the uptrend
On the Weekly chart a channel has been developing for quite some time. If the prices are likely to reverse then the price must break the channel and the EMA50 for this to happen. A potential short opportunity can be taken when the price retests the EMA 50.
To confirm this potential break to the downside the daily chart also displays a dynamic trendline that had been acting as resistance and now acting as support since the price broke up. A potential break and retest of the trend line would add to the many confluence factors that the OIL is about to slightly reverse before resuming its Uptrend in the near future
So in short, i am waiting for the channel violation on the weekly charts and i will base any possible entry from the daily chart. Oil is a commodity and from my experience technical analysis itself is not enough to study commodities as they are strongly driven by supply and demand i.e fundamental news. So overall before going short on this pair its advised to read the current and future fundamentals affecting the OIL market
Please GIVE ME A LIKE IF YOU LIKE THE ANALYSIS AND FOLLOW ME IF YOU LIKE TO RECEIVE MORE ANALYSIS. thank you

UKOIL breakout - USA Oil inventories in the spotlightHello traders,
In spite of the OPEC Oil production boost estimated in 1 Mn daily barrels, UKOIL has been soaring aproaching 3,5 years highs close to USD 80; since the production supply increase was expected over 1 Mn and the real supply boost might finally be around 600k daily barrels.
Now the price is retreating from USD 79-80 level, after being unable to break those level in recent months.
UKOIL is facing a clearly medium term bearish momentum since:
- There is a bearish RSI divergence.
- USD 79-80 range unable to be broken.
- Critical technical breakout level.
- OPEC boosted production slightly.
Today we have the USA OIL inventories market mover.
Enjoy your trading!
Adrian Lopez de Armentia - EFA

Crude oil breaks the downtrend line, or is it a false break? Crude oil continues to fall after we saw a squeeze over $70, the question is how low will it go? Today we look at the technicals and so far, still more downside to go. Combine with a monthly candle, the break of the downtrend line may be a false break, or it may not. Only time will tell...
Happy Trading, folks!
Cheers.
Crude Deal coupled with Technicals to take Prices Lower.Expecting a double top on double divergence leading to an "M" pattern taking oil back to missed monthly pivot.
Saudis have indicated that their crude production will increase substantially come August, and it will be not by the "hundreds of thousands, not tens of thousands, of barrels.(1)"
1.) Reed, Stanley, "Saudis, Saying They Heard Price Complaints, Are Raising Oil Production." New York Times, June 23, 2018

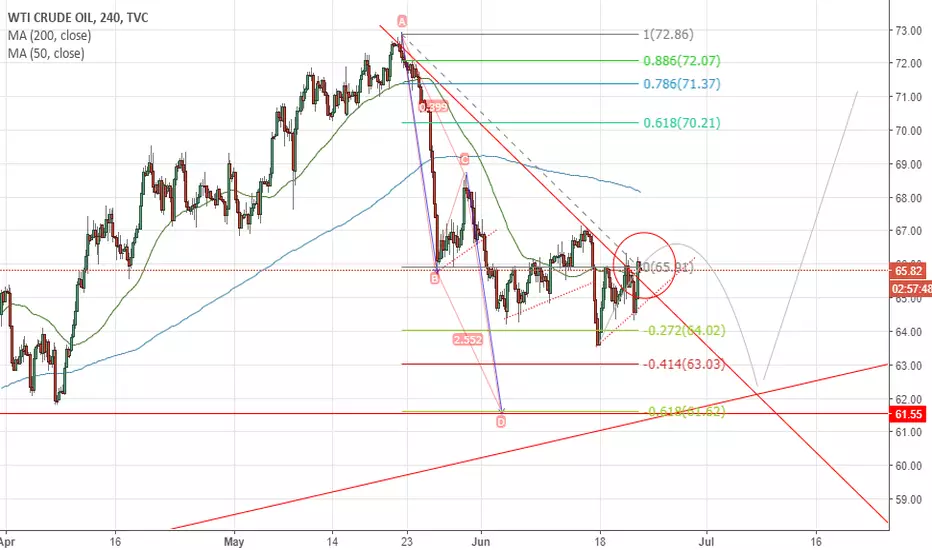
A Good Day To Trade WTI Crude Oil - EIA Report & OPEC Meeting UpI'm speculating that the inventory draw by 2.1 million is already priced in. Therefore, the oil prices may drop on the release of EIA report. That being said, I will be looking to stay bullish above $65.02 to target $66 before the release of news today. All the best and stay tuned for updates. Keep following!

USOIL Short - New Deals New Prices "At the meeting Vienna, Opec members will debate whether to lift the 18-month-old production cap to stabilize prices"
All information on chart.
Comment your questions.

OPEC+: the beginning of the endThe growth of oil from $ 30 to $ 70 is the merit of OPEC+ (an agreement between a few key oil producers on the cumulative reduction in oil production by 1.8 million barrels per day). The main role in this agreement was played by Saudi Arabia and Russia. The result of OPEC + was the elimination of surpluses from the oil market (world inventories were reduced to the level of a five-year average).
But recently there have been many alarming signals for oil buyers: the oil market participants are increasingly asking: will the OPEC+ deal be extended for 2019? In addition, Russia and Saudi Arabia are increasing production, which analysts interpret as an indirect refusal from OPEC + and in fact the end of this deal.
According to the Wall Street Journal, Saudi Arabia last month increased its oil production by more than 100,000 barrels per day and plans to increase it by at least 100,000 b/d this month. At the same time, according to the consulting company Kpler, which tracks the movement of oil tankers leaving Saudi Arabia, the country has increased oil exports by 300,000 b / d since mid-May. At the same time Russia calls for increasing the quotas for oil production.
As can be seen, conversations about the soon collapse of OPEC + do not appear in an empty place.
Given that US oil production has almost reached 11 million barrels per day, there are reasons to believe that the abandonment of OPEC + and the start of a new market race for a market share will lead to the formation of a medium-term downward trend in oil prices. Now oil is close to the long-term highs, so we consider current prices as extremely attractive for opening mid-term short positions with targets at the bottom of $ 40.
If we talk about more local purposes, for example, this week, then sales in the $ 66 area with lower-end targets of $ 60 also look like an excellent trading opportunity (case of WTI oil). Especially considering that oil reserves in the US have recently increased and exert additional downward pressure on quotes of "black gold".

Top 3 Things to Know about Crude Oil TodayI’m planning to stay bearish below $65.75 to target $65 and $64, whereas my buying limit is set at $63.85. Good luck!
Keep following us for more updates!

Oil Short term correction?....we shall seeLooking at it from a technical analysis, if the price of Oil makes that "double dip" (W) with the RSI or MACD having a higher low on the second dip, we may be looking at the price of oil potentially breaking out of this uptrend channel and creating higher highs. Ofcourse, the fundementals of an increase in US production and from OPEC may drive prices below the uptrend channel for lower lows.

USOIL Bulls Eyeing For Next Resistance?Good day Traders. As of today, USOil rallied after reports citing that Saudi Arabia, Other OPEC and non-OPEC allies would extend on cutting oil supplies until the end of 2018 however were ready to make gradual adjustments in the event of any supply shortage. From my recent post, USOil is still in a clear uptrend and price was sitting off to key support with yesterday's Doji Indecision candle still waiting for long confirmation entry. Now, Bull's are eyeing next psychological price resistance $72.84 if today's EIA Crude Oil Stockpile report declines than expected.
for more update, kindly visit my blog:
livetotradefx.blogspot.com

US Oil Did Slide Towards Near SupportIn relation to my previous post, the market did correct and slide towards near term support $69.55 following OPEC and Russia's statement to meet shortfall in Supply from Venezuela and Iran.

Chart pattern signal shows price of Crude Oil to go higher.Long term view. The chart patterns in the ellipses are occurring twice in the last 9 years, first in 2009, and now again from end of December 2017 to present day, and as we see that cycles repeat, expectations are the price of Crude Oil to go even higher against $80 - $100 per bbl. And it is not the technical analysis that appoints to this scenario happening, but also yesterday we got very clear vision for the future price directly from Saudi Arabia, officials stated Saudi Arabia needs price of oil to get to $100, and considering they have the power to adjust the production output in partnership with OPEC members and also non OPEC members in accordance with the demand and risks occurring around the oil markets, we can expect positive months for the oil markets to come. As the price makes correction to the downside buyers are emerging on levels below $65 and $63. As we expect that the price will rise, it has probability of going up gradually with resistances occurring close to these levels: $70, $72, $75, $80, $92, $96.
Link for a video analysis for the Oil.
www.youtube.com
Link for the OPEC's price hawk vision.
www.reuters.com
Risk warning!
---------------------------------------------------
Trading carries a high level of risk to your capital and may result in losses that exceed your initial deposit. You should first be aware of the risk and know what you do before you proceed with trading. Supplied information is not advice.

USOIL/NATURAL GASEveryone is very bearish on natural gas because of the rising production coming out of Canada, and the United States. Although natural gas is bearish to moderate in price action, I believe that over time it will play a more pivotal role in the energy system than crude will. Natural Gas is holding up fine, and the price action in 2012 may prove to have been a pivotal time in the future.

Crude Oil at resistance. Crude Oil at resistance level, going above 61.535 opens the upside to 63.60/64. Buy on daily close above 61.535. Attention to fundamentals, inventories, and OPEC before decision is made.

WTI- The Breakdown of USOILFOREXCOM:WTIUSD COT Reports Show Bearish Price Forcasting in the Near Future. Will Crude Break Below the $60 handle shortly? Techincals Suggest yes as well


Woodside Petroleum shareprice surge?With OPEC looking likely to raise the official oil price as oil fracking in the U.S starts to slow & the Saudis cutting oil prices, a surge in the price of most oil & petroleum companies is almost guaranteed. But the question is "how soon?". Looking at the current price of WPL and past chart patterns show that the price surge could be very, very soon.


Hedge funds don't buy into OPEC cutsUS Dollar
Greenback gradually turns into an offensive although a buildup of longs on US currency looks quite cautious showed a pullback during the Asian session. Futures for the dollar index are planning a march to the level of 93.50 thanks to the efforts of Republicans to pass the fiscal bill and slightly biased in the positive side US data. Macro figures shows steady pickup in US manufacturing sector and some subsidence of the consumer sector, but the first is more legible in tracking economic effects, demonstrating the sustainability of the country's economic growth.
Republicans of the Senate and the House of Representatives have to reconcile their versions of the tax reform and the market believes that it won’t be a problem. A large part of tax cuts intended for corporations is postponed until 2019, so investors are increasingly skeptical about stimulating effect of the reform. For example, Goldman Sachs considered that the continuation of global recovery next year will lead to capital flows into emerging markets with higher yields that will become a hard test for the dollar. To offset an appeal of foreign markets, the Fed will have to accelerate the rate of increase in borrowing costs, but inflation below the target level of two percent ties hands to the regulator. According to Trump's plan, the dollar should be cheaper to stimulate exports, making US products abroad cheaper. Therefore, in long-term rally of the dollar there is more and more doubt and investors are in no hurry to price into the dollar a more aggressive Fed next year.
US trade deficit in October was the highest in last nine months due to rising oil prices, as well as a failure in competitiveness with major trading partners - China and Mexico. And this is despite the fact that US exports to these two countries have reached a peak of three years. Donald Trump has more and more arguments to enforce his protectionist initiatives, which is a time bomb in US political relations with trading partners.
According to the report of US government, foreign trade accounted for 0.43 percentage points from the growth of 3.3 percent of GDP in the third quarter. According to the Trump administration, eliminating the skew in trade together with tax breaks can bring the rate of GDP growth to a stable trajectory of 3%.
British pound
The British currency has sharply lost a bullish aim, as news on progress of talks on the EU deal last week was again replaced by reports of sticky dissent. Moreover, on Wednesday the British TV channel reported that the police could prevent an attempt on Prime Minister Teresa May, which indicates that the course taken by the conservatives to find trade-off with the European Union can have a strong opposition. Bearish pressure led the GBPUSD pair to the level of 1.3370, and a breakdown at 1.3350 would likely signal a signal for further decline.
The oil market
Optimism after OPEC has come to naught and now investors are shifting focus to the dynamics of American production, which has already reached parity with Saudi Arabia and Russia. The emergence of a third major player in the market that does not contact OPEC creates depressing prospects for a global supply, so investors are trying to analyze the demand side for positioning. Brent and WTI lost more than half a percent on Wednesday and are likely to find support somewhat lower before investors consider long positions. The API report released on Tuesday showed mixed dynamics - crude oil stocks fell sharply, while reserves of gasoline and distillate rose, which indirectly speaks of saturation of the domestic market after a shortage due to natural disasters.
Arthur Idiatulin


Brent OIL - The fundamentals..With the fundamentals looking bullish, I am looking at a price rally reaching $70.00 by the end of Q1 2018 or mid Q1 2018
