NQ1 - Did Bitcoin Just Call The Top ?NQ1
Has slumped since week open and printing and Evening Star candle pattern on the 4 hour chart.
So considering that it is in the retracement Golden Window (0.618 - 0.786) and also that Bitcoin is capitulating; this might just be the top here 👍.
Not advice
Community ideas

#USDCAD: Two Major Buying Zones, Patience Pays! As previously analysed, USDCAD is expected to decline towards our predetermined entry point. We anticipate a bearish US Dollar for the remainder of the week, which will ultimately lead USDCAD to reach the entry zone. Three distinct target areas exist, collectively worth over 1100 pips. Each entry point, stop loss, and take profit is clearly defined.
We wish you the best of luck and safe trading.
Thank you for your support.
If you wish to assist us, we encourage you to consider the following actions:
- Like our ideas
- Provide comments on our ideas
- Share our ideas
Kind Regards,
Team Setupsfx_
Much Love ❤️🚀

Fibonacci Confluence Fuels Gold’s Next Rally: Wave (Y) InsightThis 4-hour chart of XAU/USD is showcasing a WXY corrective pattern, a classic double zigzag (W)-(X)-(Y) correction after a strong impulsive move
Wave (W) has topped, marking the end of the first corrective leg.
A deep correction into the 0.5 Fibonacci retracement level occurred with wave (X), forming a potential higher low within the red demand zone.
Now, wave (Y) is anticipated, which typically mirrors or slightly exceeds the length of wave (W) but in a more corrective format.
Target 1: 3292.629
Target 2: 3372.161
Stop loss: 3201.955

TradeCityPro | Bitcoin Daily Analysis #82👋 Welcome to TradeCity Pro!
Let’s dive into the analysis of Bitcoin and key crypto indicators. As usual, I’ll walk you through the futures triggers for the New York session.
⏳ 1-Hour Timeframe
As you can see, yesterday the price stabilized below 95370 and completed a downward leg to 93626, reacting exactly to the level I pointed out in the previous analysis.
✔️ I mentioned earlier that you could enter a short position after breaking 95370 — but remember, this position is against the higher timeframe trend, so the downward move will likely end once it hits the first support, since the market momentum remains bullish on larger timeframes.
💥 Currently, the price has reacted to 93626 and seems to be resting from the previous downward move. I believe a new range box may form between 95370 and 93626 — if that happens, I’ll go long on a break above 95370.
🔽 For short positions, given the bearish momentum in this timeframe, we can look to re-enter on a break below 93626 in the next retest.
📊 Watch volume and RSI today. The volume of red candles has been much higher than bullish ones, which increases the chance of a deeper correction. If you’re shorting, keep a tight stop-loss, take profits quickly, and treat it as a scalp trade.
📈 For long positions, since it’s against the short-term trend, you’ll need a wider stop — but if the correction ends and a new bullish leg begins, the trade may stay open longer.
🧩 As for RSI: as long as it stays below 50, market momentum is bearish. A break below 30 and entry into oversold increases the likelihood of more downside.
👑 BTC.D Analysis
Bitcoin dominance broke 64.77 yesterday and retraced to 64.60. If this downward move continues, we could see early signs of a trend shift.
✨ Important note: dominance has been in an uptrend on higher timeframes, so a break of 64.60 only confirms a short-term correction. Don’t take it as a trend reversal just yet.
💫 If dominance continues to drop and the market rises, altcoins could outperform Bitcoin. Conversely, if dominance rises again, Bitcoin will rally more than altcoins.
📅 Total2 Analysis
Total2 broke below 1.03 yesterday, retested it, and now looks set to continue downward. The next support is at 1.00 — if you’re already short, consider taking profits at that level.
☘️ We’ll get full trend reversal confirmation with a break below 1.00. For long positions, the 1.05 breakout is extremely important. I strongly recommend not missing that trigger if it happens.
📅 USDT.D Analysis
USDT dominance stabilized above 5.10 yesterday, moving further away from 4.99, and is now testing 5.19. A break above 5.19 would be a strong signal that a deeper market correction is starting.
🔑 On the flip side, a break below 4.99 is still the best and most important trigger to confirm the market’s return to a bullish trend.
❌ Disclaimer ❌
Trading futures is highly risky and dangerous. If you're not an expert, these triggers may not be suitable for you. You should first learn risk and capital management. You can also use the educational content from this channel.
Finally, these triggers reflect my personal opinions on price action, and the market may move completely against this analysis. So, do your own research before opening any position.

TESLA: Bearish Continuation & Short Signal
TESLA
- Classic bearish formation
- Our team expects fall
SUGGESTED TRADE:
Swing Trade
Sell TESLA
Entry Level - 287.25
Sl - 299.67
Tp - 259.90
Our Risk - 1%
Start protection of your profits from lower levels
Disclosure: I am part of Trade Nation's Influencer program and receive a monthly fee for using their TradingView charts in my analysis.
❤️ Please, support our work with like & comment! ❤️

Ethereum Rebounds from Key Confluence Zone$ETH/USDT Weekly Chart Analysis
Ethereum is holding a major long-term uptrend as the price bounces off the ascending trendline support. This level also aligns with a strong historical resistance-turned-support zone, adding more confluence to the current bounce.
As long as ETH stays above this structure, it suggests a potential macro bullish continuation, with eyes on the upper resistance line near $3,200–$3,500.
A strong defense at this zone reinforces long-term bullish sentiment.

AUDUSD Technical & Order Flow AnalysisOur analysis is based on multi-timeframe top-down analysis & fundamental analysis.
Based on our view, the price will fall to the monthly level.
DISCLAIMER: This analysis can change anytime without notice and is only for assisting traders in making independent investment decisions. Please note that this is a prediction, and I have no reason to act on it, and neither should you.
Please support our analysis with a boost or comment!

$100K Bitcoin Within Days » Top Altcoins Choice —Your Pick (S5)Bitcoin is now bullish confirmed with a break above $97,000. Today Bitcoin trades at the highest price since late February 2025, and it is set to continue growing and growing aiming next at a break and challenge of 100K.
As soon as 100K is conquered, the Altcoins will go wild.
Which pair is your favorite Altcoin right now?
Let's start Session 5 of Your Top Altcoin Choice.
» Leave a comment with your preferred Altcoin trading pair and I will reply to your comment with a full analysis.
» We will do one pair per user/commentator.
Feel free to ask any questions.
Bitcoin is bullish now and set to grow long-term. The next All-Time High can happen around $160,000 just as it can be $180,000 or $250,000. Patience is key.
Thanks a lot for your continued support.
Namaste.

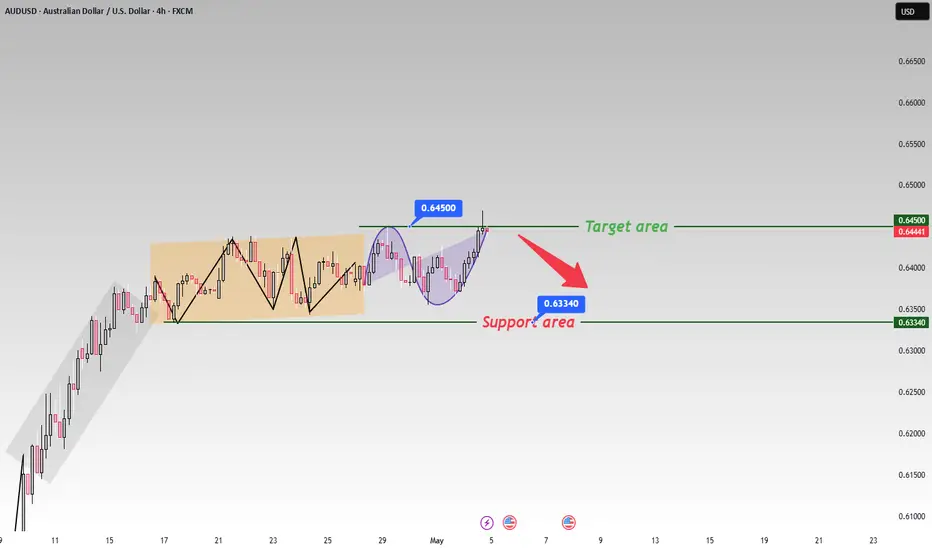
The trend next weekJudging from the price trend presented in the chart, the current market is clearly in a bearish state 📉. Previously, after the price reached the key resistance level of 0.64500, it failed to break through effectively and continue the upward trend. Instead, it entered a consolidation pattern 📊. This indicates that the bullish forces encountered strong resistance near this price level and found it difficult to push the price higher 👎.
It is expected that in the coming period, without significant positive news stimuli, the price is highly likely to continue its downward trend 📉. Investors should closely monitor whether the support level of 0.63340 holds 👀. If this support level is broken, they may consider selling short on rallies ⏬.
⚡⚡⚡ AUDUSD ⚡⚡⚡
🚀 Sell@0.6500 - 0.6450
🚀 TP 0.6350 - 0.6300
Accurate signals are updated every day 📈 If you encounter any problems during trading, these signals can serve as your reliable guide 🧭 Feel free to refer to them! I sincerely hope they'll be of great help to you 🌟
USOIL Bullish Shark PatternBased on harmonic Shark pattern analysis, the potential future trajectory of oil prices suggests an upward trend, initiated by a "Shark Dive" reversal pattern from the $54 level.
This indicates a likely bullish continuation contingent upon confirmation of the pattern's validity through subsequent price action.

Has Bitcoin Begun Its Final D-Leg Correction?Bitcoin could be starting the final stage of a larger corrective pattern — known as the D-leg — which often follows major trends in the market. This kind of structure typically forms after a big move up, and signals that the market might need a deeper reset before continuing higher.
Recently, Bitcoin was rejected from a key resistance zone around $98,300, which aligns with several technical indicators including a major daily support/resistance flip, the 0.618 Fibonacci retracement, and the Point of Control (a price level with the most traded volume). This rejection has sparked concerns that a local top may already be in for this cycle.
Why This Matters:
If Bitcoin fails to hold its current support levels, we could see a continuation to the downside, with targets potentially reaching sub-$60K levels. This aligns with a broader corrective pattern some analysts call an ABCD structure — where the D-leg often marks the final leg down before the next larger trend can begin.
This scenario becomes more likely if the current support zone breaks down, which would confirm a shift in market structure. Until then, there’s still room for price to range or attempt another retest of the highs, but caution is warranted.
What’s Next:
Watch for a breakdown below the recent lows — this would strongly suggest the D-leg is underway.
A confirmed breakdown would likely lead to a longer correction over the coming weeks or months.
However, if Bitcoin reclaims resistance above $98,300, this bearish outlook could be invalidated and the structure may reset.
Right now, we’re at a major decision point in the market. While the signs are stacking in favor of a deeper pullback, it’s important to wait for price to confirm with structure and volume before acting on it.

Before You Trade, Feel the Market’s Pulse, Sentiment Reveal allIn the world of trading, most people chase complex tools, custom algorithms, or so-called magical indicators. But what often gets overlooked is market sentiment—the invisible force behind most price movements.
Hello✌
Spend 3 minutes ⏰ reading this educational material. The main points are summarized in 3 clear lines at the end 📋 This will help you level up your understanding of the market 📊 and Bitcoin💰.
🎯 Analytical Insight on Bitcoin: A Personal Perspective:
Bitcoin is approaching a significant support level. I’m expecting at least a 6% price increase, with the primary target at $99,500.📈
Now, let's dive into the educational section , which builds upon last week's lesson (linked in the tags of this analysis). Many of you have been eagerly waiting for this, as I have received multiple messages about it on Telegram.
🧠 What Is Market Sentiment?
Market sentiment is how traders feel—fearful, greedy, or uncertain. When most are bullish, the market may be topping. When panic spreads, bottoms can form.
🔍 Why Sentiment Matters More Than Just Charts
Technical analysis tells us what has happened. Sentiment analysis hints at what might come next.
Price isn't always truth—emotion often drives breakouts or breakdowns.
🛠️ Tools for Sentiment Analysis on TradingView
📊 Long/Short Ratio
Check if the crowd is overly long or short. Too many longs? It may signal greed—be careful.
📄 COT Reports
For gold, oil, or indices, look at institutional positions. Big players often move opposite to retail.
📈 Volume & Open Interest
If price moves up but volume lags, the move might be weak. Rising open interest shows strong participation.
🔧 Community Sentiment Scripts
Search “Sentiment” under indicators to explore user-built tools for emotional insight.
📅 Real-World Example:
📌 BTC Sentiment Snapshot – Jan 2025
Bitcoin rallied from $93.4K to $102K in early January 2025.
But while price surged, volume stayed weak and long positions piled up, signaling FOMO rather than strength.
Within days, BTC dropped back to $92.5K, liquidating over-leveraged longs.
Lesson: When sentiment overheats without strong volume, a correction often follows.
🎯 How to Use These Insights
When Long/Short ratios become extreme, look for divergences or reversal signals.
Combine sentiment data with technical signals (e.g., RSI divergence near resistance) for stronger confirmation.
If price rises on low volume, consider the possibility of a fake move or bull trap.
🧩 Final Thoughts
Market sentiment is the unspoken language of traders. Learn to hear it—and you’ll act before the rest.
TradingView gives you the tools. Now it’s your job to feel the crowd.
However , this analysis should be seen as a personal viewpoint, not as financial advice ⚠️. The crypto market carries high risks 📉, so always conduct your own research before making investment decisions. That being said, please take note of the disclaimer section at the bottom of each post for further details 📜✅.
🧨 Our team's main opinion is: 🧨
Bitcoin is approaching a key support level, with an expectation of at least a 6% price increase, targeting \$99,500.
Market sentiment , which reflects traders' emotions like fear or greed, plays a crucial role in price movements, sometimes more than technical analysis alone. Tools for sentiment analysis on TradingView include the Long/Short Ratio, COT Reports, Volume & Open Interest, and Community Sentiment Scripts. A real-world example showed Bitcoin's price surge without volume support, followed by a correction. To trade effectively, combine sentiment data with technical signals like RSI divergence. Understanding market sentiment can help traders anticipate market movements before they happen.
Give me some energy !!
✨We invest countless hours researching opportunities and crafting valuable ideas. Your support means the world to us! If you have any questions, feel free to drop them in the comment box.
Cheers, Mad Whale. 🐋

I need to say this the market rallied 62% back into major short I need to say this the market rallied 62% back into major short zones
Lets take a step by step methodical safe approach to make CASH guys!
I will alert all here im 60% to my 100k challenge
Just throw a like for me! Luv yall

When will gold's plunge bottom out?For gold on Monday, it can rely on the 3264-3268 line of pressure to continue shorting, and the limit of the pullback cannot exceed the 618 position of 3275, which is the watershed. The support below is 3222-3224. If it breaks, it will hit the low point of 3201-3202, which may not be maintained.

Gold Price Eyes $3,280 Resistance as Bullish Momentum BuildsGold (XAU/USD) 1H Chart Analysis – May 4, 2025
Gold is currently exhibiting a short-term bullish trend following a breakout from a descending wedge pattern. After reaching a local bottom around the $3,200 level, the price began forming higher highs and higher lows within a rising channel. The current price is $3,240.61, and bullish momentum appears to be targeting key resistance levels at $3,266 and $3,280.
The chart highlights a potential supply zone between $3,266–$3,280, where price may face resistance. If bulls maintain control, a breakout above this zone could open the path toward the next major resistance near $3,320. Conversely, a break below the rising channel would invalidate the short-term bullish setup and suggest a retest of the $3,200 support level.
Trend & Price Action
Downtrend: There was a clear bearish move leading into May (highlighted by the yellow descending wedge).
Reversal Pattern: Price broke out of the wedge to the upside, signaling a potential reversal or retracement.
Current Trend: The price is now moving within a rising channel, indicating short-term bullish momentum.
Key Levels
Support: Around $3,200, marked with a blue horizontal line.
Resistance Zones:
$3,266 – an initial resistance level.
$3,280 – a stronger resistance area (highlighted with a red ellipse).
Price Targets
If the current bullish trend continues within the channel, the next key targets would be:
First target: $3,266
Second target: $3,280

BTC Dominance: Approaching Major Resistance!!Join our community and start your crypto journey today for:
In-depth market analysis
Accurate trade setups
Early access to trending altcoins
Life-changing profit potential
Let's analyze BTC Dominance (BTC.D) on the weekly timeframe:
BTC.D is nearing a major 66%-68% resistance zone within a long-term ascending channel (since 2018). Historically, this area has triggered BTC.D pullbacks, often leading to altcoin rallies. The chart itself anticipates a rejection from this level.
If BTC.D rejects, a move towards the 53-54% lower channel support is likely, potentially bullish for alts. Watch for bearish weekly candle closes and increased selling volume as confirmation. Altcoin price action should also be monitored for signs of strength. This key resistance zone presents a significant point for the broader crypto market. Exercise caution and await.
If you find this analysis helpful, please hit the like button to support my content! Share your thoughts in the comments, and feel free to request any specific chart analysis you’d like to see.
Happy Trading!!

Hanzo | Nas100 15 min Breaks – Will Confirm the Next Move🆚 Nas100 – Hanzo’s Strike Setup
🔥 Timeframe: 15-Minute (15M)
——————
💯 Main Focus: Bullish Break Out at 19980
We are watching this zone closely.
💯 Main Focus: Bearish Break at 19890
We are watching this zone closely.
———
Analysis
👌 Market Signs (15M TF):
• Liquidity Grab + CHoCH at 20030
• Liquidity Grab + CHoCH at 19750
• Strong Rejections seen at:
➗ 19890 – Major support / Key level
➗ 20050 – Proven resistance
🩸 Key Zones to Watch:
• 19950 – 🔥 Bullish breakout level X 7 Swing Retest
• 19980 – Strong resistance (tested 5 times)
• 19900 – Equal lows
• 19980 – Equal highs

EURUSD: Detailed Support & Resistance Analysis 🇪🇺🇺🇸
Here is my latest structure analysis
and important supports & resistances on EURUSD
for next week.
Consider these structures for pullback/breakout trading.
❤️Please, support my work with like, thank you!❤️
I am part of Trade Nation's Influencer program and receive a monthly fee for using their TradingView charts in my analysis.

Hanzo | US30 15 min Breaks – Will Confirm the Next Move🆚 US30 – Hanzo’s Strike Setup
🔥 Timeframe: 15-Minute (15M)
——————
💯 Main Focus: Bullish Break Out at 41280
We are watching this zone closely.
💯 Main Focus: Bearish Break at 40990
We are watching this zone closely.
———
Analysis
👌 Market Signs (15M TF):
• Liquidity Grab + CHoCH at 40850
• Liquidity Grab + CHoCH at 41400
• Strong Rejections seen at:
➗ 41000 – Major support / Key level
➗ 40600 – Major support / Key level
➗ 41280 – Proven resistance
🩸 Key Zones to Watch:
• 40990 – level X 6 Swing Retest
• 41270 – Strong resistance (tested 5 times) /15min
• 41000 – Equal lows
• 41400 – Equal highs

Falling towards pullback support?The Cable (GBP/USD) is falling towards the pivot which lines up with the 50% Fibonacci retracement and could bounce to the 1st resistance.
Pivot: 1.3100
1st Support: 1.2870
1st Resistance: 1.3442
Risk Warning:
Trading Forex and CFDs carries a high level of risk to your capital and you should only trade with money you can afford to lose. Trading Forex and CFDs may not be suitable for all investors, so please ensure that you fully understand the risks involved and seek independent advice if necessary.
Disclaimer:
The above opinions given constitute general market commentary, and do not constitute the opinion or advice of IC Markets or any form of personal or investment advice.
Any opinions, news, research, analyses, prices, other information, or links to third-party sites contained on this website are provided on an "as-is" basis, are intended only to be informative, is not an advice nor a recommendation, nor research, or a record of our trading prices, or an offer of, or solicitation for a transaction in any financial instrument and thus should not be treated as such. The information provided does not involve any specific investment objectives, financial situation and needs of any specific person who may receive it. Please be aware, that past performance is not a reliable indicator of future performance and/or results. Past Performance or Forward-looking scenarios based upon the reasonable beliefs of the third-party provider are not a guarantee of future performance. Actual results may differ materially from those anticipated in forward-looking or past performance statements. IC Markets makes no representation or warranty and assumes no liability as to the accuracy or completeness of the information provided, nor any loss arising from any investment based on a recommendation, forecast or any information supplied by any third-party.

$BTC support zoneCRYPTOCAP:BTC has broken out of a falling wedge and is now consolidating above the key $91K support zone.
- Eyes are now on the All-Time High at $ 109 K.
- Once that breaks, a price discovery rally toward $ 120k+
It is highly likely. 🧠
- The chart looks.
DYRO, NFA

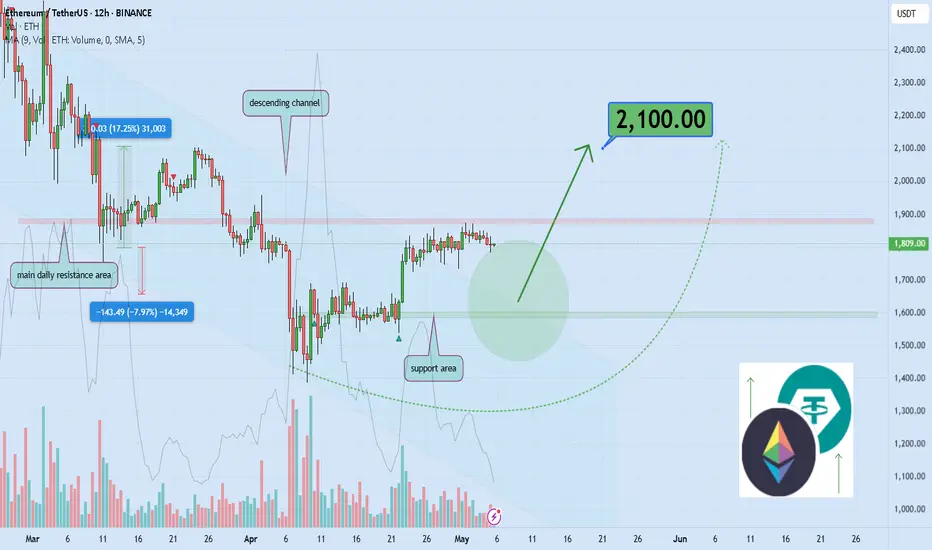
Can Ethereum Break $2,000 and Surge 16% to $2,100?Hello and greetings to all the crypto enthusiasts, ✌
All previous targets were nailed ✅! Now, let’s dive into a full analysis of the upcoming price potential for Ethereum 🔍📈.
Ethereum has recently broken out of its descending channel to the upside, indicating a potential for at least a 16% price increase. The price is approaching a key resistance zone, with the psychological \$2,000 level in sight. My primary target is \$2,100, but a retest of the channel's upper boundary is also a likely scenario. 🚀📊
🧨 Our team's main opinion is: 🧨
Ethereum broke its descending channel, targeting a 16% rise to \$2,100, with key resistance at \$2,000. 🚀
Give me some energy !!
✨We invest hours crafting valuable ideas, and your support means everything—feel free to ask questions in the comments! 😊💬
Cheers, Mad Whale. 🐋
XAUUSD Channel Up intact and targeting the 1D MA50.Gold (XAUUSD) has been trading within a Channel Up since the October 30 2024 High and is currently on its latest technical Bearish Leg. The last pull-back tested the 1D MA50 (blue tend-line) before rebounding again.
As you can see the Low that this pull-back made was also on the 0.618 Fibonacci retracement level. On the current Bearish Leg, the 0.618 Fib is at 3155 and can make contact with the 1D MA50 within 1 week. That is our short-term Target, but depending on the Fed Rate Decision on Wednesday, it may be achieved earlier.
-------------------------------------------------------------------------------
** Please LIKE 👍, FOLLOW ✅, SHARE 🙌 and COMMENT ✍ if you enjoy this idea! Also share your ideas and charts in the comments section below! This is best way to keep it relevant, support us, keep the content here free and allow the idea to reach as many people as possible. **
-------------------------------------------------------------------------------
Disclosure: I am part of Trade Nation's Influencer program and receive a monthly fee for using their TradingView charts in my analysis.
💸💸💸💸💸💸
👇 👇 👇 👇 👇 👇
