GOLD Consolidation Starts (Correction zone) Buyers Slow ExitNow after the all time high of 3482.
GOLD enters into a Consolidation zone Starts or (Correction zone) Buyers Slow Exit.
So at current market price 4180 Sell and again buy at 4000 and again sell at 4170 range and again buy at 3890 and again sell at 4050 and again buy at 3890 and again sell at 4160 and again buy at 3737.
This is for Education Purpose only, am still testing WD Gann theory!
Community ideas

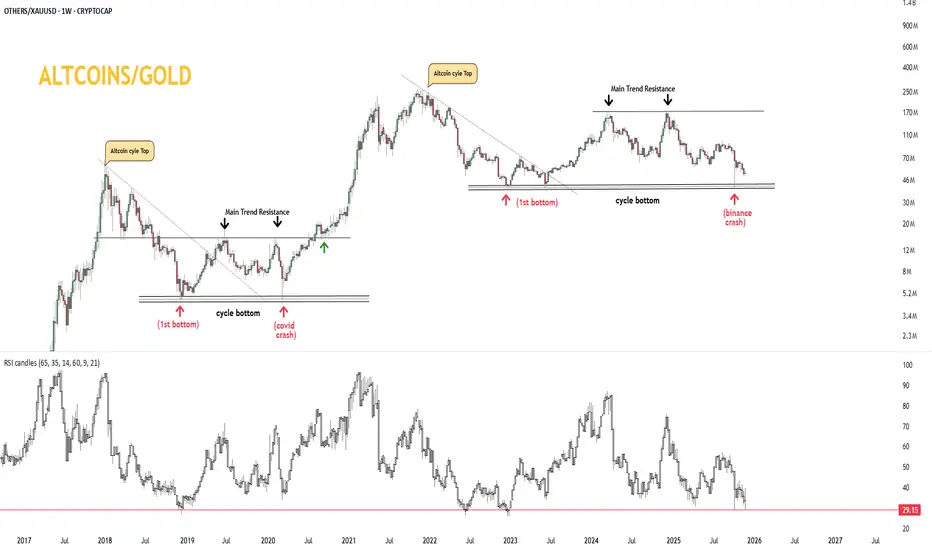
ALTCOINS/GOLD cycle chart 1w ALTCOINS/GOLD cycle chart
2017-2025 OTHERS/XAUUSD weekly fractal
RSI level / 2 different cycle comparison
XAUUSD – H2: Discount zone has formed, just waiting for the ...XAUUSD – H2: Discount zone has formed, just waiting for the price to pull back to continue buying up
On the H2 frame, gold just had a strong break up to the 4.180+ zone after a period of narrow range compression. At the end of the week, coinciding with Thanksgiving, I only prioritize waiting for an adjustment to the discount zone to buy up, absolutely not chasing the price at the peak.
🎯 MAIN SCENARIO – BUY THE DIP AT FIBO & POC ZONE 4.163–4.160
Buy entry: 4.163 – 4.160
SL: 4.155
TP: 4.178 – 4.195 – 4.220
⭐️ ALTERNATIVE SCENARIO – BUY DEEP AT VAL ZONE + STRONG SUPPORT 4.139–4.136
Buy entry: 4.139 – 4.136
SL: 4.130
TP: 4.150 – 4.172 – 4.190 – 4.220
The total risk for each scenario I always keep within the range of 1–2% of the account.
Basic context
End of the week + Thanksgiving ⇒ thin liquidity, easy to shake at the end of the session.
Messages from Trump & credit data show the economic picture and the December interest rate path are not really clear.
This keeps gold still having a defensive role, but not enough basis to expect a straight upward move – so I prioritize trading according to technicals and specific price zones.
Technical analysis H2
Market sentiment & trading plan
After the break, the buyers are holding momentum, but the price moving sideways at the high zone shows the market is partially taking profits, waiting for liquidity.
Thin liquidity easily creates sweeps to the support zone before turning around, that's the move I want to take advantage of.
Plan:
Prioritize Buy at 4.163–4.160, only consider the 4.139–4.136 scenario if the price is deeply sold off.
All orders have a hard SL (4.155 and 4.130), do not widen the stop.
Take partial profits, move SL in a favorable direction as the price approaches TP levels.
If you find the analysis useful, follow TradingView and leave a comment about the price zone waiting for entry – I always read feedback to optimize future posts.

EURUSD moving higherEURUSD is holding above 1,1580 and is heading toward a retest of the previous high.
We’re watching for the formation of a higher low, which could provide a potential buying opportunity.
The target remains a test and possible break of the prior high.
Monitor the daily close and look for confirmation of a continued move to the upside.

“Sell-Side Reaction Zone – Personal Analysis Only”“Price is reacting from the sell-side area and I’m observing a possible bearish move.
This is only my personal market analysis for educational purposes, not financial advice.”

Gold Breakout, Record Highs in PlayGold has broken out of the bull pennant it’s been coiling within since late October, signalling a potential resumption of the prior bullish trend and a move back toward record highs. Bullish momentum is building, with RSI (14) pushing above 50 and MACD staging a bullish crossover, favoring long setups.
If the breakout holds, longs could be initiated above the downtrend with a stop beneath for protection, targeting 4245 initially—the high from November 13. Should the move extend beyond that level, the record highs may act like a magnet for price.
Good luck!
DS

GOLD FREE SIGNAL|LONG|
✅XAUUSD bullish displacement out of the consolidation shows price drawing toward buy-side liquidity after mitigating the prior sell-side sweep. Upside imbalance remains unfilled, pulling price toward the next target zone.
—————————
Entry: 4166$
Stop Loss: 4135$
Take Profit: 4204$
Time Frame: 4H
—————————
LONG🚀
✅Like and subscribe to never miss a new idea!✅

Excellent week closingAs discussed throughout my morning's commentary: 'My position: I have engaged multiple Buying orders throughout yesterday’s session on #4,151.80 test and even though Volume was almost non-existent, I was well aware that Gold is Trading within Ascending Triangle and ready to deliver upside break-out. I have kept my order and on market opening Gold delivered slow but steady break1-out of #4,167.80 Resistance and I closed my set of aggressive Buying orders on #4,172.80 extension. I have re-Bought Gold this morning with #4,167.80 entry point and will continue Buying Gold from my key entry points. Congratulations on Profits and have a great weekend!'
My position: I have waited for Gold to deliver decent pullback and I found such on #4,185.80 Support test. I have engaged big Lot set of Buying orders (#4,177.80 Stop) and closed my orders on #4,202.80 extension. I will use this chance to congratulate Traders who followed my calls and had patience to hold the orders, well done / enjoy the Profits and have a great weekend!

$BTC should as least go to $70K zone. Why? :In 2023 #Bitcoin tested the 2018 high. When we retest a major break out zone once then we will likely do it again in the next leg, especcially when a trend already has been streched.
Check back history, any market, any timeframe and see it yourself.

EURUSD – Bearish Continuation Setup (H1)Price has broken below a key structure level at 1.1576, shifting short-term order flow to the downside. After the break, we have seen a clean pullback back into that same structure zone, which is now acting as new resistance.
The rejection aligns perfectly with the 50-SMA, which is currently sloping down and reinforcing bearish momentum. The most recent candle shows strong upper-wick rejection at the retest area, suggesting sellers are defending the zone.
I am anticipating a continuation of the current bearish leg, with the next liquidity pool resting around 1.1516, which acts as both a higher-timeframe support and a previous demand area.
Confluences:
• Break and retest of structure
• Rejection from 50-SMA
• Bearish trend continuation sequence (LL → LH → potential new LL)
• Clean risk-to-reward into downside liquidity

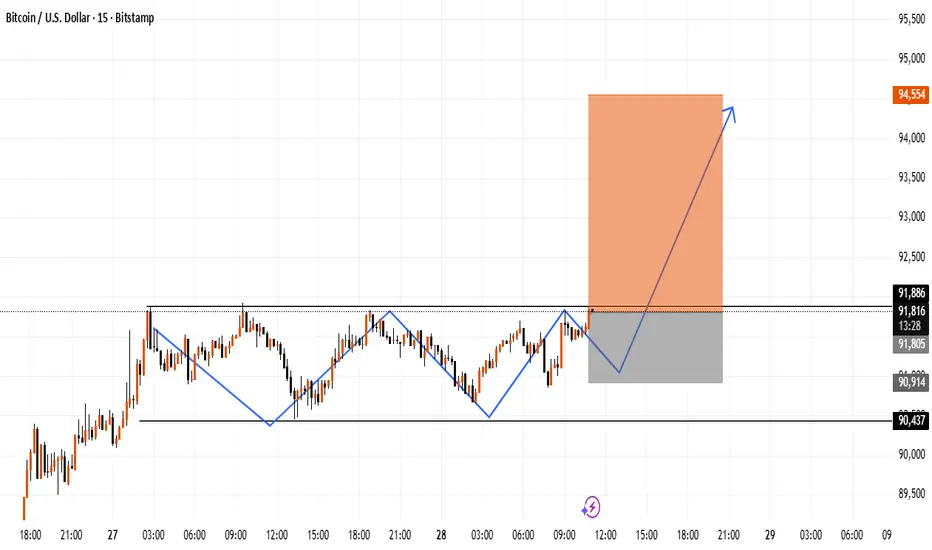
BTC Short-Term Structure Break With Potential Upside ExpansionThis chart highlights a short-term range on BTC where price has been reacting around the same horizontal zone multiple times. A clear internal structure shift can be seen, followed by a deeper pullback into the recent demand area. If price maintains support above this zone, it may open room for an upside continuation toward the next liquidity level.
The marked move is a possible price scenario, not a certainty.
This idea is shared for market observation and educational analysis only.
EURUSD: descending channel🛠 Technical Analysis: On the 4-hour timeframe, EURUSD is clearly moving within a descending channel, with price currently testing a major confluence of resistance. This resistance cluster is formed by the channel's upper trendline, the 100 and 200 SMAs, and a horizontal static zone around 1.1607. The "Global bearish signal" (Death Cross) identified earlier remains valid, reinforcing the downtrend. The projected trade anticipates a rejection from this heavy resistance, pushing the price back down toward the lower support zones, with an ultimate target near the channel's bottom at 1.1380.
🌍 Fundamental Analysis: Market liquidity is thin today in the wake of the US Thanksgiving holiday, which can lead to unpredictable or muted price action. Focus is shifting to next week's high-impact data, including Eurozone 'Flash' Inflation (Dec 2) and the crucial US Non-Farm Payrolls report (Dec 7). These releases will be vital in shaping the market's expectations for future ECB and Federal Reserve interest rate decisions, directly impacting the EURUSD exchange rate.
❗️ Trade Parameters (SELL) ❗️
➡️ Entry Point: Sell on rejection from the resistance zone (approx. 1.1600 – 1.1630)
🎯 Take Profit: 1.1468, medium-term target at 1.1380
🔴 Stop Loss: Above the resistance structure (approx. 1.1671)
⚠️ Disclaimer: This is a potential trade idea based on current analysis; market conditions and price direction are subject to change based on news factors and volatility.

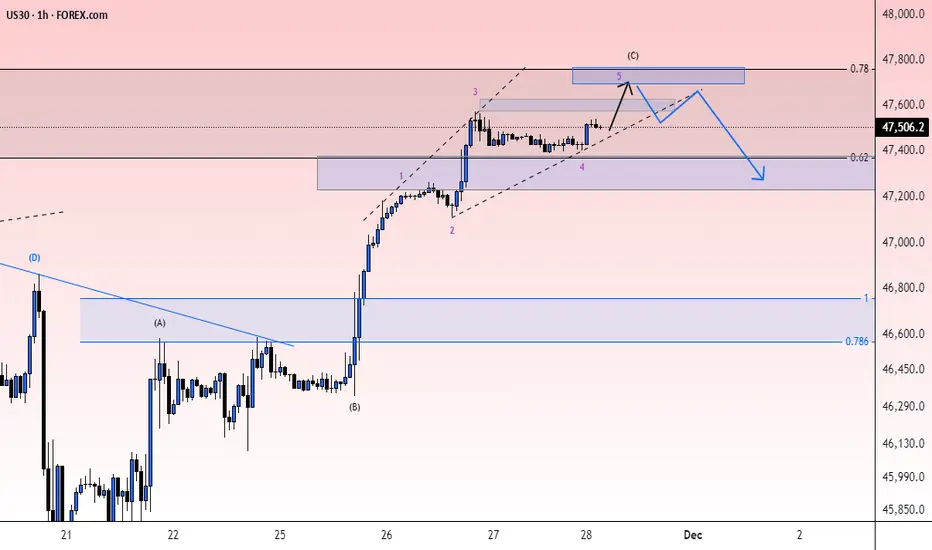
start the uptrend It is expected that the trend above the specified support levels will end and we will see the start of the upward trend. If the price crosses the 78.6% level, a downward trend will be likely.

uptrend The price is expected to change direction at the current support area and start an uptrend. If the price breaks through the support area, a downtrend is likely.

USDJPY-SETUPPrice is reacting within a key support zone and currently consolidating above the 200 MA. I’m watching for a potential bullish continuation toward the upper liquidity levels if price holds above the grey support area.
A break below this zone, however, could shift bias bearish toward the lower liquidity sweep.

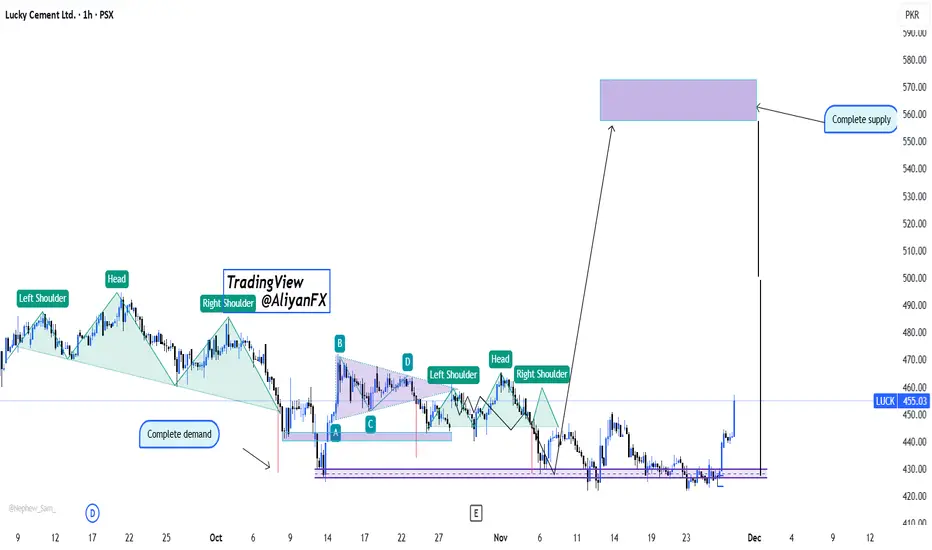
LUCK – Demand Completed|Reversal Patterns Targeting Supply ZoneLucky Cement (PSX: LUCK) has completed a series of bullish reversal structures after tapping into a major completed demand zone. Price has reacted strongly, confirming the possibility of a medium-term bullish leg toward the 560–575 PKR supply zone.
🔍 Key Technical Highlights:
🟢 Completed Demand Zone triggered a clean bullish reaction.
🧩 Multiple Inverse Head & Shoulders patterns forming across different price swings.
📉 Previous bearish leg has fully balanced its inefficiencies, enabling bullish continuation.
🟣 Major supply zone sits at 560–575, expected to be the next target for Smart Money.
⚡ Current momentum indicates strong institutional activity from discount pricing.
📈 Outlook:
If price holds above the 430–440 area, LUCK has high probability to continue upward with clean structure until the complete supply zone. Break of minor resistance levels will add confirmation for position traders.
GOLD Free Signal! Sell!
Hello,Traders!
GOLD taps a clean supply zone after an extended move, showing rejection wicks and shifting orderflow that signal potential distribution. A short-term pullback into discounted levels may unfold toward the downside target.
--------------------
Stop Loss: 4,246$
Take Profit: 4,192$
Entry Level: 4,216$
Time Frame: 2H
--------------------
Sell!
Comment and subscribe to help us grow!
Check out other forecasts below too!
Disclosure: I am part of Trade Nation's Influencer program and receive a monthly fee for using their TradingView charts in my analysis.

XAUUSD – Quick Technical OutlookGold continues its steady climb and is now testing a major supply zone around 4,230–4,245. This area previously triggered strong rejection, making it a critical level for the next move.
If price breaks and holds above this zone, momentum could extend toward new highs. However, failure to clear resistance may lead to a pullback toward 4,180–4,160 before buyers attempt another push.
Market is bullish, but entering directly into supply requires caution.

SPX — a new ATH is coming very soon.The market has just formed a clean initial impulse and broke out of the descending Andrews pitchfork , which tells us one thing: the correction is about done. (I previously expected a triangle as a possible correction, but the structure is now clear.)
From here, the next step is simple — a new all-time high.
Targets: I’m focused on the 127.2% and 161.8% Fibonacci extensions of the correction.
Trading plan: I’m waiting for a local 3-wave pullback — and only then I’ll enter on the breakout. Entering “just because it dipped” — ❌ never an option.

Has the Nasdaq’s Downtrend Ended?Recently, U.S. indices witnessed declines exceeding 5%, driven by reduced expectations of an interest rate cut in the Federal Reserve’s December meeting, the key catalyst influencing market sentiment and the movement of U.S. indices.
However, the Nasdaq rebounded this week, breaking above the 25,221 level and forming a higher high, indicating a shift in trend from bearish to bullish.
The latest gains are supported by renewed expectations of a December rate cut with an 80% probability, in addition to investors buying the dip as part of their long-term investment strategies in the artificial intelligence sector.
On the technical side, if the price pulls back for a correction, it may rebound again from the 24,148 level to target 24,962 as a first medium-term target.
However, a decline below 23,830, along with forming a lower low on the 4-hour timeframe, would invalidate the bullish scenario and signal a return to a downward trend for the Nasdaq.

EURUSD - we got what we wantedFurther to my previous idea on EURUSD - the price has (most likely) respected the Resistance and started to complete the Butterfly Pattern.
So now, hand off the computer and wait. Or perhaps go out for some Black Friday Shopping! We have just earned some $ for it :)
Just my humble opinion

possibility of correction The price is expected to move in the specified direction and then change direction at the resistance area and start an downtrend.
UK 100 Index – Psychological 10000 level Within Sight!As the dust settles on the UK Chancellor’s Autumn budget that was released on Wednesday it’s potentially a good time to assess the current backdrop for the UK 100 moving into early December.
First things first, Wednesday’s budget didn’t lead to an immediate rush to sell UK assets, which most notably was the case in the Liz Truss era and was a possible concern in the lead up to this release. Government bond markets took the series of tax rises and spending announcements in their stride, GBPUSD squeezed out some weak shorts to post a high of 1.3268 on Thursday, and the UK 100 followed it to print a 2 week high of 9715 before running into some profit taking on a move which had seen it rally from a low of 9425 posted on November 21st.
Looking forward, the focus for 100 UK traders may now shift to the interest rate decisions of the Federal Reserve (Fed) on December 10th and the Bank of England (BoE) on December 18th. The Fed rate decision could be important for two reasons, the first is that it may dictate the path of general risk sentiment into year end and secondly, with the UK 100 index dominated by multi-national companies generating around 70% of their revenue outside of the UK, any Fed move could directly impact their earnings outlook for early next year.
In terms of the BoE, while the Autumn budget wasn’t perhaps perceived by economists to be as dis-inflationary as it could have been, it may have done enough to shift the voting at the December meeting towards another 25bps (0.25%) cut. Certainly, the market thinks this to be the case with around 90% chance of a cut currently priced, although there could still room for a surprise ‘no change’ or disappointment on the speed of future rate cuts to start 2026.
While UK 100 price volatility may have reduced over this US Thanksgiving holiday period into the end of November, it could be very different story during the first 3 weeks of December.
Technical Outlook: How Much Further Can the Current Rally Go?
Since posting the 9425 November 21st low, the UK 100 index has rallied just over 3%, with immediate resistance levels giving way. This now includes closes above 9692, a level equal to the Bollinger mid‑average.
Traders may see this as the start of a further phase of price strength, but it remains essential to monitor both immediate support and resistance levels to gauge the next directional themes.
While a close above mid‑average resistance at 9692 could be interpreted as a signal of further upside potential ahead, there is no guarantee of this, and near‑term support levels may prove just as important in shaping price action over the coming days.
Potential Resistance Levels:
After the close above the Bollinger mid-average resistance at 9492 the focus could now be on 9742 as the next resistance. This level is equal to the 61.8% Fibonacci retracement
A successful close above 9742 is required to suggest further attempts at price strength, which could then shift focus towards potential tests of 9940, the November 12th all-time high.
Potential Support Levels:
After the latest price strength, initial support may now stand at 9605, the 38.2% retracement of the November rally. While a pattern of higher highs and higher lows is still intact, closing breaks below 9605 could lead toward further short-term weakness.
If the 9605 retracement gives way on a closing basis, risks could then shift toward deeper declines, opening scope for tests of 9537, which is the 61.8% retracement, possibly even 9425, the November 21st session low.
The material provided here has not been prepared accordance with legal requirements designed to promote the independence of investment research and as such is considered to be a marketing communication. Whilst it is not subject to any prohibition on dealing ahead of the dissemination of investment research, we will not seek to take any advantage before providing it to our clients.
Pepperstone doesn’t represent that the material provided here is accurate, current or complete, and therefore shouldn’t be relied upon as such. The information, whether from a third party or not, isn’t to be considered as a recommendation; or an offer to buy or sell; or the solicitation of an offer to buy or sell any security, financial product or instrument; or to participate in any particular trading strategy. It does not take into account readers’ financial situation or investment objectives. We advise any readers of this content to seek their own advice. Without the approval of Pepperstone, reproduction or redistribution of this information isn’t permitted.
