Bitcoin (BTC): Looking For Re-Test of $92,000Weekends were pretty bloody, where we had a strong sell-off on the markets, but yet we did not see the proper re-test of the local resistance zone (which is still the resistance and now proper support zone).
We are looking for the price to decline back towards the GETTEX:92K , where we will be looking either for further downward movement or upward movement.
We set both sell and buy entry zones for us so let's wait now
Swallow Academy
Community ideas

EURCAD: Still Bearish Outlook 🇪🇺🇨🇦
Last week, we discussed a confirmed bearish breakout of
a major horizontal support on EURCAD.
The broken structure was retested, and I see a strong bearish
intraday price action on an hourly time frame.
Probabilities will be high to see a down movement at least to 1.558 level today.
❤️Please, support my work with like, thank you!❤️
I am part of Trade Nation's Influencer program and receive a monthly fee for using their TradingView charts in my analysis.

Gold longTrying to execute a long position.
A nice wedge formation has been created.
Let us wait for the 3235$ region and then i am going to enter a long position

GBPJPY SellsThis coming week, I am expecting GBPJPY price to decline immensely. The first sign of the bearish movement. A bearish flag is emerging on the 15 Minute chart

EURUSD Bearish Structure AnalysisFX:EURUSD is currently bearish in structure, forming an imperfect Head and Shoulders pattern with EMA potentially flipping. Price target is heading towards support or the 200 EMA.

$1000CHEEMSUSDT Breakout Alert🚨 Breakout Alert! BINANCE:1000CHEEMSUSDT 🚀
Price broke out of a symmetrical triangle on the 12-hour chart, bullish confirmation in play.
- Entry: CMP
- Target 1: 0.001681
- Target 2: 0.002183
- Final Target: 0.003322
- SL: 0.001336
Volume confirmation next?
Watch closely! 👀

TURBO price analysisWell, admit it, at least someone took a chance / was lucky enough to buy #TURBO at $0.0014-0.0015 with a pending limit order that they forgot about ?)
The price of OKX:TURBOUSDT rebounded well, now it would be a "blessing lucky" to buy this #memcoin at $0.0029-$0.0033
With the prospect of #Turbo continuing to grow at least to $0.010
_____________________
Did you like our analysis? Leave a comment, like, and follow to get more

Dow Jones - April ReviewUnlike ES and NQ, YM has the potential to book massive gains if the algorithm was to spool prices higher into the $42,836 lower range FVG in comparison to the others. However, if the market is weaker than many anticipate, YM could be frontrunning the overall stock index pairs (out of NQ, ES and YM) to the downside.
Gun to my head, we are bound for some short term bullish price action back up into the premium array

Nasdaq - April ReviewMore confident in S&P500 reaching my overall objective of the midpoint of the SIBI consequent encroachment than Nasdaq this month but all in all, I am still expecting the market to gravitate higher up to $20,370

S&P 500 - April ReviewI see more potential in S&P 500 than Nasdaq for the mere fact that the premium array at $5,773.25 - $5,902.50 has not been met yet but Nasdaq has already made it's way inside of the same SIBI imbalance. (refer to my most recent S&P500 analysis)
Aiming for low hanging fruits for now.

US10Y - April ReviewWhenever we are faced with a market that is consolidating, it's best to lower your leverage and aim for low hanging fruits.
Gun to my head, I would like to see a bullish draw to 4.440% but after that price is met, anything goes!

$BONK just broke out SEED_DONKEYDAN_MARKET_CAP:BONK just broke out of a long downtrend after a double bottom
- Retesting support at $0.016 holding strong.
- Target: $0.061 (+278%)

Netflix is going to fall sharply soonNetflix is in the huge 5th wave extension. I expect it to complete wave (v) of 5 very soon, probably within the next week.
RSI divergence on 3-days, weekly frames is quite visible and supports the upcoming trend reversal.
When wave 5 is extended, retracement typically goes to the bottom of wave (ii) of this 5th wave. This would mean 1180-1195 USD to end the wave 5. Also, at this price wave 5 will be 2.168 times bigger than waves 1 and 3 together.

XAUUSD Channel Up intact and targeting the 1D MA50.Gold (XAUUSD) has been trading within a Channel Up since the October 30 2024 High and is currently on its latest technical Bearish Leg. The last pull-back tested the 1D MA50 (blue tend-line) before rebounding again.
As you can see the Low that this pull-back made was also on the 0.618 Fibonacci retracement level. On the current Bearish Leg, the 0.618 Fib is at 3155 and can make contact with the 1D MA50 within 1 week. That is our short-term Target, but depending on the Fed Rate Decision on Wednesday, it may be achieved earlier.
-------------------------------------------------------------------------------
** Please LIKE 👍, FOLLOW ✅, SHARE 🙌 and COMMENT ✍ if you enjoy this idea! Also share your ideas and charts in the comments section below! This is best way to keep it relevant, support us, keep the content here free and allow the idea to reach as many people as possible. **
-------------------------------------------------------------------------------
Disclosure: I am part of Trade Nation's Influencer program and receive a monthly fee for using their TradingView charts in my analysis.
💸💸💸💸💸💸
👇 👇 👇 👇 👇 👇

Dow Jones - Potential short coming upDow Jones approaching a shorting zone
We have an ABC pattern
Within the B wave we have another ABC
We smashed down and are now crawling up, so looking for another short

Bitcoin short Bitcoin short from 97k.
A nice little retest is located at that region.
Trying to catch a nice short .

For the patience ones.If a close bellow the last weeks price action occurs, We can sell short at the market or wait for a possible retrace then get in. Its a long ride until the target but if all goes well will be possible to build a massive position but until then we wait for the first trigger. More updates as the trade develops.

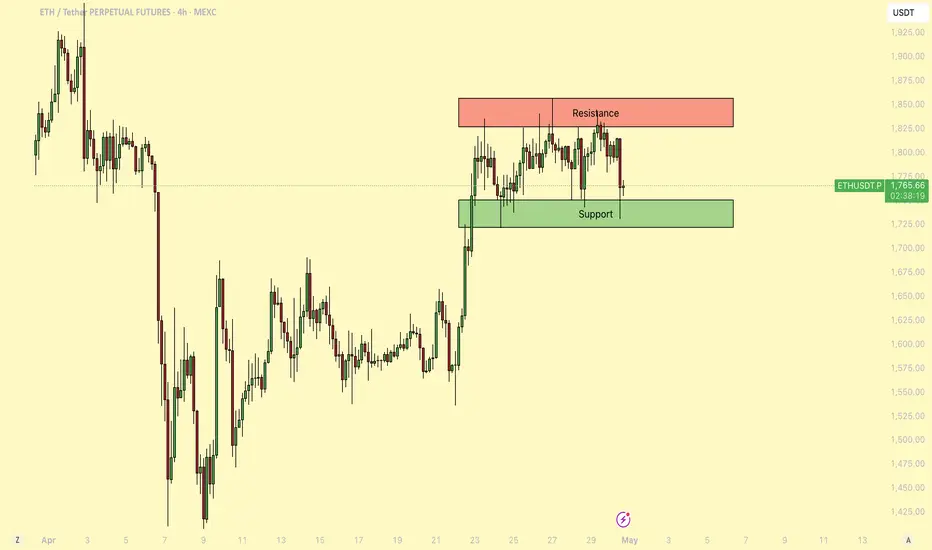
ETH - Consolidating before a major breakout!About a week ago, Ethereum (ETH) saw a strong upward move, pushing the price up with notable momentum. Since then, it has entered a period of consolidation, trading within a tight range as the market awaits the next decisive move.
-------------------------------
Which Direction Will ETH Break?
After such a strong rally, this kind of consolidation is normal. It could signal a continuation to the upside, especially if this is part of a broader relief rally. However, it's important to note that during the rapid move up, ETH left behind a 4h Fair Value Gap (FVG), which may attract price back down for a potential fill in the event of a breakdown.
-------------------------------
Stochastic RSI insight
On the daily chart, the Stochastic RSI remains in the overbought zone. Historically, when this indicator lingers in such territory, ETH has seen notable pullbacks. This could be an early sign that a downward move is more likely unless momentum changes soon.
-------------------------------
ETH vs. the 50-Day Moving Average
ETH is currently struggling with the 50-day Moving Average (MA), trading just below this key resistance level. As long as ETH remains under the 50-day MA, bearish pressure could continue. However, a reclaim and sustained hold above this level would likely indicate a shift toward bullish momentum.
-------------------------------
My Outlook
This range is tricky to trade, and a breakout in either direction is possible. Personally, I think there's a chance ETH could sweep the recent highs before a larger move down. The overbought Stochastic RSI and resistance at the 50-day MA both suggest that the rally might be losing steam in the short term.
-------------------------------
Thanks for your support.
- Make sure to follow me so you don't miss out on the next analysis!
- Drop a like and leave a comment!
BTC - Liquidity Mapping to Predict MovementAs a part II to my previous post on “Bull Market OR Bearish Retest?” - Here is a 2 day liquidity map on BTC’s chart.
I’m anticipating a sharp drop to 7,000 - why is this number significant?
There is a mass amount of liquidity in the chart down towards 7,000-10,000.
This liquidity is in the form of long stop loss orders.
In layman’s terms - the sell orders required to take price to this extreme low are already within the chart. It is a pre-set consequence to traders decisions in a market dominated by leveraged buys and sells.
If we consider what the “floor” price of BTC is (IE all long term secured holders) - we first have to seperate out the leveraging liquidity used in the futures market.
How much of the BTC market cap is injected liquidity from futures / derivatives? In my view, anything above 7,000.
This liquidity can flow in and out, and the business and function behind it isn’t affected. This liquidity is extremely fluid. It can drop 90,000 and rise 90,000 shortly after without any affect on the fundamental value of Bitcoin.
Sure there is a psychological consequence with perceived value and market stability - but the fact is, leveraged liquidity can enter the market and leave the market with no impact at all on the wallets of market makers.
Food for thought - happy trading.

"DXY Dollar Index" Market Bullish Heist Plan (Day/Swing Trade)🌟Hi! Hola! Ola! Bonjour! Hallo! Marhaba!🌟
Dear Money Makers & Robbers, 🤑 💰💸✈️
Based on 🔥Thief Trading style technical and fundamental analysis🔥, here is our master plan to heist the "DXY Dollar Index" Bank Heist. Please adhere to the strategy I've outlined in the chart, which emphasizes long entry. Our aim is to escape near the high-risk ATR Line Zone. It's a Risky level, overbought market, consolidation, trend reversal, trap at the level where traders and bearish robbers are stronger. 🏆💸"Take profit and treat yourself, traders. You deserve it!💪🏆🎉
Entry 📈 : "The heist is on! Wait for the Crossing previous high (100.400) then make your move - Bullish profits await!"
however I advise to Place Buy stop orders above the Moving average (or) Place buy limit orders within a 15 or 30 minute timeframe most recent or swing, low or high level for Pullback entries.
📌I strongly advise you to set an "alert (Alarm)" on your chart so you can see when the breakout entry occurs.
Stop Loss 🛑: "🔊 Yo, listen up! 🗣️ If you're lookin' to get in on a buy stop order, don't even think about settin' that stop loss till after the breakout 🚀. You feel me? Now, if you're smart, you'll place that stop loss where I told you to 📍, but if you're a rebel, you can put it wherever you like 🤪 - just don't say I didn't warn you ⚠️. You're playin' with fire 🔥, and it's your risk, not mine 👊."
📍 Thief SL placed at the nearest/swing low level Using the 2H timeframe (99.000) Day/swing trade basis.
📍 SL is based on your risk of the trade, lot size and how many multiple orders you have to take.
🏴☠️Target 🎯: 102.300
🧲Scalpers, take note 👀 : only scalp on the Long side. If you have a lot of money, you can go straight away; if not, you can join swing traders and carry out the robbery plan. Use trailing SL to safeguard your money 💰.
💰💵💸"DXY Dollar Index" Bank Money Heist Plan is currently experiencing a bullishness,., driven by several key factors. .☝☝☝
📰🗞️Get & Read the Fundamental, Macro Economics, COT Report, Geopolitical and News Analysis, Sentimental Outlook, Intermarket Analysis, Index-Specific Analysis, Future trend targets with Overall outlook score... go ahead to check 👉👉👉🔗🔗🌎🌏🗺
⚠️Trading Alert : News Releases and Position Management 📰🗞️🚫🚏
As a reminder, news releases can have a significant impact on market prices and volatility. To minimize potential losses and protect your running positions,
we recommend the following:
Avoid taking new trades during news releases
Use trailing stop-loss orders to protect your running positions and lock in profits
💖Supporting our robbery plan 💥Hit the Boost Button💥 will enable us to effortlessly make and steal money 💰💵. Boost the strength of our robbery team. Every day in this market make money with ease by using the Thief Trading Style.🏆💪🤝❤️🎉🚀
I'll see you soon with another heist plan, so stay tuned 🤑🐱👤🤗🤩

XAUUSD Analysis todayHello traders, this is a complete multiple timeframe analysis of this pair. We see could find significant trading opportunities as per analysis upon price action confirmation we may take this trade. Smash the like button if you find value in this analysis and drop a comment if you have any questions or let me know which pair to cover in my next analysis.

MAGIC Rebuy Setup (4H)This analysis is an update of the analysis you see in the "Related publications" section
The price didn’t reach our red zone for entering a Sell/Short position, but the trend reversal outlook on MAGIC was correct.
We are now looking for a potential Buy/Long position near the support zone.
We will only enter a Buy/Long position if the price touches the green zone.
Targets are marked on the chart.
A daily candle close below the invalidation level will invalidate this analysis.
For risk management, please don't forget stop loss and capital management
When we reach the first target, save some profit and then change the stop to entry
Comment if you have any questions
Thank You

HelenP. I Euro may correct to trend line and then rebound upHi folks today I'm prepared for you Gold analytics. After a sharp, impulsive rise, price entered a broad consolidation phase between 1.1575 and 1.1270 levels, creating a horizontal channel where price oscillated for several sessions. This type of structure often serves as a re-accumulation zone during a trending market. What's particularly notable is the recent touch of the lower boundary of the range, which coincided with a retest of both the ascending trend line and the support zone around 1.1270 points. This confluence of technical factors makes the current area critical for further price development. Following the bounce from the support zone, the pair is showing early signs of recovery. The trend line has held firmly, and buyers stepped in with a reaction candle confirming demand interest. While EUR is not yet out of the consolidation, the structure suggests strength and potential continuation. Given the alignment of the upward trend line, support zone validation, and stabilization after the drop, I expect that EURUSD may climb almost toward the upper boundary of the consolidation. That's why my current goal lies at 1.1500. If you like my analytics you may support me with your like/comment ❤️
