why? 90% of traders buy high and sell low?Have you ever entered a trade right when everyone said it is going to the moon
Have you ever sold right before price exploded upward again
This guide is here to break that painful cycle once and for all
Hello✌️
Spend 3 minutes ⏰ reading this educational material.
🎯 Analytical Insight on xrp:
I expect a much bigger rise for Ripple than what I have shown on the chart. But we should remember that every year when the New Year approaches the market usually goes bearish. We need to wait and pass through that period to see what the final result will be.
Now , let's dive into the educational section,
🧠 Trader Psychology
When price pumps fast the brain fears missing profit
This fear forces rushed entries without any plan
During drops the brain wants to escape immediately
Emotions repeat the same losing behavior again and again
As long as emotions decide the market always wins
📉 Market Emotion Cycle
Hope and excitement start the first entries
Greed grows at the top and everyone buys with confidence
Fear suddenly appears and price collapses fast
Panic creates the worst possible exit timing
Professionals buy while panic controls the crowd
🎯 Why We Buy Tops And Sell Bottoms
We search for confirmation from the majority
The majority is usually late and wrong in timing
Crowded zones have the highest probability of traps
After attracting buyers price normally corrects downward
In the bottom panic sellers accelerate the drop
📌 Proper Entry Plan
Entries must happen in logical discounted areas
Follow the trend instead of fighting it blindly
A trade without risk reward logic is a bad trade
A clear plan neutralizes heat of the moment emotions
🛡 Real Risk Management
Stop loss must exist before entering a position
Small risk keeps the trader alive long term
Clear targets prevent emotional exits without purpose
Without stop loss the market owns your account
📊 TradingView Tools
Volume Profile shows where big money entered strongly
Auto Fib Retracement marks logical pullback zones
Fear and Greed Index shows collective emotional pressure
Horizontal levels identify probable price reaction zones
Combining these tools creates emotion free trading decisions
🏆 Professional Behavior
They never enter trades during emotional hype
They journal every decision for performance growth
They know the market always gives another chance
Mind control matters more than predicting every move
main point
Replace hype and the herd with logic and structure and the cycle of buying tops and selling bottoms ends here. Survival and profits come from mental discipline not guessing the future. Control emotions and you step into professional trading.
golden recommendations
Wait for pullbacks instead of chasing fast moving candles
When everyone feels extremely confident danger might be highest
A stop loss costs less than your pride and saves your future
✨ Need a little love!
We pour love into every post your support keeps us inspired! 💛 Don’t be shy, we’d love to hear from you on comments. Big thanks , Mad Whale 🐋
📜Please make sure to do your own research before investing, and review the disclaimer provided at the end of each post.
Community ideas

Back in the Channel – Eyes on New ATHs AheadBitcoin: Back in the Channel – Eyes on New ATHs Ahead 🚀
We're slowly seeing confidence return… and this is not just another bounce. This chart shows BTC reclaiming the massive ascending channel that has governed price action since early 2023. Price just wicked perfectly back into structure — a key reclaim above 88,652 has flipped the narrative back in the bulls' favor. 📈
Three key things stand out:
Channel structure is intact — this is a clean re-entry.
Support held above 88,652 — major validation point.
Targets now shift to 115,054 → 124,144 → 138,800 — each level has history and structure behind it.
New ATHs may not come tomorrow, but with this kind of technical structure, early 2026 could bring serious fireworks . If the bulls stay disciplined, this is a textbook reaccumulation setup inside a macro trend.
Longs are valid as long as we hold above 88,652. Let price do the talking.
Thought of the Day 💡
Respect the structure, not the emotions. Charts like this don’t lie — it's the humans that waver. The higher the timeframe, the stronger the truth.
Disclaimer: What you read here is not financial advice — it’s high-level market philosophy from the FXPROFESSOR himself. Risk is real, and your capital is your responsibility. Learn, adapt, evolve.
One Love,
The FXPROFESSOR 💙
My worries: 79k was NOT checked as support And that is the major support on my chart. There is still over 40% likely that we need to check that 79k level.... but hey: i will be LONG over 88,652 — eyes on 115K → 124K → 138K 🚀 (just remember to play the levels: long over/short under!)

us oilHI GUYS,
UPDATE and CORRECTION on US OIL
we wait for sells Friday morning, a few hours from now,
(MON, TUE) Double bottom buy price is calling for a sell price pattern (FRI, MON) Head shoulder

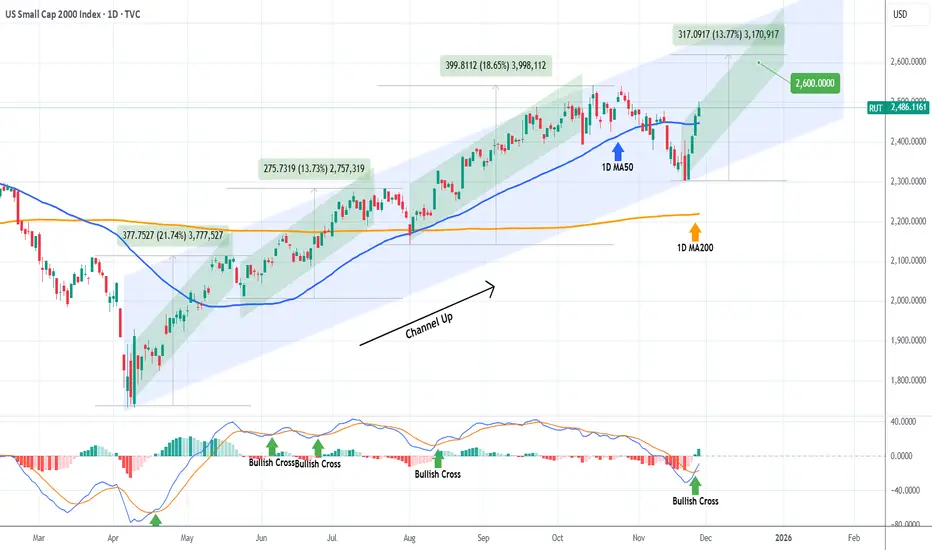
RUSSELL targeting 2600 on this Bullish Leg.Russell 2000 (RUT) has been trading within an 8-month Channel Up since the April 07 market bottom and following its latest correction (Bearish Leg), it recovered this week its 1D MA50 (blue trend-line), having already started the new Bullish Leg.
The minimum rise a Bullish Leg had within this pattern has been +13.73%. As a result, we expect the current one to hit at least 2600. Notice also the 1D MACD Bullish Cross, which has always been a confirmation of a new rally.
---
** Please LIKE 👍, FOLLOW ✅, SHARE 🙌 and COMMENT ✍ if you enjoy this idea! Also share your ideas and charts in the comments section below! This is best way to keep it relevant, support us, keep the content here free and allow the idea to reach as many people as possible. **
---
💸💸💸💸💸💸
👇 👇 👇 👇 👇 👇
Hedera (HBAR): Good Buy Zone Forming Up | BullishHBAR reacted well from the same support zone that held multiple times in the past, showing that buyers are still defending this area. After the liquidity sweep, momentum slowly shifted and we’re now seeing early signs of a bullish push.
As long as buyers keep holding above this zone, the upside play stays valid. A steady recovery toward the EMAs makes sense, and if momentum continues, we could see a clean extension toward the higher targets.
Swallow Academy

BNB/USDT 1H AnalysisHi
After a prolonged downtrend, BNB has broken its descending trendline, signaling a shift from bearish to bullish momentum. The price formed a symmetrical triangle pattern, completing at point D, which coincides with the lower boundary of the rising channel. Since then, BNB has been trading inside a clearly defined ascending channel, respecting both support and resistance levels.
Recently, a bullish flag has formed, representing a consolidation after a strong upward impulse. A breakout from this flag suggests continuation towards the upper channel boundary near $940–950. Support lies around $880, aligning with both the flag’s lower boundary and the channel’s midline.

Bitcoin dominance soon about to drop A drop in btc dominance represents an altseason.
Soon this will occur.
Let us wait for the new year.

BTCUSD Next Possible MoveBTCUSD h4 timeframe we see that BTCUSD rejected by a strong zone (91600_93100) , the most likly is to continue dumping to search a strong demande zone located to(87600-86200) before another bullish move

USDJPY -30Min — Volume Buy Reversal Triggered⚡Base : Hanzo Trading Alpha Algorithm
The algorithm calculates volatility displacement vs liquidity recovery, identifying where probability meets imbalance.
It trades only where precision, volume, and manipulation intersect —only logic.
Technical Reasons
/ Direction — LONG / Reversal 156.000 Area
☄️Bullish momentum confirmed through strong candle body.
☄️Structure shifted with higher-low near key demand base.
☄️Volume expanding confirms order-flow alignment upward.
☄️Buyers reclaimed imbalance with sustained clean break.
☄️Algorithm detects rising momentum under low liquidity.
⚙️ Hanzo Alpha Trading Protocol
The Alpha Candle defines the day’s real control zone — the first battle of momentum.
From this origin, the Volume Window reveals where the next precision strike begins.
⚙️ Hanzo Volume Window / Map
Window tracked from 10:30 — mapping true market behavior.
POC alignment exposes institutional bias and breakout potential zones.
⚙️ Hanzo Delta Window / Pulse
Delta window monitors real buying vs. selling power behind each move.
Tracks volume aggression to expose who controls the candle — buyers or sellers.
When Delta aligns with Volume Map, momentum becomes undeniable.

Daily bitcoin trade - Fri(Nov-28-2025) - ShortFri(Nov-28-2025) - Short
Lev: 25x
En:90780
Sl: 93390
TP:87885
This is my personal setup — please always manage your risk.
This is not an offer to buy or sell.

AUD/USD: Buying Opportunity with Continued UptrendCurrently, AUD/USD is continuing its strong uptrend, and with macroeconomic factors supporting this move, the price is likely to continue rising in the short term. After breaking the 0.65 level, this pair is heading towards higher resistance levels, with the nearest target being 0.6570.
With high inflation in Australia, the Reserve Bank of Australia (RBA) is less likely to cut interest rates , which provides stability and support for the AUD. In addition, the expectation that the Federal Reserve will cut rates in December continues to weaken the USD, creating an opportunity for AUD/USD to rise. The current chart shows a recovery price pattern with solid support at the 0.6520 level, reinforcing the uptrend.
The next resistance level that AUD/USD could reach is 0.6570. If the price corrects to the 0.6520 area and holds, it will be an ideal buying opportunity to continue the uptrend. However, traders should be cautious with upcoming economic data from the US. If there is positive news from the US, the USD may quickly recover, causing a pullback for AUD/USD.

GBPUSD Daily CLS Model 1 - 50% TPHi friends, new range created. As always we are looking for the manipulation in to the key level around the range. Don't forget confirmation switch from manipulation phase to the distribution phase to make the setup valid. Stay patient and enter only after change in order flow. If price reaches 50% of the range take partial or full close.
📌 HTF - Higher Timeframe view 🧩 Complete proces and Strategy explained 👇 Click Below
🧠 Core of mindset problems
If you don't know your statistics on large enough data sample. You don't know your probabilities of win rate once the losing streak happen and it happens to every strategy. You will start doubting, hesitating to take next trade because you don't know statistics of your losses. In the end you will be doubting strategy and then jump to different one. You will be in the endless loop for years, looking for new better strategy. 👊 Your ultimate goal as a trader is not to be a generalist who knows 10 000 patterns. But rather create one system with narrowed criteria of each element of the trade to remove subjective and emotional decisions as much as possible and stick to this system no matter what. Practice it 10 000 times become a MASTER.
✨ Trading Mastery is reflection of your life
Have a longterm plan, No Alcohol & Drugs, Ignore others, Focus on your journey , Backtest regularly, Review your weeks, Journal mistakes, Exercise, Sleep well, Read books, Walks in nature (no phone) , Meditate, Reduce social media time, Spend time with family, Live Life.
Trading is hard, but not impossible. I believe in you 💪
David Perk aka Dave Fx Hunter

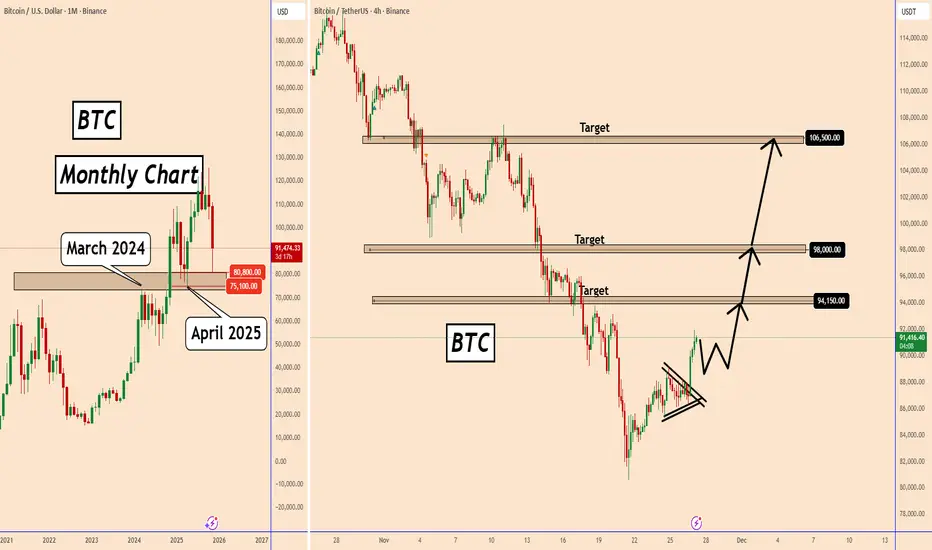
BTC at Key Support Zone - Bullish Setup in Progress? - UPDATEBTC at Key Support Zone - Bullish Setup in Progress? - UPDATE
Bitcoin has reached a major long-term support zone between 75,100 – 80,800, an area that previously acted as strong support in March 2024 and April 2025 on the monthly timeframe.
Currently, BTC reacted as we expected from our previous analysis and has already reached 92000.
Yesterday, during the European evening, the price broke out of the triangle pattern and started the upward movement.
A small pause is possible before BTC moves further.
I would not be surprised if this is the beginning of another upward wave, at least towards our targets, or if it can retest the all-time high price zone.
The retest of the monthly 75100 - 80800 zone was very important for the bulls to join BTC at a better price.
Key targets:
94150
98000
106500
You may find more details in the chart!
Thank you and Good Luck!
❤️PS: Please support with a like or comment if you find this analysis useful for your trading day❤️
SQD Analysis (1D)First of all, pay attention to the timeframe | this is the daily timeframe.
For sell/short positions in higher timeframes and in a swing style, entries should only be taken within the red zone. However, for scalp short positions, you may enter after confirmation, but you must manage your expectations regarding scalp trades.
On the chart, it seems that wave C has completed and the price has entered wave D. Within the green support zone, wave D may still be incomplete, and the price could enter a corrective phase of wave D, which in this case means an upward move.
The targets are marked on the chart. A daily candle close below the invalidation level will invalidate this analysis.
For risk management, please don't forget stop loss and capital management
When we reach the first target, save some profit and then change the stop to entry
Comment if you have any questions
Thank You

BULLISH MOVE - GOLDHello traders,
the gold price has broken out of its descending channel.
This breakout signals a shift in momentum,
so I’m expecting a bullish continuation in the coming sessions.
🎯 TARGET: 4245.000

Gold Eyes 4,110 — USD Weakness Could Fuel the Next Leg Up!!Hey Traders,
In today's trading session we are monitoring GOLD (XAUUSD) for a potential buying opportunity around the 4,110 zone. Gold continues to trade firmly within an established uptrend, and the current pullback is bringing price right into a key support + trend confluence at 4,110 — a zone where buyers have consistently stepped in.
Macro context supports this setup:
The US Dollar has been losing momentum, pressured by rising expectations of a December FED rate cut and increasingly soft economic data. Weak labor market signals, cooler inflation trends, and shifting rate expectations have collectively weighed on the DXY.
A softening USD typically acts as a tailwind for gold, especially in environments where monetary policy is turning more accommodative.
If the Dollar continues to slide, it could provide the catalyst needed for Gold to resume its bullish leg off the 4,110 support zone.
Trade safe,
Joe

ETHUSD – Chart OutlookEthereum is maintaining a clear bullish structure, with price action continuing to form higher highs and higher lows. As long as the current upward momentum remains intact, the market favors continuation toward higher levels.
A potential long opportunity may develop from the 3000 zone, where buyers have shown strong interest previously.
If bullish momentum sustains from this area, the following upside targets can be monitored:
Target 1: 3080
Target 2: 3120
Target 3: 3170–3200 (extended bullish zone)
For risk management, a stop-loss around 2980 is suggested to protect against any downside invalidation.
This outlook is strictly based on market structure and momentum analysis. Always assess price behavior and manage risk according to your trading plan.

BTC - Fast Upside Whipsaw Signals Market CorrectionBitcoin made good nice progress from the 2.772 @ $80K and I do think a HTF bullish pivot is likely to have arrived, but now it has printed an upside whipsaw - it is signalling a potential LTF correction beginning.
If you've been keeping up with my other threads then you'll know there have been signals throughout the market that this was in the pipeline before Bitcoin slumped.
As such I of course took evasive action before this slump and am waiting to buy dips.
If you like my content and perhaps missed my other threads that I'll link below, then do hit the BOOST to let the algorithm know you'd like to receive more content 👍.
This analysis is shared for educational purposes only and does not constitute financial advice. Please conduct your own research before making any trading decisions.
EUR/USD - Battle of supply vs demandIf we look at EUR/USD on the daily chart, we can't deny the fact that it is in a bearish trend since end of september. It is making consistentlly LH and LL with the price action really nice, connecting the supply zone perfectlly and reactiong from them after taking liquidity.
We now face the same situation, with a LH marked and a structure that failed to break the LL. Price retraced back to the HTF supply zone, taking some of the liquidity resting in the supply and right now we are waiting for a clear reaction from the HTF orderflow.
On LTF, the bulls came and created their bullish orderflow, with really nice demand zones protected each time since the failed of breaking the structure.
For now, we have this battle of the supply and demand, bears vs bulls, where we need to be really cautios. I am interested in a more strength in USD even if rate cut decisions are pretty much to happen, i consider that USD can still recover the year loss.
Fractal Structural point of view, we already changed the direction to the downside, a clear reaction from the first liquidity swiped, but we are still inside a LTF demand zone. For me to have a better confluence on shorting and adding to this position would be to see another leg down into the fractal view of the market, and creating the bearish ordeflow to put presher on the buyers. After the bearish orderflow on LTF aligns with the bearish ordeflow on HTF, the ultimate confirmation would be achived and therefore we can se a new leg down.
If the price refuses to make a bearish orderflow, could be that the LTF bullish orderflow can finally push the price into the upside, breaking the supply chain and getting control of a uptrend for EURUSD, leaving both an orderflow with lots of liquidity inside but also a new protected demand zone on HTF.
Follow me for further updates and trade breakdowns.

USDCAD Potential DownsidesHey Traders, in today's trading session we are monitoring USDCAD for a selling opportunity around 1.30600 zone, USDCAD is trading in a downtrend and currently is in a correction phase in which it is approaching the trend at 1.30600 support and resistance area.
Trade safe, Joe.

BTCUSDT 4hr TF - 29th November 2025BTC USDT 4hr TF
As Long as price action remains above the mention support line can expect price to go further up as MACD has flip bullish on daily TF

Bitcoin Only after breakout chanel resistance bull market again Soon we can expect price broke above channel resistance now it is near 93K$ and after that market will face huge gain only.
Step 1: Confirm the Breakout (The "Is It Real?" Check)
Don't buy the first tiny wick above the line. Wait for confirmation to avoid a false breakout:
Daily Close: Wait for a daily candle close (UTC) decisively above the $93K trendline.
Volume Surge: The breakout should be accompanied by significantly higher buying volume than average . This shows conviction.
Follow-Through: The price should hold above the trendline and not immediately fall back in.
Step 2: The Trade Entry Strategy
Aggressive Entry: Buy on the first strong 4-hour or daily close above $93K.
Conservative Entry : Wait for a "retest" of the broken trendline. After breaking out, price often pulls back to touch the former resistance, which should now act as new support. This is a higher-probability, lower-risk entry.
Step 3: MY Bullish Targets - A Realistic Roadmap
my targets are logical and align with measured moves and previous all-time high extensions.
First Target: ~$110,000
This is the first major psychological barrier and would represent a strong resumption of the bull market.
Second Target: ~$120,000 - $125,000
This area is a common 1.618 Fibonacci extension from key swing points and represents the next significant resistance zone.
Extended Target: ~$140,000+
This is the "blue sky" target that comes into play if the bullish momentum becomes parabolic, likely fueled by a FOMO (Fear Of Missing Out) influx of new capital.
DISCLAIMER: ((trade based on your own decision))
<<press like👍 if you enjoy💚

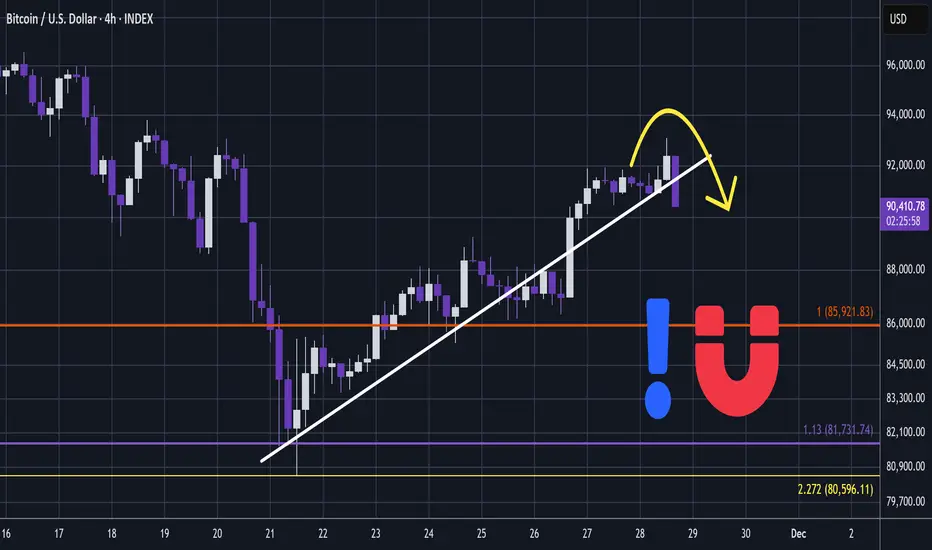
BTC : Channel Breakdown RetestPrice has come back to retest the broken channel and is being rejected again. What matters now is to see if buyers can sustain follow‑through, because that will decide if this is just a relief bounce or the start of a real reversal. For now, it still looks like nothing more than a bounce.
Historically, when Bitcoin reaches oversold territory on the daily RSI, it often forms a bullish divergence rather than reversing immediately on the first oversold tag, price makes a lower low while RSI prints a higher low.
My scenario anticipates another push down in price while RSI refuses to make a new low, creating a classic bullish divergence that frequently precedes strong relief rallies.
This price action still fits my broader strategy, as the current rejection and potential bullish divergence keep the scenario alive for another leg up in December, with upside potential toward at least the 115k
