A Bitcoin Prediction (2025)In this chart, we continue the journey of testing whether Bitcoin can live up to the expectations as published in my previous Bitcoin prediction chart (2024). Since we had technically hit my ATH cycle top for 2024–25, we are now gambling with the possibility that we might not have hit the highest cycle top targets and may just extend that little bit more. I think 2025 has most people asking, "Are we done yet?" or are we on the verge of something else? We'll just have to wait and see....
Upside:
As you can see in ATHs, there are several targets, and I've mentioned this in my previous chart. Ultimately, the high side of what this chart can expect from a cycle high is a 2-week close of $131k. Wicks can extend beyond this price, but I expect a close below (according to this chart). A close above will invalidate this chart. All prices within the lows and highs are acceptable.
Downside:
In my previous chart, I hadn't posted any projected targets during a bear market; I only highlighted the lows, as generally that is what most may consider important enough to know—when can we resume the bull market again? Well, in this chart, I have labeled two additional downside targets. Although these do not follow the same pattern as other targets, they do have a significant similarity to previous cycle lows. Expect bounces from these levels, but if the pattern holds true, they will fail and continue to lower prices. In the short term, resistance sits at $98,511, and again this is on a 2-week close. So this next week, we can wick above, which might be the path we are on.
Summary: I'll be posting updates close to each 2 week close, if I see something I'll be sure to post and update.
2024 Chart linked below.
Community ideas

EURGBP M15 viewRef....idea on EURGBP H4, There's absolutely no confirmation to take longs. I am mainly looking to take shorts if the price is to go up and a possible liquidity grab before the long-term shorts that I look to take; refer to the H4 idea. For now, I would like to see how the market will react to this imbalance when the market opens tomorrow.

XAUUSD Today's Analysis StrategyWe are keeping a close eye on the resistance level of 3260. If the market breaks above 3260, we will look for buying opportunities with a target of 3386.
However, if the market fails to break above 3260 and shows signs of a correction, we will consider selling and may move down to the next support level of 3200.

ETHEREUM New Update (1D)Price has approached a supply (flip) zone. It is not expected to break this zone on the first attempt, and bears are likely to regain control for now.
If Ethereum returns once again to the lower zones marked on the chart, it could present a low-risk opportunity for buy/long positions.
The main target can be the upper supply zone.
A daily candle closing below the invalidation level would invalidate this analysis.
Do not enter the position without capital management and stop setting
Comment if you have any questions
thank you

EURAUD possible short for 1.7150euraud forming lower low and lower high on daily time frame, indication for downtrend. in daily time frame supply zone is quite larger, 1.5760-1.7885. ideal level for short is 1.7820 & 1.7885, stop loss 1.7910. initial target 1.7400, longer term down target is 1.7150.

Oil on high time frame
"Regarding WTI oil, the price trend on high time frames is bearish, especially on the daily chart. After completing its pullback on the 4-hour chart, there are indications of further downside potential.
The market's volatility may be influenced by geopolitical tensions and political factors between Iran and the USA, as well as tariff issues. Despite these fluctuations, candle formations suggest the potential for prices to drop towards the $58 zone."
If you require more assistance or have any specific questions, feel free to ask!

US 10Y TREASURY: rollercoaster, againMarket movements in a previous period are clearly showing how high uncertainty is currently among market participants. The US Treasuries for one more time took the downtrend during the previous week, clearly testing the 4,2% level with 10Y US benchmark, but Fridays better than expected jobs report, was a trigger for a move back toward the higher grounds. The lowest weekly level of 10Y yields was 4,13% on Thursday, however, the rest of the trading week the market was looking at the upside. The strong move up, brought the 10Y yields toward the level of 4,30% where yields have closed the trading week.
The volatility might continue also during the week ahead. The FOMC meeting is scheduled for May 6-7th, while on Wednesday will be the interest rate decision day, and also Fed Chair Powell's address to the public. As per current market expectations, as posted by the CME Group FedWatch Tool, the Fed could leave interest rates unchanged at this meeting, considering stronger than expected jobs data posted during this week. In addition, the market is expecting that the Fed will not change interest rates until their meeting in July. At the same time, analysts are noting that it is too early to see the reflection of trade tariffs in real economy, concretely in jobs data, in which sense, they are taking precaution with current strong jobs data. In this sense, the Fed Chair Powell's speech, after the FOMC meeting will be closely watched by markets, for a standing of Fed on the current state of the US economy as well as their view on tariffs repercussions in the future period.

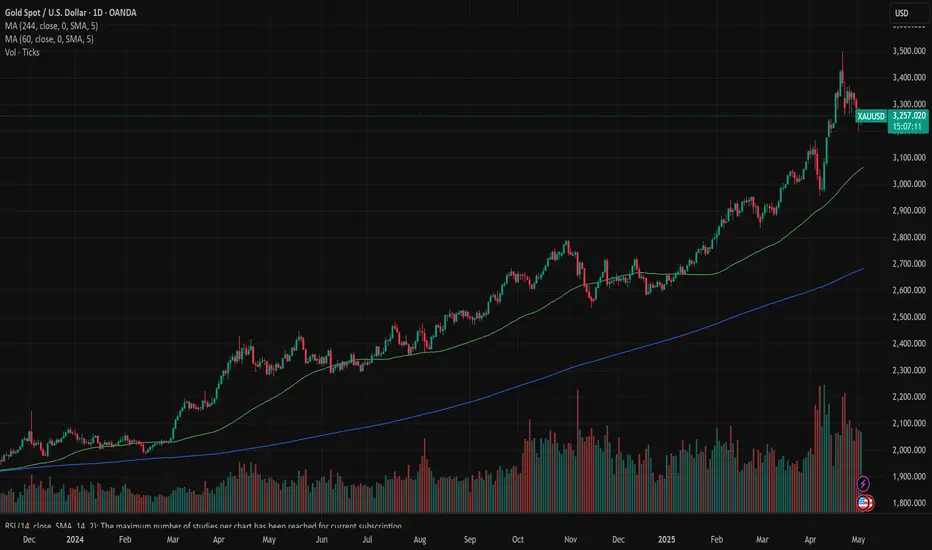
Gold: trade tariffs relaxationAs trade tariffs “war” entered into relaxation mode, so the price of gold was easing during the previous week. The major event concerning trade tariffs during the previous week was the announcement from China's government that they are considering negotiations with the US Administration regarding imposed tariffs. Additional influx came also from better than expected US jobs data, in which sense, gold was trading with a modest negative sentiment during the week. The week started by testing the $3.350 short term resistance line, however, it ended at the level of $3.240.
The RSI turned away from the overbought market side, and ended the week at the level of 53. This level still does not represent a clear sign that the market is ready to take the turn toward the oversold market side. Moving averages of 50 and 200 days, without change, continue to move as two parallel lines with an uptrend.
Fundamentals have driven the price of gold to the ATH in a previous period, so fundamentals will continue to impact the price of gold also in the future period. Trade tariffs were the main driver, so as the trade war is settling down, the price of gold might ease also in the coming period. Gold is currently testing the level from the mid-April this year. In case that it is breached, then the next potential level for gold might be around $3.150. Certainly, it should be considered that the FOMC meeting is scheduled for May 7th, which might bring some volatility back on the market, considering current market sensitivity regarding potential Fed's rate cut. At this moment on charts, the price of gold has equal probabilities for a move both toward the up, and down side.
EURUSD: FOMC rate decisionThe week of macro data in the US started on Tuesday, with Jobs openings data. As per posted data, there have been 7.192M jobs open in March, which was below market expectation of 7,48M. The GDP Growth rate for the Q1 was standing at -0,3% for the quarter, which came as a surprise to the market, which was expecting to see the figure of +0,3%. Analysts are noting that this drop in economic output represents reflection of trade tariffs of the US Administration. The week-end brought the PCE data for March, which was closely watched by market participants, as this indicator represents Fed's favourite inflation indicator. As per published data, the PCE Price index reached 0% in March for the month, and 2,3% on a yearly basis. Figures were in line with market estimates. At the same time, core PCE was also at the level of 0%, beating market estimates of 0,1%. Personal Income in March was increased by 0,5%, while Personal Spending was higher by 0,7%. The ISM Manufacturing PMI in April was standing at 48,7, a bit higher from the forecasted 48. The Non-farm payrolls in April were increased by 177K, which was significantly above the market forecast of 130K. The Unemployment rate was without change from the previous month, at 4,2%.
The GfK Consumer Confidence in May reached the level of -20,6, much better than forecasted -26. The Retail Sales in Germany dropped by -0,2% in March for the month, bringing the total figure to 2,2% on a yearly basis. The slowdown in retail sales was higher from market consensus of 3,2% on a yearly basis. The Unemployment rate in Germany remained stable at 6,3% in April and without change from the previous month. The GDP Growth rate in Germany for Q1 reached 0,2% for the quarter, while it stands at -0,2% compared to the previous year. Both figures were in line with market estimates. At the same time, the GDP Growth rate in the Euro Zone reached the level of 0,4% for Q1 and 1,2% on a yearly basis. The GDP growth rate for the Euro Zone beat market expectations of 0,2% for the quarter and 1,0% for the year. Preliminary inflation rate in Germany in April was 0,4% for the month and 2,1% on a yearly basis. The Inflation rate in the Euro Zone preliminary in April was at the level of 2,2%, while the unemployment rate was steady at the level of 6,2%
The eurusd currency pair was mostly under sentiment of the US jobs data and consequently, its impact on the Fed rate decision in the coming period. In this sense, the US Dollar gained during the week, reaching its highest level at 1,1296 against euro as of the end of the week. The RSI started its move aways from the overbought market side, ending the week at the level of 56. It still does not represent the clear sign that the market is headed toward the oversold market side. The MA50 continues to diverge from MA200, after two lines made a cross, some three weeks ago.
The week ahead is going to be a very important one, considering the Fed's rate decision on Wednesday. Prior and during this day, some increased market nervousness and volatility might be quite possible. Previously, the market was testing the 1,1460, historically important resistance level. There has not been enough market strength for this level to be breached, in which sense, the market reverted a bit toward the downside. Still, the support level at 1,12 has not been tested during the previous week. The 1,13 level historically is not significant, in which sense, it should not be expected that the market will spend too much time around this level. As per current charts, there is higher probability for the 1,12 level, which could easily be the next stop for the eurusd pair. At the same time, there is some probability that the market might return toward 1,1460 to test it for one more time. Charts are not pointing toward the potential of higher grounds, at this moment.
Important news to watch during the week ahead are:
EUR: Retail Sales for March in the EuroZone, Balance of trade in Germany in March, Industrial Production in Germany in March.
USD: ISM Services PMI for April, FOMC Meeting and Interest Rate Decision will be held on Wednesday, May 7th, after which the Fed will held a press conference.

MARKETS week ahead: May 5 – 11Last week in the news
Two major events during the previous week shaped the market sentiment. One is related to the Chinese government which noted a consideration to start the negotiations in order to relax currently imposed trade tariffs, while the other is related to stronger than expected US jobs market. The US equities finished the week higher, where S&P 500 closed the week at the level of 5.686. The US Dollar also gained strength on positive news. Inversely, the price of gold was traded at the lower grounds, ending the week at the level of $3.240. The US 10Y yields reacted on a strong jobs data, diminishing the potential recession in the US, where yields closed the week at the level of 4,30%. BTC was also among weekly gainers, where the level of $ 98K has been tested.
The previous week was full of currently important US macro data, which brought back higher volatility on financial markets. The week started with jobs opening data. Posted JOLTs showed 7.192M jobs open in March, which was modestly below market expectation of 7,48M. Fed's favourite inflation gauge, the PCE Price Index, was standing at the level of 0% in March, same as core PCE. On a yearly basis, the PCE was 2,3%. However, the star of the week were the Non-farm payrolls, which increased by 177K in April, which was much better than anticipated 130K. This figure brought a relief to market participants, as it seems that the US economy is not entering into a recession. On the opposite side are some analysts who are noting that it is too early in time for trade tariffs to be reflected on the US economy and jobs data. Still, the GDP Growth rate preliminary for Q1 came as a surprise at the level of -0,3% for the quarter. The market was expecting to see the figure of +0,3%. Analysts are in consensus that such a surprising drop in the output of the US economy is a reflection of trade tariffs imposed by the US Administration in the previous period.
A lot of investors' attention took the Assembly meeting of Berkshire Hataway, held on Saturday in Omaha, US. As announced, its founder and CEO Warren Buffet will step down from his CEO position as of the end of this year. His place will take Greg Abel, vice chairman of Berkshire Hataway for non-insurance operations. Reflecting on trade tariffs, Warren Buffet strongly criticized, noting “Trade tariffs are an act of war … trade should not be a weapon”.
The FOMC meeting is scheduled to take place on May 6-7th. This meeting will be closely watched by markets, as it is expected that the Fed will provide their current view on the current state of the economy as well as potential negative implications of imposed trade tariffs. As per current market expectations, based on the CME FedWatch Tool, the first rate cut during this year is postponed for July this year, amid currently strong jobs data.
CRYPTO MARKET
The crypto market had another relatively positive week. News related to the potential relaxation of the US-China trade tariffs as well as better than expected US jobs data, left their positive market also on the crypto market. BTC was for one more time in the focus of market participants, however, the majority of other coins was not left behind. Total crypto market capitalization gained 1% compared to the week before, adding $35B to its total market cap. Daily trading volumes were modestly decreased to the level of $106B on a daily basis, from $166B traded the week before. Total crypto market increase from the beginning of this year, currently stands at -9%, with $283B outflow of funds.
The leader of the market during the previous week was BTC. This coin managed to gain more than 2% on a weekly basis, adding total $ 39B to its market cap, but also to the total capitalization of the crypto market. ETH also had a relatively good week, considering gain of 1,15% in value adding $2,5B to its market cap. One of the significant weekly gainers was Monero, with a surge in market cap of 24%, adding $ 1B to the total value. On the opposite side were coins which did not manage to finish the week in green. Market favourite Solana lost 1% in value on a weekly basis, while BNB was last traded down by 1,4%. This week Uniswap ended with a loss of 11,8% on a weekly basis, while Algorand and Filecoin were traded down by around 8%.
There has been sort of increased activity when coins in circulation are in question. Filecoin managed to increase its coins in circulation by 0,4%. IOTAs total coins on the market surged by 0,5%, while Stellar and DASH marked an increase of 0,2%, same as XRP. This week Maker decreased its number of circulating coins by 1,4%.
Crypto futures market
The positive market sentiment continues to be reflected in the crypto futures. Both BTC and ETH futures were traded higher during the previous week.
BTC futures gained in value around 1,5% for all maturities. Futures maturing in December this year managed to pass the $100K level, ending the week at $101.305. At the same time, futures maturing in December next year closed the week at $107.390.
ETH futures were traded higher by around 2% for all maturities. December 2026 ended the week at $1.938. Futures maturing a year later managed to pass the $2K level, closing the week at $2.084.

Market OutlookMarkets looking a little over extended and would be normal to see a pull back soon before resuming to the upside.

MSTR - Next Wave UpJust made a new high.
That is likely a clue of what happens next with Bitcoin.
It was a running 3 wave 1:0.618 Golden Window correction.
That is a weak ratio and ideal for a continuing uptrend.
But most importantly it was a re-test for support:
That dip buy was there to be gobbled up.
If you didn't see it then this probably goes up and up from here 👍.
Not advice

#202518 - priceactiontds - weekly update - nasdaqGood Evening and I hope you are well.
comment: Bulls want at least 20536 now and run all the stops from before the big sell-off. Bears are not doing anything at all, so bulls will likely get it. This could be a breakout-retest and I marked the area for that with the red rectangle. Small chance bears come around next week but for now it’s too early to short and buying into 9 consecutive bull days is statistically beyond moronic.
current market cycle: trading range
key levels: 15500 - 23000 (upper range is a guess, could also become 21000 but for now we don’t know so I assume the higher price)
bull case: 20536 and then 21000. Those are the next targets and bulls are in full control of the market. The measured move from the buy spike at the lows is around 22350 and it’s possible that we get there. I think we need to see a pullback and how deep that will be. If we get only another sell spike and immediate buying for higher highs, we can also assume much higher prices. Above 21100 there is no reason not to go for 23000.
Invalidation is below 19100.
bear case: Bears have nothing. Below 19100 market is neutral but until then, selling this is dumb. Wait for more bears to appear or at least seeing something that resembles a topping pattern. Like a lower high on the 1h chart. Don’t try to be the lucky bear who shorted the exact high.
Invalidation is above 21100.
short term: Neutral. No interest in buying such a buy climax but it’s way too early for shorts. Patience is key.
medium-long term - Update from 2024-04-26: My most bearish target for 2025 was 17500ish. Now I assume we will be in a trading range 16000 - 23000 for much longer.

EURCHF new bearish push expecting
OANDA:EURCHF FALLING WEDGE we are have, in moment its be breaked, price is also be and on trend line with FW, i am expect price will continue pushing, but looks like we will have break of trend line and bounce on sup zone 0.93950
SUP zone: 0.94000
RES zone: 0.92450, 0.92000

GBPCAD - longHi Team ,
For WK19 we have this GC long
Patience is the key guys , nobody will give you 100% a month remember earning just 1% a month beats 99% of retail community
Thank you !

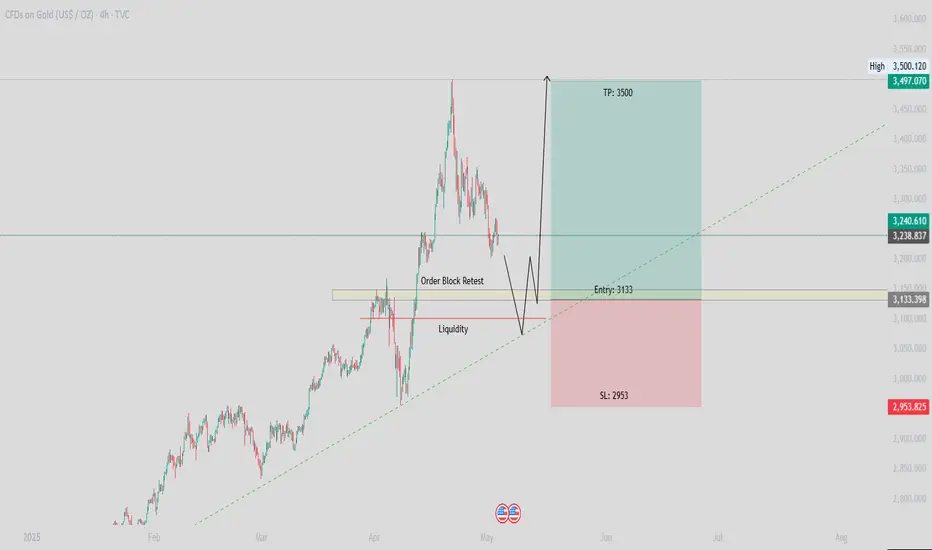
Gold Long Setup - Manipulation Before AccumulationAfter an exceptional rally towards the highs, Gold will be retracing to retest the order blocks, trendline and sweep liquidity of the local lows. I will be looking at longing Gold at 3133 area upon internal liquidity sweep, trendline and order block retest.
Entry: 3133
Target: 3500
Stoploss: 2953
XAUUSD-Bullish reversal analysis technical analysis of Gold Spot (XAU/USD) on the 4-hour timeframe, projecting a bullish outlook. Here's a breakdown of the main ideas conveyed:
1. Support Level & Double Bottom
A strong support level is marked around the 3,177 area, with the price bouncing from it twice (highlighted by two black dots), indicating a potential double bottom pattern, which is typically a bullish reversal signal.
2. EMA 200 Support
The 200 EMA (Exponential Moving Average) lies just below the current price (~3,177), acting as dynamic support. The fact that price is holding above it adds strength to the bullish argument.
3. Bullish Divergence on RSI
The RSI (Relative Strength Index) shows a bullish divergence, where the price made lower lows but RSI made higher lows—another potential reversal indicator.
4. Price Projection
If the bullish move plays out, the chart outlines two upward targets:
Target Point: ~3,501.67
Next Target Point: ~3,729.23
These are based on measured moves from previous impulse legs (shown by vertical blue projections).
5. Entry Setup
The chart suggests a break above the short-term consolidation could trigger the bullish run toward the first target, aligning with bullish price structure and support confirmation.
Overall Idea: The chart expects a bullish reversal from support, confirmed by double bottom, EMA 200 support, and RSI divergence, targeting higher resistance zones.

DLF | Pattern: Bullish RSI DivergenceA clear bullish divergence is visible between price and RSI on the weekly chart:
Price made a lower low
RSI made a higher low (marked with arrows)
This is a strong reversal signal, indicating potential trend change to the upside.
📈 Trade Setup:
Entry: ₹687 (CMP)
1st Target: ₹832.70
2nd Target: ₹941.90
Stop Loss: Below recent swing low
Risk-Reward is favorable, and volume support is visible. RSI has also broken above the 45 level, suggesting strengthening momentum.

GBPCAD - W bottom - 4hr - 100 pip moveFirst post and a complete novice so here goes!
Strong movement down on the 4 hour chart.
Tested 1.83205.
Pulled back and currently retesting the same area.
RSI went below 30 showing its overbought but it is showing bullish divergence which I expect a 100pip move up to complete the W bottom pattern.
What's your thoughts?

EURUSD Shorts?EURUSD has been hinting on bearish momentum with formation of CRT on the weekly timeframe followed by a bearish week prise close...

GOLD SWING XAUUSD took support form bottom - up Line.
All long targets are achieved
This month taking rejection from major resistence,
Let's track the moves from Top down line.
Follow for more swing analysis for INDICES - CURRENCY - COMMODITIES

Retest at 92k?Bitcoin broke above resistance at 95k but the CME gap at 92k remains unfilled which is unlikely to stay that way. Makes a long entry at 92k very attractive as resistance is already broken but no financial advice: Price could also retest 89k or go even lower.

DXY Will Go Up! Buy!
Here is our detailed technical review for DXY.
Time Frame: 5h
Current Trend: Bullish
Sentiment: Oversold (based on 7-period RSI)
Forecast: Bullish
The market is approaching a significant support area 100.036.
The underlined horizontal cluster clearly indicates a highly probable bullish movement with target 100.899 level.
P.S
The term oversold refers to a condition where an asset has traded lower in price and has the potential for a price bounce.
Overbought refers to market scenarios where the instrument is traded considerably higher than its fair value. Overvaluation is caused by market sentiments when there is positive news.
Disclosure: I am part of Trade Nation's Influencer program and receive a monthly fee for using their TradingView charts in my analysis.
Like and subscribe and comment my ideas if you enjoy them!
