USD/JPY Currency Pair Has Stabilised Around the 156.300 LevelThe USD/JPY Currency Pair Has Stabilised Around the 156.300 Level
The ATR indicator is sitting near its lowest readings and is trending downward. This may reflect not only reduced trading activity over the Thanksgiving period in the US, but also uncertainty among currency traders who are weighing the many factors influencing USD/JPY at the moment.
On one hand, the US dollar is being pressured by expectations of a Federal Reserve rate cut, with Fed officials delivering notably dovish comments this week.
On the other hand, the yen’s valuation is being shaped by:
→ the economic stimulus package from Prime Minister Sanae Takaichi;
→ expectations of Bank of Japan intervention to support the weakening yen;
→ geopolitical tensions between China and Japan.
Technical Analysis of USD/JPY
The chart supports the view that the market is balanced.
Using the ascending channel that began forming after USD/JPY broke above the psychological 150 level, we can see that the pair has moved into the lower half of the channel, while the median line has shifted from acting as support to working as resistance (as shown by the arrows).
At present, USD/JPY is compressing into a triangle formed by:
→ the lower boundary — the line dividing the lower half of the channel into quarters;
→ the upper boundary — the descending trendline drawn through last week’s lower highs.
A breakout from this triangle may be sudden and tricky, so the current fall in volatility should not lull USD/JPY traders into complacency. It is entirely possible that after repeated verbal warnings, the Bank of Japan could proceed with direct intervention — an action that would almost certainly break the existing upward channel.
This article represents the opinion of the Companies operating under the FXOpen brand only. It is not to be construed as an offer, solicitation, or recommendation with respect to products and services provided by the Companies operating under the FXOpen brand, nor is it to be considered financial advice.
Community ideas

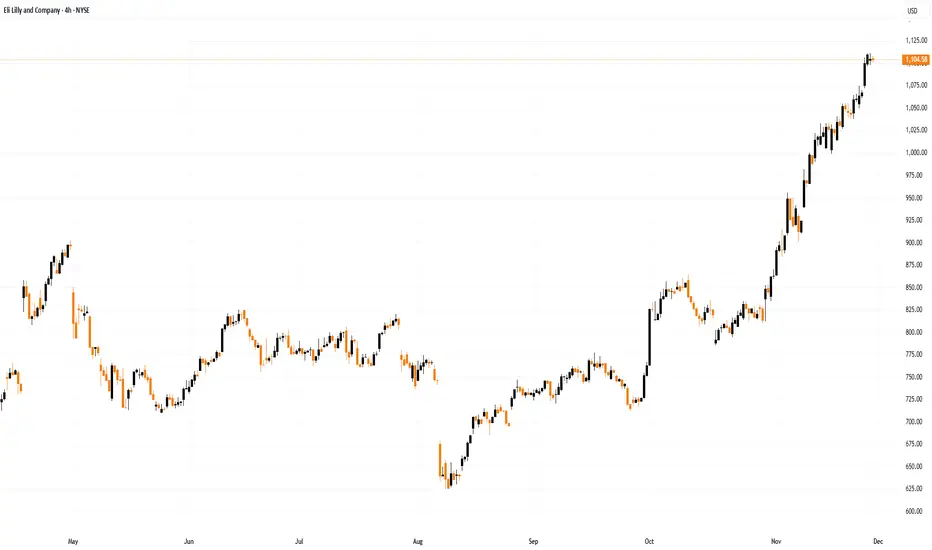
Eli Lilly (LLY) Shares Have Surged by Around 30% in NovemberEli Lilly (LLY) Shares Have Surged by Around 30% in November
The price action of Eli Lilly and Company (LLY), the world’s largest pharmaceutical firm, reflects exceptionally strong demand:
→ since the start of the month, LLY shares have risen by roughly 30%;
→ in late November, the company’s market capitalisation exceeded $1 trillion, making Eli Lilly the first pharmaceutical firm in history to reach this level.
Why are Eli Lilly (LLY) Shares Rising?
A key driver has been the strong earnings report published on 30 October.
→ Earnings per share came in far above expectations ($7.02 versus $5.69).
→ Sales of diabetes treatment Mounjaro and obesity drug Zepbound surpassed $10 billion for the quarter.
→ On the back of this success, management raised its revenue outlook, and market participants now expect an even stronger fourth quarter.
At the same time, the chart is signalling that the extraordinary rally may be running out of steam.
Technical Analysis of Eli Lilly (LLY) Shares
For more than a year, LLY’s price action followed a downward channel. If this channel is extended upward twofold after the bullish breakout (which occurred following the earnings release), we can see that the price has reached the upper boundary of the expanded channel — a level often viewed as a potential target for buyers.
Note that after breaking above the psychological $1,000 level, the rally initially slowed (1), but then accelerated sharply this week (2) — a possible sign of FOMO and the climax of the November uptrend.
Additionally → the RSI indicator is deep in overbought territory and is pointing lower.
Given these factors, it is reasonable to assume that LLY shares are vulnerable to a pullback, which could intensify if investors begin taking profits on long positions.
This article represents the opinion of the Companies operating under the FXOpen brand only. It is not to be construed as an offer, solicitation, or recommendation with respect to products and services provided by the Companies operating under the FXOpen brand, nor is it to be considered financial advice.
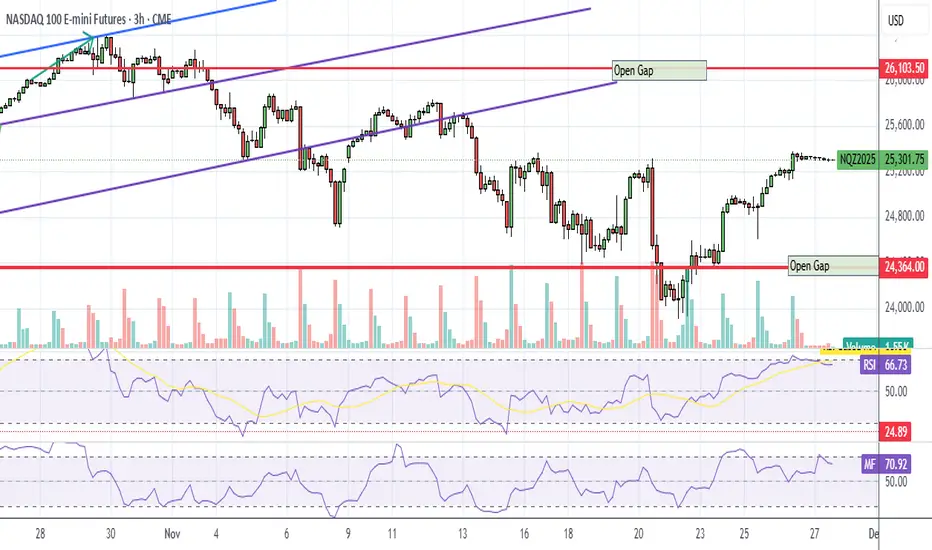
ES Gap AlertIndex futures all threw a gap up on the Thanksgiving break. If it doesn't fill Friday, it'll probably fill Monday.
Don't recommend going long on the half day trading.

NATGAS Free Signal! Sell!
Hello,Traders!
NATGAS is reacting inside a major horizontal supply zone after sweeping local buy-side liquidity. With displacement shifting bearish, a move toward the discounted target zone below becomes likely.
--------------------
Stop Loss: 4.693$
Take Profit: 4.549$
Entry Level: 4.636$
Time Frame: 4H
--------------------
Sell!
Comment and subscribe to help us grow!
Check out other forecasts below too!
Disclosure: I am part of Trade Nation's Influencer program and receive a monthly fee for using their TradingView charts in my analysis.

BTC/USDT: Potential Uptrend and Buying OpportunityBitcoin is creating a buying opportunity as it continues to follow a clear uptrend channel. With support from macroeconomic factors and positive momentum from the cryptocurrency market, BTC/USDT has the potential to move upward strongly.
The chart shows that BTC is currently moving within an uptrend channel, supported by the EMA lines. The recovery from the recent bottom around 86,700 USD and the price moving closer to 91,000 USD indicates that the market is starting to regain upward momentum.
Looking at the current price levels, BTC is approaching an important resistance level at 95,500 USD. If this level is broken, the uptrend could extend, pushing the price to higher levels, potentially reaching 100,000 USD. However, if BTC fails to break through the 95,600 USD level and pulls back to test the 86,700 USD support, this would provide a good buying opportunity before continuing the uptrend.
In summary , BTC/USDT is currently on a strong uptrend, and the buying opportunity remains as the price adjusts back to key support levels. Watch the 86,700 USD level as an ideal entry point to take advantage of the upcoming strong rally.

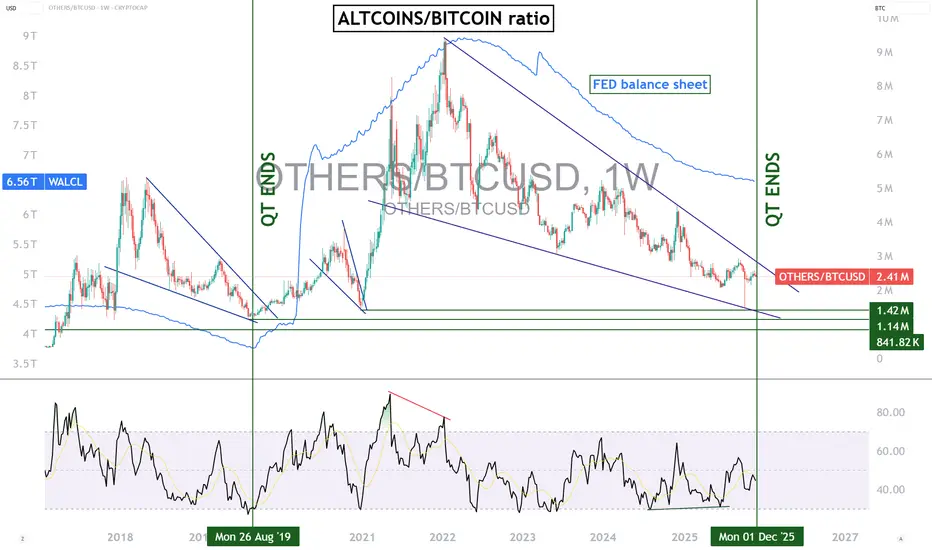
Altcoins, a rebound thanks to the end of the Fed’s QT?The U.S. Federal Reserve is expected to end its quantitative tightening (QT) program starting on December 1, 2025. This prospect raises many questions within the crypto community, particularly regarding the possibility of a scenario similar to that of August 2019, when the end of QT coincided with a renewed strength in the altcoin market relative to Bitcoin. While the comparison is tempting, it nevertheless deserves careful examination.
In 2019, the end of QT marked a turning point: the gradual easing of monetary conditions helped improve investors' risk appetite. The altcoins/BTC ratio then began to rise, reflecting a rotation toward more speculative assets. The macro environment played a role: easing bond yields, greater liquidity, and a still relatively young crypto market where flows could quickly shift.
The situation in 2025 presents some parallels, but also significant differences. On the macroeconomic level, the end of QT could again signal a stabilization of monetary policy, or even a transition toward a less restrictive stance. In this context, renewed interest in riskier assets — including altcoins — remains plausible. Historically, phases of Fed balance-sheet expansion or slowing contraction have often supported overall liquidity, which can benefit cryptocurrencies.
However, several factors temper this analogy. First, the crypto market is now more structured and institutionalized than in 2019. Bitcoin occupies a much stronger place as a macro-correlated asset, supported by the presence of ETFs and growing institutional recognition. This dynamic may limit, at least partly, the massive capital rotation into altcoins observed in previous cycles.
Second, altcoins themselves now evolve in a far more competitive landscape than six years ago. Market "natural selection" could slow down a homogeneous rise: some projects may benefit far more than others.
Ultimately, the end of QT in December 2025 could create a more favorable environment for a relative outperformance of altcoins versus Bitcoin, similar to 2019. But this scenario will depend on many macroeconomic, structural, and crypto-specific factors. Analytical caution therefore remains essential, even if the end of the Fed's QT is clearly a theoretically positive factor for altcoins.
DISCLAIMER:
This content is intended for individuals who are familiar with financial markets and instruments and is for information purposes only. The presented idea (including market commentary, market data and observations) is not a work product of any research department of Swissquote or its affiliates. This material is intended to highlight market action and does not constitute investment, legal or tax advice. If you are a retail investor or lack experience in trading complex financial products, it is advisable to seek professional advice from licensed advisor before making any financial decisions.
This content is not intended to manipulate the market or encourage any specific financial behavior.
Swissquote makes no representation or warranty as to the quality, completeness, accuracy, comprehensiveness or non-infringement of such content. The views expressed are those of the consultant and are provided for educational purposes only. Any information provided relating to a product or market should not be construed as recommending an investment strategy or transaction. Past performance is not a guarantee of future results.
Swissquote and its employees and representatives shall in no event be held liable for any damages or losses arising directly or indirectly from decisions made on the basis of this content.
The use of any third-party brands or trademarks is for information only and does not imply endorsement by Swissquote, or that the trademark owner has authorised Swissquote to promote its products or services.
Swissquote is the marketing brand for the activities of Swissquote Bank Ltd (Switzerland) regulated by FINMA, Swissquote Capital Markets Limited regulated by CySEC (Cyprus), Swissquote Bank Europe SA (Luxembourg) regulated by the CSSF, Swissquote Ltd (UK) regulated by the FCA, Swissquote Financial Services (Malta) Ltd regulated by the Malta Financial Services Authority, Swissquote MEA Ltd. (UAE) regulated by the Dubai Financial Services Authority, Swissquote Pte Ltd (Singapore) regulated by the Monetary Authority of Singapore, Swissquote Asia Limited (Hong Kong) licensed by the Hong Kong Securities and Futures Commission (SFC) and Swissquote South Africa (Pty) Ltd supervised by the FSCA.
Products and services of Swissquote are only intended for those permitted to receive them under local law.
All investments carry a degree of risk. The risk of loss in trading or holding financial instruments can be substantial. The value of financial instruments, including but not limited to stocks, bonds, cryptocurrencies, and other assets, can fluctuate both upwards and downwards. There is a significant risk of financial loss when buying, selling, holding, staking, or investing in these instruments. SQBE makes no recommendations regarding any specific investment, transaction, or the use of any particular investment strategy.
CFDs are complex instruments and come with a high risk of losing money rapidly due to leverage. The vast majority of retail client accounts suffer capital losses when trading in CFDs. You should consider whether you understand how CFDs work and whether you can afford to take the high risk of losing your money.
Digital Assets are unregulated in most countries and consumer protection rules may not apply. As highly volatile speculative investments, Digital Assets are not suitable for investors without a high-risk tolerance. Make sure you understand each Digital Asset before you trade.
Cryptocurrencies are not considered legal tender in some jurisdictions and are subject to regulatory uncertainties.
The use of Internet-based systems can involve high risks, including, but not limited to, fraud, cyber-attacks, network and communication failures, as well as identity theft and phishing attacks related to crypto-assets.
BTCUSDT.PA safe and sound plan has been marked on the chart on 1 day TF.
It might take long time but as soon it will drop to our zone and we see some bullish momentum we are in definitely.
Trading is only patience we cannot just move with moving line.
We need the price to act as we need and once the price starts acting as we decided than it will go where we want to see.
Have a good trading.
Trade once or twice a month is better than trading whole day 24/7.
Make it a peace of mind not stress.
Follow for more.

BTCUSD - Wave 5 Decline Still Likely AheadPrevious Analysis:
BTC is approaching a critical reaction zone where the current rise looks more like a corrective push than the start of a new trend. Price is moving toward the highlighted supply region, which aligns with a potential wave 4 completion inside the descending channel. The structure from the recent low shows an internal a–b–c formation, suggesting this bounce could run into exhaustion as it enters the red zone. Unless BTC breaks out of the channel with conviction, the broader momentum still leans bearish. A rejection from this region would likely trigger the final wave 5 leg, driving price toward deeper Fibonacci levels and completing the corrective cycle before any meaningful recovery attempt can begin.
Stay Tuned!
@Money_Dictators

TradeCityPro | Bitcoin Daily Analysis #233👋 Welcome to TradeCity Pro!
Let’s dive into today’s Bitcoin analysis. The market is moving upwards today, and yesterday, the long triggers we discussed were activated.
⏳ 1-Hour Timeframe
In yesterday’s analysis, I mentioned that Bitcoin was sitting at its momentum support zone in RSI. I also pointed out that if the RSI was supported at this level, the bullish momentum would be revived in the market.
⭐ This is exactly what happened. With the RSI support, buying volume entered the market, and after breaking the 87,942 level, we had our first long entry trigger.
✔️ The reason for this early entry, as mentioned in yesterday's analysis, was that we had confirmation of momentum from the RSI. This allowed us to enter the position earlier than waiting for the 89,000 level to break.
💥 The second main trigger for Bitcoin was the break of the 89,000 level, which happened with a strong bullish candle. If you didn’t have a stop buy order, you likely missed the chance to open the position.
💡 Currently, after breaking this level, the price has shown some weakness and reacted to the 91,581 zone, with the RSI moving out of the overbought zone.
📊 The volume during the last few green candles was low, and now, with the red candles, the volume is increasing.
⚖️ If the correction continues and becomes deeper, the price might pull back to the 89,000 zone. However, as long as the price remains above 89,000, I believe the short-term market trend will remain bullish, and a deeper downward leg is not expected on higher cycles.
💫 We can use the 89,000 level as a short trigger for the next bearish wave in the market.
🎲 In this case, the main support zones to watch are 86,614 and 82,214.
📈 For long positions, today, if Bitcoin breaks above 91,581, we can open a position. However, there is a very important resistance at the 93,555 level, which is the main trigger for confirming the bullish trend. It’s better to wait until this level is broken before actively pursuing a long position.
❌ Disclaimer ❌
Trading futures is highly risky and dangerous. If you're not an expert, these triggers may not be suitable for you. You should first learn risk and capital management. You can also use the educational content from this channel.
Finally, these triggers reflect my personal opinions on price action, and the market may move completely against this analysis. So, do your own research before opening any position.


QUBT to hit 40-50 by mid January I am bullish on QUBT because the company just proved it is gaining real traction at the same time the US government is showing strong interest in domestic quantum and photonic technologies. QUBT now has major customers, including a top five US bank and a Fortune level defense tech company, and it has more than one point five billion dollars in cash to scale its foundry and quantum systems. The new partnership with POET opens a second high growth market in AI datacenter photonics, which gives QUBT a valuable new revenue path while still keeping quantum computing at the core of its roadmap. This combination of growing commercial demand, government alignment, and dual exposure to quantum and AI photonics creates a much stronger long term setup than the stock has ever had before.
Given the nature of volatility with quantum stocks and how their are hyper cyclical I would get some hedge puts in case for the same date at a strike of 8-9$ in case of bearish actions

JP225 Layered Buy Plan – Institutional Pullback Zone MappedJP225 – Index Market Trade Opportunity Guide (Swing Trade)
🔥 TRADE PLAN OVERVIEW
The current structure shows bullish confirmation supported by:
✔️ 200 Simple Moving Average pullback (strong trend continuation zone)
✔️ SuperTrend ATR line pullback (momentum still on the buy side)
Both indicators align to show buyers defending higher-timeframe demand, giving us a clean structure to execute a layered entry strategy.
🎯 ENTRY PLAN – THIEF LAYERING STRATEGY
This setup uses the classic Thief multi-layered limit order method, allowing traders to scale into the move with controlled risk.
💰 Buy-Limit Layers (example levels):
49200.0
49600.0
49800.0
(You can add more layers according to your own capital and risk structure.)
This structure spreads risk, improves average entry, and lets the market come to you instead of chasing candles.
🛡️ STOP LOSS (Risk Section)
🟥 Thief SL: 48500.0
Dear Ladies & Gentleman (Thief OG’s):
This SL is my version of protection, but you must adjust your own SL based on your personal risk, capital size, and strategy rules.
Use this only as a reference, not a strict rule.
🎯 TAKE PROFIT (Exit Section)
Targeting the POLICE BARRICADE zone – a well-known strong resistance area where:
Supply increases
Price becomes overbought
Trap formations tend to emerge
📈 Primary TP: 52500.0
Dear Ladies & Gentleman (Thief OG’s):
Again, this TP is my version. You can take profits earlier, later, or scale out depending on your risk tolerance. Trade wisely and escape with profits before the police arrive.
🌐 RELATED PAIRS TO WATCH (Correlation Guide)
Monitoring correlated markets gives early signals of strength or weakness in JP225. Here are key pairs:
1️⃣ USDJPY ( FX:USDJPY )
JP225 generally rises when USDJPY rises because a stronger yen hurts Japanese exporters.
If USDJPY stays bullish, JP225 usually maintains upside momentum.
2️⃣ Nikkei Futures ($NKD or CME JP225)
Directly correlated.
Futures breaking resistance often lead the cash market.
3️⃣ US30 ( CAPITALCOM:US30 ) & SPX500 ( SP:SPX )
Global risk sentiment drives JP225.
When US indices rally, JP225 tends to follow with bullish continuation.
4️⃣ VIX Index ( TVC:VIX )
Higher VIX = fear = pressure on JP225
Lower VIX = bullish environment favorable for your long plan
5️⃣ USD Index ( TVC:DXY )
Strong DXY → may pressure JP225
Weakening DXY → supportive for risk assets globally
📌 SUMMARY
The JP225 is setting up a structured bullish swing pattern supported by two strong technical confluences (200 SMA + SuperTrend ATR pullback).
The multi-layer Thief entry strategy gives flexibility and safety while positioning for a potential ride toward 52500.
Trade safe, scale smart, and execute with discipline.
Good luck, Thief OGs! 🚀📈

Bullish Divergence detected.OCTOPUS Analysis
CMP 44 (28-11-2025 04:10PM)
Bullish Divergence detected.
Immediate Resistance is around 44 - 45
47 - 49 can be touched if
it is not in a mood to start uptrend.
& Breaking 42 will result the price further
down towards 37 - 38.

btc.d update this is looking really good on the higher time. all we are waiting for is conformation on the smaller time frames to see if we we do get dominance i will expect to see a flip in alt season while btc is going up alts will be going up as well. i will update as soon as i see conformation on smaller times,but this looks good with a confluence of support. if this plays out all we are doing is really testing support and creating a floor now all we need is conformation for a break out.

GBP/CAD - H1 - UK Budget Boosts!📝 Description & Technical Setup FX:GBPCAD
GBP/CAD is trading inside a strong Ascending Broadening Wedge, showing bullish momentum with higher highs & higher lows.Price is currently holding above the trendline and Ichimoku support, indicating continued upward strength.
We expect a bullish continuation toward the next resistance levels after price breaks and sustains above the minor consolidation.
🟩 Resistance Levels
1st Resistance: 1.86736
2nd Resistance: 1.87198
🔥 Fundamental Update – 27 Nov 2025
1️⃣ UK Budget Surplus Boosts GBP - The UK government's Budget provided more extra money than expected, allowing the government to cover expenses & debts more comfortably.
➡ This increases fiscal stability, boosting investor confidence in the Pound.
#gbpcad #forex #forextrading #priceaction #technicalanalysis #chartanalysis #fxsignals
#tradingviewanalysis #forexsetup #ukbudget #poundsterling #canadiandollar
⚠️ Disclaimer
This is not financial advice.
Market conditions can change rapidly — always manage your risk & use stop-loss.
🙏 Support the Analysis
If you found this helpful, please Like ❤️ & Comment 💬 — it motivates me to post more high-quality setups daily!
Disclosure: I am part of the Headway Influencer Program for my chart analysis.

SUI — This Chart Still Wants HigherAlright, guys.
SUI is holding its bullish structure perfectly. The chart looks like it’s loading energy for the next move, and the momentum is still on the bulls’ side.
Here are my levels:
🎯 Target 1: 1.66
🎯 Target 2: 1.78
🎯 Target 3: 1.92
❌Invalidation:
Close below 1.54 → idea cancelled, bears take control.
🤑Risk/Reward:
• To T1: ~3R
• To T2: ~6.5R
• To T3: ~10R+
The setup speaks for itself — small risk, big potential.
⚠️Not financial advice, trade at your own risk, manage your leverage.
As long as price stays above the cancel zone, I’m looking up. Let’s see how far SUI decides to run.

BTCUSD: Buyers Preparing for a Move Toward $90,000Hello everyone, here is my breakdown of the current Bitcoin setup.
Market Analysis
BTCUSD continues to recover after a prolonged downtrend, where the market consistently respected the descending Trend Line and formed a series of Range structures. Each range acted as a consolidation phase inside the broader bearish movement, with multiple breakdowns continuing the trend to the downside. Despite occasional bullish breakouts, none of them were strong enough to reverse the bearish structure, leading to further declines. Eventually, price reached the Support Zone around $84,000–$85,000, where the market produced a fake breakdown, signaling initial buyer activity. This fake breakout formed a local bottom that became the base for a reversal attempt. Following this reaction, BTCUSD began forming an Upward Channel, marking a shift in market structure from bearish to early-stage bullish. Inside this channel, price has started to create higher highs and higher lows—an essential signal of growing bullish momentum. The structure remains clean and technical: every pullback respects the lower boundary of the channel, while short impulses are reaching toward the midline of the structure. Buyers are gradually gaining control.
Currently, BTCUSD is stabilizing above the Support Zone while trading near the lower half of the ascending channel. As long as price respects this channel structure, sentiment remains bullish. The key area ahead is the Resistance Zone around $90,000, which previously acted as a pivot point and rejected bullish attempts multiple times. A clean breakout above this zone would confirm broader bullish strength.
Scenario & Strategy
I expect BTCUSD to continue moving inside the Upward Channel, gradually approaching the $90,000 Resistance Zone. A retest of this area is the most probable outcome if buyers maintain control. Short-term corrections may occur as the price approaches resistance, but overall structure favors a bullish continuation. A confirmed breakout above $90,000 could trigger a stronger move toward higher targets, opening the way for a larger trend reversal. This level remains the key barrier for buyers in the short and medium term.
However, if BTCUSD breaks down from the Upward Channel and falls below the $84,000 Support Zone, the bullish scenario becomes invalid. Such a move would likely signal a deeper correction or a return to bearish conditions. For now, buying the dips within the channel remains the more favorable approach as long as the structure stays intact and buyers continue defending support.
That's the setup I'm tracking. Thank you for your attention, and always manage your risk.

NQ UpdateOdd that MFI went up on no movement
At this point, I'm mostly cash. My favorite long play was GM calls, and that looks topped out.
Not sure about NQ, but I think ES will double top, so no put options for now. I did think about buying GM puts but decided not to.
NZDUSD Will Go Higher! Buy!
Here is our detailed technical review for NZDUSD.
Time Frame: 9h
Current Trend: Bullish
Sentiment: Oversold (based on 7-period RSI)
Forecast: Bullish
The market is testing a major horizontal structure 0.571.
Taking into consideration the structure & trend analysis, I believe that the market will reach 0.577 level soon.
P.S
We determine oversold/overbought condition with RSI indicator.
When it drops below 30 - the market is considered to be oversold.
When it bounces above 70 - the market is considered to be overbought.
Like and subscribe and comment my ideas if you enjoy them!

#Nifty directions and levels for Nov 27th:Good morning, friends! 🌞
Here are the market directions and levels for Nov 27th:
The global market (based on the Dow Jones) has shown a moderately bullish sentiment,
while the local market is also displaying a moderately bullish tone. Yesterday, the Dow Jones continued its pullback.
However, GIFT Nifty indicates a neutral to slightly positive opening.
What can we expect today?
The structure suggests a continuation of the rally.
So, if the market starts with a strong bullish candle structure, we can expect a further long rally.
On the other hand, if it starts with gradual movement and faces rejection near the immediate resistance,
we can expect a 23% to 38% correction in the minor swing.
Let’s look at the chart:
Current view:
If the market shows a gradual pullback and faces rejection near the resistance zone, we can expect at least a 23% to 38% retracement of the recent minor swing. This view also applies if the market starts the day with a decline.
Alternate view:
If the market opens with a strong bullish candle and breaks the immediate resistance, we can expect the rally to extend further. The same logic applies if the market first consolidates near the resistance zone and then breaks above it after that consolidation; in that case, a further strong rally is also likely.

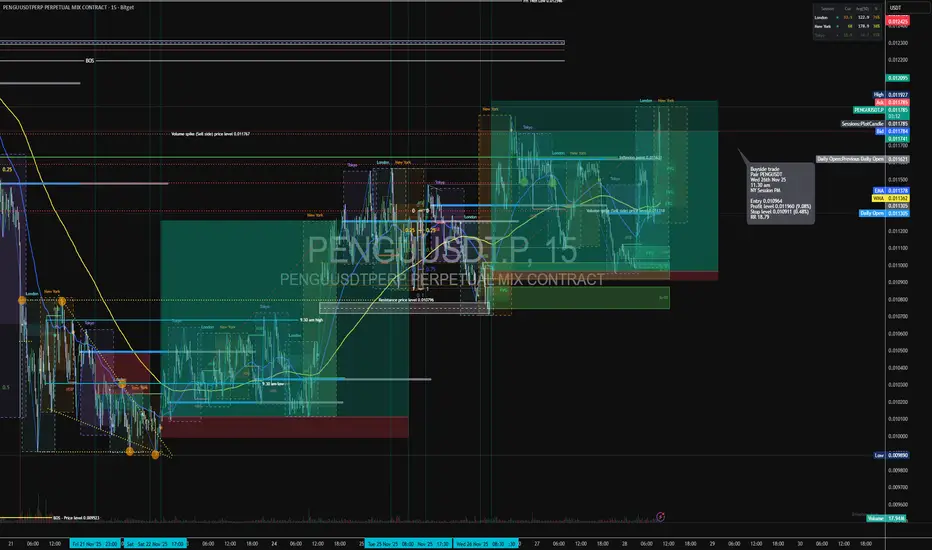
Long trade
🟦 Trade Details
Direction: Buyside Trade
Pair: PENGUSDT
Date: Wed 26th Nov 25
Time: 11:30 am
Session: NY Session PM
🟩 Execution Metrics
Entry: 0.010964
Take Profit: 0.011960 (+9.08%)
Stop Loss: 0.010911 (–0.48%)
Risk-to-Reward: 18.79
🟧 Market Structure Context
Price respects session highs/lows across London → NY transitions.
Prior sell-side sweep brought price into a discount where buyers stepped in.
Clear BOS to the upside confirms bullish orderflow.
NY PM continuation aligns with earlier accumulation from London.
🟥 Liquidity Narrative
Liquidity engineered beneath 0.01090 levels.
Strong reaction from:
Volume spike (sell-side)
Session liquidity pools
Open-to-close inefficiencies
Final draw on liquidity targets:
The inefficiency above 0.01190
Session equal highs in premium
🟪 PD Arrays / POIs
Price retraced into:
FVG (discount zone)
PMD retracement alignment
NY PM bullish re-pricing zone
POI validated with rejection from previous Daily Open zone.
🟨 Entry Model
Entry taken on 15-minute confirmation after:
Micro BOS
Retest into discount FVG
Strong PM session displacement
Clear continuation model (ICT-style buyside draw)
🟫 Sentiment
Strong market interest, rising volatility into NY PM.
Volume confirming active accumulation.
Micro-cap rotational sentiment supportive of fast expansion moves.
🟩 Outcome
A high-probability, high-RR continuation trade.
Clean narrative: Sell-side sweep → Discount entry → BOS → Expansion to buyside inefficiency.
Defining Sustainable Finance and Its Importance in the Economy Introduction
In the twenty-first century, finance is no longer viewed solely as a mechanism to generate profits; it is increasingly recognized as a tool for shaping sustainable development. Sustainable finance has emerged as a critical concept that integrates environmental, social, and governance (ESG) considerations into financial decision-making. The growing awareness of climate change, social inequalities, and corporate governance failures has compelled governments, investors, and financial institutions to rethink traditional finance models. Sustainable finance represents the convergence of economic performance with social responsibility and environmental stewardship, seeking to ensure long-term value creation while safeguarding planetary and societal well-being.
Defining Sustainable Finance
Sustainable finance can be broadly defined as the process of making investment decisions, lending, and financial activities that consider environmental, social, and governance factors alongside traditional financial analysis. Unlike conventional finance, which primarily focuses on risk-adjusted returns, sustainable finance emphasizes aligning financial flows with sustainable development objectives. These objectives are often guided by international frameworks such as the United Nations Sustainable Development Goals (SDGs) and the Paris Agreement on climate change.
At its core, sustainable finance encompasses a wide range of practices, including green finance, social finance, responsible investing, and impact investing:
Green Finance: Financial activities aimed at supporting environmentally sustainable projects, such as renewable energy, energy efficiency, and low-carbon infrastructure.
Social Finance: Investments that address social challenges, including education, healthcare, affordable housing, and community development.
Responsible Investing: Integrating ESG factors into investment decisions to mitigate risks and create long-term value.
Impact Investing: Targeting measurable social and environmental impacts alongside financial returns.
By combining financial and non-financial criteria, sustainable finance seeks to redirect capital flows towards projects that contribute positively to society and the environment.
The Evolution of Sustainable Finance
Sustainable finance is not an entirely new concept but has evolved significantly over the past few decades. Initially, financial markets were primarily concerned with short-term profits, often neglecting the broader consequences of investment decisions. However, increasing global environmental crises, social inequalities, and corporate scandals highlighted the limitations of a profit-centric model. The 2008 financial crisis further underscored the need for more resilient and responsible financial systems.
In response, international organizations, regulators, and investors began promoting sustainability-oriented frameworks. The Principles for Responsible Investment (PRI), established in 2006, encouraged asset owners to integrate ESG considerations into their investment practices. Similarly, the Task Force on Climate-related Financial Disclosures (TCFD), created in 2015, aimed to improve transparency around climate risks in financial reporting. Over time, these initiatives have evolved into a broader movement that seeks to embed sustainability into the very fabric of financial markets.
Key Components of Sustainable Finance
Sustainable finance involves several interconnected components that ensure financial activities contribute to sustainable development:
Environmental Considerations: Addressing climate change, pollution, biodiversity loss, and resource depletion. Financial institutions assess how their investments impact the environment and prioritize projects that promote ecological balance.
Social Considerations: Promoting social equity, human rights, labor standards, and community well-being. Investments in social infrastructure, healthcare, education, and inclusive growth are examples of socially responsible finance.
Governance Considerations: Ensuring transparency, accountability, ethical conduct, and robust risk management. Good governance minimizes financial and reputational risks while fostering trust in financial institutions.
Risk Management and Long-Term Value Creation: By integrating ESG factors, sustainable finance enables investors and institutions to anticipate and mitigate long-term risks, including regulatory changes, environmental liabilities, and social unrest. This approach enhances the resilience of financial portfolios and promotes sustainable economic growth.
Importance of Sustainable Finance in the Modern Economy
Promoting Environmental Sustainability:
Climate change poses a significant threat to global economies, with natural disasters, resource scarcity, and rising temperatures affecting industries and communities. Sustainable finance channels investments into renewable energy, green infrastructure, and low-carbon technologies, facilitating the transition to a sustainable economy. By doing so, it reduces environmental risks and supports global efforts to combat climate change.
Fostering Social Development:
Sustainable finance emphasizes the social dimension of investments, ensuring that capital allocation addresses societal challenges. Investments in healthcare, education, affordable housing, and inclusive growth improve living standards and reduce inequalities. By promoting social development, sustainable finance strengthens communities and enhances economic stability.
Enhancing Corporate Responsibility and Governance:
Incorporating ESG criteria encourages corporations to adopt responsible business practices. Companies with strong governance and ethical practices are less prone to scandals, regulatory penalties, and reputational damage. Sustainable finance incentivizes accountability and transparency, contributing to more stable and trustworthy financial markets.
Reducing Systemic Financial Risks:
Environmental and social risks are increasingly recognized as material financial risks. Climate-related disasters, resource depletion, and social unrest can disrupt markets and lead to financial losses. Sustainable finance provides a framework for assessing and managing these risks, reducing the likelihood of systemic crises and ensuring long-term financial stability.
Aligning with Global Development Goals:
Sustainable finance aligns financial flows with the SDGs, promoting inclusive and equitable growth. By supporting projects that address poverty, inequality, clean energy, and responsible consumption, it fosters sustainable economic development and contributes to a more equitable global economy.
Driving Innovation and Economic Competitiveness:
Sustainable finance encourages investment in innovative technologies and sustainable business models. Companies focusing on renewable energy, circular economy solutions, and green technologies gain a competitive advantage. This drives economic growth, creates jobs, and fosters innovation, making economies more resilient to future challenges.
Attracting Responsible Investors:
Investors increasingly seek ESG-compliant opportunities as awareness of sustainability risks grows. Sustainable finance attracts institutional investors, pension funds, and socially conscious individuals, enhancing capital availability for sustainable projects and reducing the cost of capital for responsible enterprises.
Challenges and Future Prospects
Despite its importance, sustainable finance faces several challenges. Standardization of ESG metrics remains a significant issue, as inconsistent reporting makes it difficult to assess sustainability performance. Additionally, greenwashing—misrepresenting investments as environmentally or socially responsible—undermines trust. Regulatory frameworks vary across countries, creating barriers to cross-border sustainable investments.
Nevertheless, the future of sustainable finance looks promising. Governments and regulators are increasingly mandating ESG disclosures, while technological advancements in data analytics and blockchain improve transparency. As awareness grows, sustainable finance is expected to become a mainstream component of financial markets, reshaping investment strategies and corporate behavior.
Conclusion
Sustainable finance represents a paradigm shift in the modern economy, where financial decisions are no longer isolated from social and environmental considerations. By integrating ESG factors into investment and lending practices, sustainable finance addresses pressing global challenges, including climate change, inequality, and corporate governance failures. It promotes long-term economic resilience, attracts responsible investment, and aligns financial markets with global development objectives.
In an era marked by uncertainty and complex global challenges, sustainable finance is not merely a moral imperative—it is an economic necessity. Its growth signals a future where finance serves as a catalyst for sustainable development, ensuring that economic prosperity goes hand in hand with social well-being and environmental stewardship. The adoption of sustainable finance principles will ultimately determine the capacity of economies to thrive in a rapidly changing world, making it a cornerstone of modern economic policy and practice.

BTCUSD downtrend continuation resistance at 98,240The BTCUSD currency pair continues to display a bearish outlook, in line with the prevailing downward trend. Recent price action suggests a corrective pullback, potentially setting up for another move lower if resistance holds.
Key Level: 98,240
This zone, previously a consolidation area, now acts as a significant resistance level.
Bearish Scenario (rejection at 98,240):
A failed test and rejection at 98,240 would likely resume the bearish momentum.
Downside targets include:
87,066 – Initial support
84,880 – Intermediate support
82,220 – Longer-term support level
Bullish Scenario (breakout above 88,530):
A confirmed breakout and daily close above 98,240 would invalidate the bearish setup.
In that case, potential upside resistance levels are:
100,127 – First resistance
102,450 – Further upside target
Conclusion
BTCUSD remains under bearish pressure, with the 98,240 level acting as a key inflection point. As long as price remains below this level, the bias favours further downside. Traders should watch for price confirmation around that level to assess the next move.
This communication is for informational purposes only and should not be viewed as any form of recommendation as to a particular course of action or as investment advice. It is not intended as an offer or solicitation for the purchase or sale of any financial instrument or as an official confirmation of any transaction. Opinions, estimates and assumptions expressed herein are made as of the date of this communication and are subject to change without notice. This communication has been prepared based upon information, including market prices, data and other information, believed to be reliable; however, Trade Nation does not warrant its completeness or accuracy. All market prices and market data contained in or attached to this communication are indicative and subject to change without notice.
