Parabolic

BTC Parabolic Rise|Correction?Volume Climax and Key Resistance Hello Traders !
Quick Update on Bitcoin!
What a move for BTC from its critical support zone (noted on previous chart)! Price is now trading around major resistance; will a correction be more probable from here or a continuation of the parabolic trend?
Points to consider
- Trend still parabolic
- Testing major structural resistance
- Local resistance at .236 Fibonacci level
- Stochastics topping out
- RSI in overbought territory
- EMA’s yet to meet price
- Volume climax
BTC has had an insane parabolic rise with extreme bull volume taking out key resistance levels, negating the overall market structure…
Price is now testing structural resistance, now potential support if bulls are able to hold this level successfully; this will more likely then confirm a continuation. Local resistance is in confluence with the .236 Fibonacci level, sellers are looking very strong above that area due to the long wicks.
The Stochastics is currently topping out, no real clear direction as it can stay in upper region for an extended period of time. RSI is quite overbought; a correction will help cool it off.
EMA’s are yet to meet price, it must hold price as support to confirm a continuation of the trend, however it does have a long distance to meet price. We also have an extreme volume climax bar, which signals that, a temporary top maybe in for bitcoin…
Overall, IMO, a correction may be more probable, but it’s too early to tell, we need price to mature a little more. Consolidation in the orange box will allow the indicators to cool off and confirm support of a key level. However if this level breaks, then we are more to test the .6181 Fibonacci level.
What are your thoughts?
Please leave a like a comment,
And remember,
It does not matter how slowly you go as long as you do not stop.”Confucius

20191015 XRPEUR 4 Stage of Parabolic Move at 4 hours completedHi there,
Price just reached 4 stage of a parabolic movement at 4hs Chart. Besides, it was stopped of a Chuvashov Fork Line comming from past and from 1D Chart.
Every Colored line is an indicator for parabolic movement. When one of the lines are broken, the one before serves as support line.
Probably would try to go back to supply zone before breakout and retest to continue uptrend.
Cheers.
Charter X

Ethereum parabolic fractal patternHello friends, welcome to my chart.
Looking at the chart, ETH is testing multiple times the red line resistance. and the parabolic move up is expected.

Bitcoin Parabolic Since 2013, but this months close could??As you can see on the chart Bitcoin has been in a monthly parabolic curve since 2013. This months candle is testing the trend and the close will tell are we going up or finally break the six year curve. Let me know your thoughts!

BTC Price Prediction - UpdateBTC giant symmetrical triangle correlates with parabolic trend we have held since genesis.
Many times we breakout down from descending triangle only to continue parabolic.
Don't lose hope.

ICXBTC BullishICXBTC is breaking Ascending triangle. All important value like Take profits, Stop loss, Resistance you can see in chart! Potential profit 10% - 15% !

Bitcoin Short to 50, 100, and 200 EMAJust as the title says I am looking to enter short on Bitcoin until the Daily 50, 100, and 200 EMA's: that gives us 6550, 7659, and 9014 as our targets respectively.
Generally on retracements of this size Bitcoin has reached or breached the 100 EMA but often fails to reach the 200.
The Daily Ichimoku Cloud Tenkan and Kijou give us support around the $7,000 mark.
I will be looking to enter on spot and margin longs between the 200 ($6,550) and 100 ($7,659). I have been shorting since the 11-12k area.
At the time of publication Bitcoin has just breached the 20 EMA of $10,375, which has generally held up the price on every touch since we started the bull run at 4k.
On June 26th, 2019 Bitcoin reached a high of $13,868.44 on CoinBase and Daily RSI reached a level of 91.56 signalling that we were approaching far overbought levels. I began shorting above $11,000 and selling spot above $10,000.
ADX has also failed to reach old highs, falling from a peak above 60 on our run up to $8,500 to between 40-45 on this spike up to $14,000. We can conclude from this that the trend may be weakening as DMI and ADX fail to reach old peaks on each continued new local high.
We have also got a convincingly large Daily Bear Divergence formed by the 3 arrows on RSI on the chart; as RSI failed to make higher highs on the run from $8,500 to $14,000 yet price continued to make new highs.
Bear Divergence:
Price: Higher High
Oscillator: Lower High
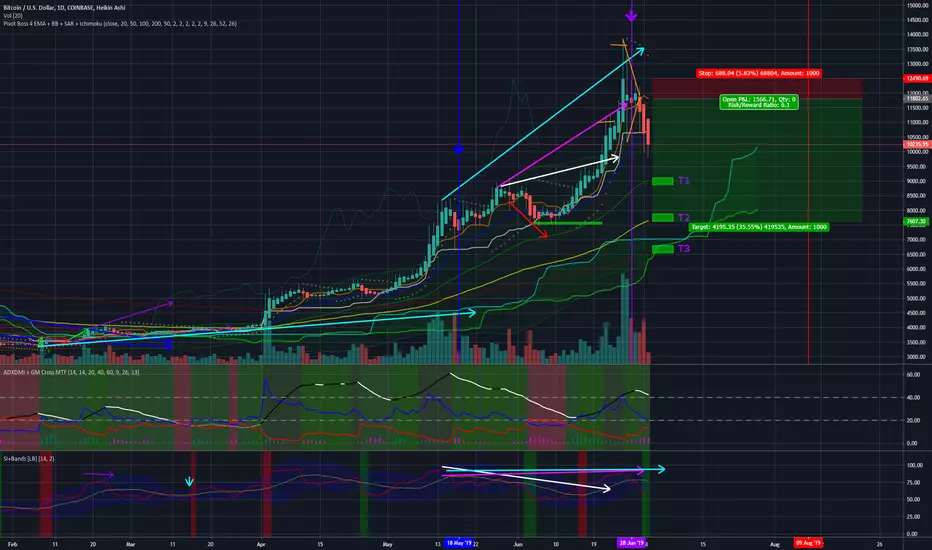
BCHUSD 300% Parabolic Move Some thoughts and highlighted trendlines regarding Bitcoin Cash's quiet sideways movement, perhaps we'll see some movement from alts into 2020 now that attention is on Bitcoin. We have a head and shoulders possibility here to send us down, but I think that is already invalidated. H&S usually don't hold much weight in crypto.
Keep an eye on it!

WOOWWWWW PHBBTC 45% OF PROFIT We love coins that make parabolic movements. Who buy near 48 should be happy now with more than 45% of profits.
We respect them !!

FMX, Fomento Economico Mexicano SAB - Parabola SupportNYSE:FMX
Very particular this pattern in which the price has been bouncing perfectly for 6 and a half years on the parabolic support and is in the theoretical final phase before any breakout of the resistance that lasts a long time.
We set the alerts and wait.
Stay Tuned!
finance.yahoo.com

ETC in disbelief if the blue oval is tested and broken out of these are my targets.
target 1) 8.20
target 2) 9.75
target 3) 10.85

Possible cup and handle formation GOLDGold looks to be forming a beautiful cup and handle. The 1915 level will be a critical point for GOLD breaking above this level could lead to a parabolic curve in gold similar to that of BTC.
My outlook remains long term bullish for gold just remain with low leverage buys as we could see some pullbacks from current levels.

Calling New ATH ~15k€ around 15th-Sept; 25k-30k shortly later.My previous chart quite impressively respected my forecast.
RSI keeps good looking after last nice green candle few minutes ago, as well as MACD-MFI combination.
Next parabolic rally to new ATH at

Bigger picture of where BTC is goingSome people keep asking me where we go, but the thing is as I previously explained, it is all about probability, no one can be sure on any of the time terms (If people really knew to predict every BTC move they would be very rich and famous in doing so), but my probabilities atm are:
Short term? no one can be sure...
we are in a symmetrical triangle as I showed previously... any break below it or above it will determine the short-mid term mood..
mid term? historical phases (last parabolic run, and the first time we hit 1k+ and had a big correction before the explosion) show that we have still a big correction, also the rise of the current parabolic was due to tether manipulation and exciting bots, also i didn't see real volume buying power, sentimental's aren't really that strong, and in fundamentals the technology is way behind so I don't see any institutions nor adaptation in at-least next 2 years... also if we explode with another parabolic move upwards then the crush is going to be much worst then I expect now, so mid term if we wont create ath, then we will see a 1-5.5-8.2k again (1-3 if tether dies, and 5.5 because we need to reset the current parabolic like we did with the previous, or at-least correct it to 0.7 fib' which is +/- 8.2k)... also excitement, and other values of moon boys give me the same vibes as it was when we got to 18k last time, and when we got to 1k for the first time way before that (both had long term corrections which no one believed could happen)...
long term? I can see Bitcoin between 1-10m$ if the technology matures and succeeds, this is the stable zone for Bitcoin where 1sat = 1cent, when BTC replaces all fiat in the world (Or stays above all of them), when only multi billionaires can hold 1 whole BTC, when all BTC cap can hold all gold in the world and so on...
Hopefully this answers your question..
Things can always change, by this is basically the vision which I hope to see..


Adam Made Eve Parabolic! The Rsi will soon to go over 83.45.
EMA 200 is the support and we are out of the Ichimoku cloud with legging span over the cloud giving it a parabolic behavior.
the diagonal resistance since the 26th of June and 10th of July has been broken.
Cheers.

Parabolics, Channels, & EMAs: A LineupFor reference:
EMAs
21, 55, 50, 200
Yellow, Orange, RED, GREEN
Paying closer attention to the parabolic channel we've been in since the kick off enormous candle we received at the beginning of April, for the most part we've stayed inside it and when we veered outside, the correction was quick (within a week or so) to get back into the channel and keep following
Looking into the confluence of the channel, along with the Symmetrical Triangle which is forming.
This could also be argued as a Descending Triangle, but that would have the potential to violate the channel twice within a very short period of time which I place the odds of at <5%
Observing now the chart on the right which has another symmetrical triangle between the channel and the top edge of the other triangle.
First some history!
When the MIDTERM TREND HAS BEEN BULLISH
The 21 and 55 EMAs have crossed just before the 50 and 200 EMAs and historically when this has happened in the past there's a roughly 50% move upwards staying on top of the 21 EMA until the 21 EMA crosses the 50 EMA again.
Measuring the potential maximum percentage gains when this has happened in the past from midterm low to new high is usually at least a 75% increase in price (lastly noted at ~9200, which would estimate just above 16k).
This can be noted and measured at least 3 separate times since the beginning of April
May 2nd - June 4th
June 13th - July 1st
(July 3rd - July 13th, but this was in a midterm BEAR market so the effect was mostly negligible but still positive at roughly 5%)
And most recently
Aug 1st - ???
The confidence on this bull market is based on several points of fact in recent days and weeks:
The most recent bear market has been reasonably completed by retracing from 13.8 to 9.2 over the course of a few weeks, almost regardless of what low you're measuring by this should've hit very close to a Fib level (probably 0.5 or 0.618 for recent-ish lows in the previous months)
Continuing devaluation and trade wars between the US and other countries such as China and Venezuela
Increasing adoption and news coverage around Bitcoin and Crypto in general, mainstream news is picking up much more regular coverage and it's boosting us upwards at a decent pace
The king reins supreme and is far away from it's current valuation even considering just 1 year away from today. The future is inevitably creepin' up on everyone else, we're still just the early profiteers of emerging technology which will see no less than 10x the current adoption rate in 10 years
Though I don't know what one might need much of a stop loss for in this market...
Good luck, happy trading, and as usual SET YOUR DAMN STOP LOSSES (but not too tightly (giggity))


BTC: Crazy and unlikely ATH prediction, vs an earlier predictionMore probable to just reach 20k by the end of this year.
But here's my previous, and in my view, probably prediction of the next ATH using the LVDT dynamic guide bands/levels. (previously named "Bifrost Guide Bands") at the time.
Target: ~280kUSD @ ~Feb 2021
In previous cycles, the bull market came in 3 phases.
1) The first phase is where the price remains range bound between the red LVDT level and the black 100 sma,
2) until it eventually breaks the red LVDT level and enters the 2nd Phase ( the start of the parabolic phase ) remains range bound between the red and the pink LVDT levels,
3) and finally it breaks the pink LVDT level and peaks when it hits the final orange LVDT level.
However, for the current market cycle, we jumped straight into Phase 2!

Bitcoin! 3 intersecting Parabolic Rises until $50k EOY?Hello everyone,
I've got my contrarian hat on today, inspired by my previous idea on Litecoin.
While everyone is expecting further retracement or re-accumulation phase for the coming months on Bitcoin, could this surprise all and continue it's parabolic rises?
We present the 3 parabolas (yellow, purple then blue) that we see playing out, IF our contrarian view holds.
You will notice how $BTC has been loving its 80-81% parabolic rises in each "step".
Are we THAT bullish going into EOY? $50k if so!
Please **do not trade based on this ** - this is a suggestion/idea based on a contrarian view that Bitcoin continues to be very bullish in Q3 and Q4 this year!
Cheers,
Leb Crypto

AUD/USD HUGE DROP, RIDE THAT SUPPORT! O_oAUD/USD has been in an overall bearish market this week. We received our final drop for the week. Lets ride that pitchfork today.
LONG if bounces of support.
SHORT if breaks support.
Good luck and happy trading!
SEB O_o

Parabolic BCH actionPotential parabolic action here on the 1 day chart of BCH! Looking to ride this up to $400 or so
