Not enough strengthNot enough strength for a break up of the descending channel. I think is going to be rejects again and drop to the bottom of the channel. Be careful of a fake out, SL triggers only if a daily candle closes above the resistance.
Parallel Channel

Apollo Tubes, 1WChannel Pattern is Looking Very Good , Take little Time to Breakout from the Pattern
Enter only after the Breakout of Upper Trendline
Stop line Should be Minimal so your profit should be High , Follow 1:2 Risk, Reward minimal in Every Trade .
Follow For More Swing Ideas Like This

TLT poised for bull flag breakout this weekIncreased volatility from tariff news will likely send us out of this channel if TLT shows even slightly bullish price action.

XRP - Decision Point at Fair Value Gap (FVG)This 1-hour XRP/USDT chart shows price consolidating inside a descending channel, approaching a critical Fair Value Gap (FVG) zone.
Key Observations:
🔹 FVG Support: Price is testing an area of inefficiency, which could act as a turning point.
🔹 Two Possible Scenarios:
- Bullish Case: If price holds the FVG and breaks upward, a push toward channel resistance is likely.
- Bearish Case: Failure to hold the FVG could result in a drop toward the lower channel boundary.
Which way will XRP move next? 🚀📉 Let’s discuss!

GOLD → The rally is intensifying. Growth after false breakdownFX:XAUUSD is breaking upwards and is trying to consolidate above the previous high of 3127 as part of a correction. This would be an ideal support for the bulls. The rally, on the background of political and geopolitical problems only intensifies
Tariff escalation pushes up gold demand. Trump rejected the idea of lowering tariffs and the Treasury Secretary named a list of 15 countries that fall under the new measures. This has caused the dollar to weaken and fears of stagflation to rise, boosting demand for gold as a protective asset.
Central banks and investors continue to build positions in gold, but corrections are possible before the tariffs announcement on April 2 and the release of U.S. economic data
Technically, we have a strong bullish trend, it is risky to sell, we are looking for strong areas or levels to buy. For example, if the price consolidates above 3127, or after a false breakdown of 3119 / 3111
Resistance levels: 3147, 3155, 3166
Support levels: 3127, 3119, 3111
Before the continuation of the growth there may be a correction to the key support areas to normalize the imbalance in the market as well as to capture the liquidity. Consolidation above the level after a false breakdown will be a good signal for growth.
But! News ahead and high volatility is possible!
Regards R. Linda!

NZDUSD → Consolidation within the correctionFX:NZDUSD is forming a local correction on the background of the uptrend. The dollar has been consolidating and strengthening for the last week, which generally creates pressure on the forex market
NZDUSD after a false break of the trend resistance, which also coincided with the stopping of the strong decline of the dollar, entered the correction phase. Locally, it is a downtrend, followed by consolidation, which in general forms a flag - a figure of continuation of the movement.
The chart reveals strong levels that can be paid attention to. The dollar may continue its growth due to the US policy, which generally has a negative impact on the market.
The price exit from the current consolidation may be accompanied by a strong impulse. Emphasis on 0.575 - 0.571.
Resistance levels: 0.57426, 0.57674
Support levels: 0.571, 0.5684
After stopping at 0.571, the price is not pulling back, but forming consolidation on the background of the local downtrend. Most likely a big player lures the crowd to get to the imbalance zone or trend support at their expense.
Regards R. Linda!

NZDUSD is following DOW theorywith no sign of reversal, the price action seems bullish as it has marked HL and is now ready to start the upward movement. By analyzing the trend, I believe that the price will mark HH with 4.50%, which is the average of the last two.

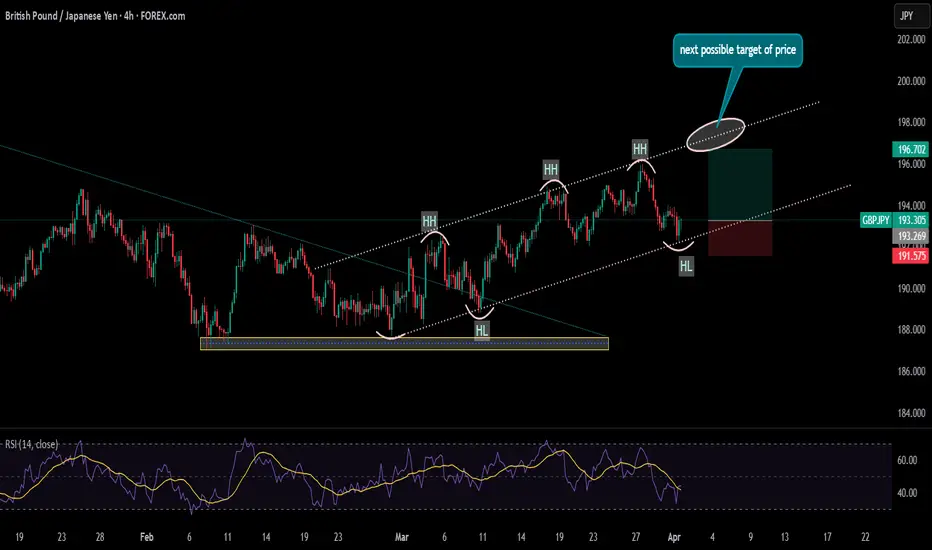
GBPJPY will likely to continue the bullish channelwith no significant sign of reversal, the price seems ok to continue the parallel channel as it has touched the lower trendline the next possible move is that it will hit the upper trendline as it has done in the previous situations. Area of the next HH has also been marked on the chart, and also buy position with instant been shown.
To the moon? Hang on a second...I'm reluctant to jump to a conclusion on this count as yet, but it certainly looks like that centre line strike is as much as we get. I can't imagine there would be as big an announcement possible as American Bitcoin, with Eric T "all in ".
Well, seems like moon it is then, but nothing wrong with some skepticism nonetheless. I'm not convinced it can't still get down to that 41k ish level although it might be wishful thinking. Maybe more realistic is an accumulation around here plus or minus 5k or so, while it rolls around the converging daily moving averages, perhaps even with another spikey test of the 75k region. Losing that level would be great for a 41k superbuy, with 59 another potential barrier on the way to it.
If break outs to the upside happen, there will always be a back test to look for good buying opportunities.
41k though one time please thanks

SOLANA(UPDATE)Hello friends
Due to the heavy price drop, you can see that buyers are slowly entering and the price is creating a good ascending channel, which now provides a good opportunity to buy in stages and with capital management and move towards the specified goals.
Don't forget to save profit on each target.
*Trade safely with us*

GOLD - Price will make correction movement to support levelHi guys, this is my overview for XAUUSD, feel free to check it and write your feedback in comments👊
Some time ago price started to grow inside a rising channel, where it soon reached $2940 support level and broke it.
Then it some time traded near this level and then continued to grow in channel and soon reached resistance line of channel.
Soon, Gold reached the $3055 level and then corrected to the channel's support line, after which it turned around.
XAU reached $3055 level again and broke it, aftr which continued to grow and recently, it reached almost resistance line.
But soon, it turned around and started to decline, so, in my mind, Gold can continue to decline to $3055 level.
If this post is useful to you, you can support me with like/boost and advice in comments❤️

parallel channel vs goldgold price went up in last march month
but rising price has made a clear parallel channel on h4 chart
price testing upper line and get intraday rejection instantly. if price start correction then lower line of the channel will be next big dynamic support level

Some of you won't be able to holdWeekly stoch RSI crossed bullish. It's the weekly, some more downturns can be had. But are you waiting to time this? Seriously?
Check out my other CHZ ideas for different views on this coin.
Will you be able to hold till the top? It might come within 3 months.
Rustle

$NIO Wyckoff Accumulation – Schematic #1 or #2 in PlayMy base case at the moment is Wyckoff Accumulation Schematic #2 , where the Secondary Test ( ST-B ) could mark the very bottom. This idea will be validated for me especially if we see interaction with the High Time Frame Channel projection.
Green Zone:
We have multiple levels of confluence around this zone:
0.786 Fibonacci Retracement from the 2020 low to the 2021 top
MO – Monthly Open level
Volume cluster from previous local consolidation
Blue Zone:
If price drops as low as VAL, I expect it to be just a quick, volatile wick breaching into the Blue Zone.
High Time Frame Channel projection:

PANW Rising ChannelI'll be waiting to see if this can make it back into the rising channel before making a buy.

Gold - They All Call Me Crazy!Gold ( TVC:GOLD ) is just starting the next rally:
Click chart above to see the detailed analysis👆🏻
Just a couple of months ago, Gold perfectly broke out of the long term rising channel formation. After we then witnessed the bullish break and retest confirmation, it was quite clear that Gold will head much higher. This just seems to be the beginning of the next crazy major bullrun.
Levels to watch: $4.000
Keep your long term vision!
Philip (BasicTrading)

GOLD → Growing economic risks increase interest ↑FX:XAUUSD rallied aggressively due to high interest driven by rapidly rising economic risks, mainly related to Trump's tariffs. For selling, the risk is very high, with the stock and cryptocurrency market declines only adding to the interest in the metal
Markets are taking refuge in defensive assets amid WSJ reports of Trump's possible tariff hike of up to 20% for most US trading partners. This could trigger inflationary pressures and stagflation, weakening the dollar and bond yields, which supports the gold price.
This week all eyes are on Trump's speech on Wednesday, PMI, NonFarm Payrolls and Powell's speech
Technically, it is not worth selling now as it is high risk, and for buying we should wait for a correction to key support levels
Resistance levels: 3127
Support levels: 3103, 3091, 3085
We are not talking about any trend reversal now. It is worth waiting for a local correction or consolidation, the market will mark important levels, liquidity zones or imbalances against which you can build a trading strategy. Gold will continue to grow because of the strongly increasing risks.
Regards R. Linda!

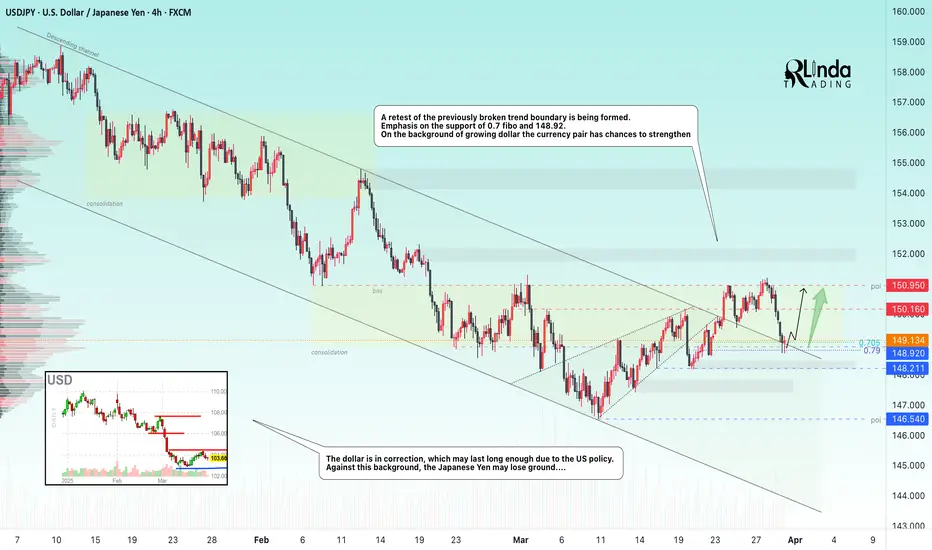
USDJPY → Key Level Retest. Attempt to change the trend FX:USDJPY in the correction phase is retesting the previously broken boundary of the downtrend. The market is trying to break the trend on the background of the dollar correction
The dollar is having a rather difficult life because of economic and geopolitical nuances regarding the USA, as well as high inflation. Against this background, the index may continue a deeper correction, as the rhetoric of interest rate cuts may be prolonged, which may put pressure on the markets.
The currency pair tried to overcome the downtrend resistance earlier and succeeded, but this is not enough for a trend change, it needs confirmation.
Support levels: 148.92, 148.21
Resistance levels: 150.16, 150.95
If the bulls hold the defense above 148.92 - 149.5, we have a good chance to catch a trend change. It will be the readiness to go to the resistance of 150.16 range, and the breakout of this level and price fixation above it will be the confirmation of the trend change
Regards R. Linda!
GOLD BUYHello friends
Due to the channel breakdown, the price is expected to move to the specified targets. Be sure to follow capital management.
*Trade safely with us*
EURAUD Wave Analysis – 31 March 2025
- EURAUD rising inside impulse wave iii
- Likely to reach resistance level 1.7400
EURAUD currency pair recently reversed from the support zone between the support level 1.7080 (low of the previous wave a), 20-day moving average and the support trendline of the daily down channel from the start of March.
The price earlier broke the resistance trendline of the aforementioned down channel – which accelerated the active impulse wave iii.
Given the clear daily uptrend and the bullish euro sentiment, EURAUD currency pair can be expected to rise to the next resistance level 1.7400 (which stopped the previous impulse wave i).

How low will it go? The S&P Bear MarketI don't believe the market has bottomed yet. There is more to come.
Trump's tariffs will continue to cause uncertainty and as economic figures confirm a US slowdown, stock markets could fall further.
From a technical perspective, I will be looking to buy between 4700 and 5200. This is based on evident weekly horizontal levels, bullish channel support, and 100 and 200 SMA's.
VANTAGE:SP500 PEPPERSTONE:US500 ICMARKETS:US500 OANDA:SPX500USD

GOLD → Correction after a false breakout. A reversal?FX:XAUUSD is forming a false break of the channel resistance within the rally, we should wait for a correction, but not for a trend reversal. Let's see what we can expect from the price in the short and medium term.
Gold is reacting to market turmoil over Trump's tariff plans. Investors are looking for protection ahead of the possible imposition of new duties from April 2, boosting demand for the metal
Fears of a trade war and a slowing global economy are supporting gold despite positive US GDP data. PCE data and tariff updates will be key catalysts for further movement. Higher inflation could dampen the rally, while weak data will reinforce bets on a Fed rate cut, helping gold to rally further.
The energy to continue the move is gone, so I am waiting for a correction to the imbalance zone or to 0.7 Fibo to accumulate potential. The price may consolidate in the zone of 3050 - 3075 before it continues its growth
Resistance levels: 3075, 3085, 3095
Support levels: 3059, 3055
The correction after a strong rally can be quite deep. The imbalance zone 3066 - 3063 and liquidity zone 3057 play an important role. False breakdown of support may resume growth.
Regards R. Linda!

SPY $545 Downtrend ContinuesSymbol: SPY
Timeframe: 30-minute chart (for your analysis)
Bias: Short (after the anticipated bounce)
Prediction: I anticipate a short-term bounce in SPY from Friday's sell-off towards the upper level of the weekly regression channel, around 560. I plan to look for a short entry at this level, expecting the price to then continue its downtrend towards the monthly regression channel support around 545.
Analysis:
Weekly Trend Channel (Blue Double Lines): The blue double lines on my chart represent a weekly trend channel for SPY. This channel was determined by performing a linear regression on the price action over the past week. The upper and lower boundaries of the channel are set at two standard deviations away from this linear regression line. This method helps to identify the statistically probable range within which the price is likely to trade over the weekly timeframe.
Monthly Trend Channel (Yellow Double Lines): Similarly, the yellow double lines indicate a monthly trend channel. This channel is derived from a linear regression of SPY's price action over the past month, with the boundaries set at two standard deviations. I expect SPY to eventually find support within this monthly channel, with the lower boundary currently around the 545 level. This is my primary downside target.
Recent Price Action and Anticipated Bounce: The aggressive 2% downtrend on Friday likely pushed SPY towards the lower end of the weekly channel, potentially creating oversold conditions in the short term. I am anticipating a bounce from this sell-off towards the upper boundary of the weekly channel, which I estimate to be around 560. This level is expected to act as resistance.
Short Entry Opportunity: I will be closely watching price action around the 560 level, which coincides with the upper boundary of the weekly regression channel. If I observe signs of rejection or bearish confirmation at this resistance, I will look to enter a short position.
Contributing Factors: President Trump's aggressive tariff policies continue to contribute to market uncertainty and the overall bearish sentiment, supporting the technical outlook for further downside.
Conclusion:
I am predicting a short-term bounce in SPY to approximately 560, which aligns with the upper level of the weekly regression channel. I will be looking for a short entry at this level with the expectation of a subsequent move down towards the monthly regression channel support around 545. This strategy aims to capitalize on a potential retracement within the established downtrend, guided by regression-based trend channels and influenced by fundamental concerns regarding tariff policies.
Disclaimer: This is my personal analysis and not financial advice. Please conduct your own research before making any trading decisions.
