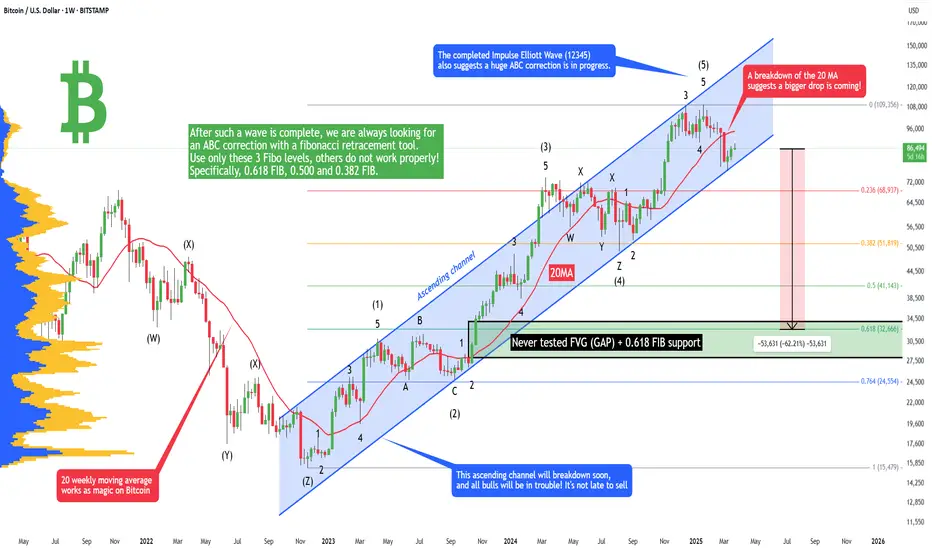
Bitcoin - Why is everyone wrong + Magic Moving AverageWe have so many warning signs that Bitcoin is going to crash significantly in 2025/2026. One of them is this magic 20-weekly moving average. As we can see, the price always respects this dynamic level, and if the price falls below it, it triggers a sell signal. On the other side, if the price rises above it, it triggers a buy signal. The price is currently below it, so this is a bearish signal.
The next bad signal is this Elliott Impulse wave. What we can see here is a perfect textbook impulse wave that has been completed. If you are an Elliott Wave trader, you already see that this is a big problem. After such a wave is complete, we are always looking for an ABC correction with a fibonacci retracement tool. Use only these 3 Fibo levels, others do not work properly! Specifically, 0.618 FIB, 0.500 and 0.382 FIB. Bitcoin loves the 0.618 FIB, so there is a pretty huge chance of going down to 32k. But expect a very strong bounce from the 0.382 FIB as well, which is at 52k. Set up your buy orders here, and thank me later!
What we can also see on the chart is an unfilled Fair Value Gap (FVG) between 34k and 28k. Often the price loves to come back and test these important price actions. This is a great buying confluence with the 0.618 FIB because the FVG is inside this Fibo level.
The last thing I want to talk about is this huge blue ascending channel on the weekly chart. This is a representation of this whole uptrend (bull market). You may say that Bitcoin is bullish until this channel holds, yeah, but what we do here is we predict future price action and give you technical analysis. I am giving you this information in advance so you can prepare for the future!
Write a comment with your altcoin + hit the like button, and I will make an analysis for you in response. Trading is not hard if you have a good coach! This is not a trade setup, as there is no stop-loss or profit target. I share my trades privately. Thank you, and I wish you successful trades!
Parallel Channel
EURUSD - Potential Reversal Zones and ScenariosThis 4-hour chart of EURUSD highlights potential Fair Value Gaps (FVGs) that could act as strong areas of support and possible reversal zones. Price action is currently trending within a descending channel, with three possible bullish scenarios outlined:
1. A breakout from the upper boundary of the channel leading to an immediate bullish move.
2. A retracement into the first FVG zone, followed by a reversal upward.
3. A deeper retracement into the second FVG, aligned with the 0.618-0.65 Fibonacci retracement level, before a strong bullish rebound.
Keep an eye on these levels for high-probability trade setups. Patience is key!

NASDAQ INDEX (US100): Bullish Reversal Confirmed?!
I see 2 very strong bullish reversal confirmation on US100 on a daily.
First the market violated a resistance line of a falling channel.
Then, a neckline of a cup & handle pattern was broken.
Both breakouts indicate the strength of the buyers.
We can expect a growth at least to 20300 resistance.
❤️Please, support my work with like, thank you!❤️

EURO - Price can correct to support area and rise to $1.0955Hi guys, this is my overview for EURUSD, feel free to check it and write your feedback in comments👊
Some days ago price started to grow inside a rising channel, where it broke the $1.0345 level and then it reached the resistance line.
Next, price made correction to support line of channel and then it quickly reached $1.0345 level and broke it again.
After this, price continued to grow in the channel, and later, it exited from it and rose to $1.0765 level.
Soon, price broke this level and started to trades inside flat, where it reached top part of flat and some time traded near.
Then it started to decline, so, now I expect that Euro can bounce up from support area and rise to $1.0955 points.
If this post is useful to you, you can support me with like/boost and advice in comments❤️

DOLLAR INDEX (DXY): Strong Bullish Sentiment
As I predicted yesterday, Dollar Index continued growing.
Analyzing the intraday price action today,
we can see that the market established a nice rising channel on a 4H.
I think that the Index will keep rising within a channel and will reach 105.0 level soon.
❤️Please, support my work with like, thank you!❤️

GBPUSD → Correction to the liquidity zone. Waiting for a FBFX:GBPUSD gets a negative CPI report in the early session and tests key support, but failing to reach the liquidity area a rebound is formed. The pair is in consolidation...
The CPI report provoked a small liquidation in the market, within the framework of which the price tested one of the key supports at 1.2886, but the price did not enter the liquidity area, i.e. technically the chances to return to this area are quite high.
A correction to the imbalance zone is being formed, from which the decline may continue. In the short term I am interested in 1.2868, which can still hold the market and form a bullish impulse.
Resistance levels: 1.2926
Support levels: 1.2886, 1.2868, 1.2811
False break of the global range support at 1.2868 may trigger a rebound to 1.2926. I do not exclude a deeper correction to the support from D1, for example to 1.2811 from which, against the background of the bull market, we can wait for an upward correction.
Regards R. Linda!

Virgin Galactic Wave Analysis – 26 March 2025
- Virgin Galactic reversed from the resistance area
- Likely to fall to support level 3.000
Virgin Galactic recently reversed down from the resistance area between the key resistance level 4.45 (which has been reversing the price from February), the resistance trendline of the daily down channel from November, 50% Fibonacci correction of the downward impulse from January and the upper daily Bollinger Band.
The downward reversal from this resistance area started active wave 3 – which belongs to wave (5) from November.
Given the strong downtrend, Virgin Galactic can be expected to fall to the next support level 3.000, which stopped the previous wave 1.

[NDX] A textbook chart for being bearishSummary
- See the previous idea for context:
- Another realization: horizontal channels for S/R work better than diagonal ones. This doesn't mean that the latter need to be discarded altogether.
- Looking back, NDX did really have desperate jumps towards the end of the bull rally.
- High volume on days with large inverted hammers was a sure sign of an impending stampede.
- Today's rejection is why being long without confirmation is a bear trap. Being on the short side is much less stressful.

GOLD - Price can correct to support level and continue to growHi guys, this is my overview for BTCUSDT, feel free to check it and write your feedback in comments👊
Some time ago price started to grow inside a rising channel, where it reached the $2880 level and broke it.
Next price bounced from this level and some time rose in the channel, but then it made a correction, exiting from this channel.
After this, price turned around and continue to move up in another rising channel, where later it reached $3000 level.
Then Gold broke this level and made retest, after whcih it rose to resistance line of channel and then fell to support area.
Recently price started to decline, so, I think that Gold can decline to the support level and then bounce up to $3095
If this post is useful to you, you can support me with like/boost and advice in comments❤️

Bitcoin’s Next Challenge – Can BTC Break the Heavy Resistance?Bitcoin ( BINANCE:BTCUSDT ) started to rise from the Support zone($84,120_$81,500) as I expected in the previous post . The question is, can Bitcoin break the Heavy Resistance zone($93,300_$89,200) and Resistance lines ?
Please stay with me.
Bitcoin appears to have broken through the Resistance zone($87,100_$85,800) and is preparing for its first attack on the Heavy Resistance zone($93,300_$89,200) .
In terms of waves, Bitcoin appears to be completing microwave 4 of microwave C of the main wave Y . The waves structure inside the Ascending Channel appears to be of the Double Three Correction(WXY) .
I expect Bitcoin to prepare for its first attack on the Heavy Resistance zone($93,300_$89,200), the upper line of the ascending channel , the monthly pivot point , 50_SMA(Daily) , and the Resistance lines after completing the pullback to the Resistance zone($87,100_$85,800 ) and fill first CME Gap($86,640_$86,520) . I think the Potential Reversal Zone(PRZ) could be the zone to start a new decline for Bitcoin.
I chose the label of this analysis ''SHORT'' because I think Bitcoin is in a bit of a risky zone for a LONG position, what do you think?
Note: If Bitcoin goes over $91,000, we can expect more pumps.
Note: If Bitcoin falls below $85,200 before hitting the Heavy Resistance zone($93,300_$89,200), we can expect further declines.
Please respect each other's ideas and express them politely if you agree or disagree.
Bitcoin Analyze (BTCUSDT), 2-hour time frame.
Be sure to follow the updated ideas.
Do not forget to put a Stop loss for your positions (For every position you want to open).
Please follow your strategy and updates; this is just my Idea, and I will gladly see your ideas in this post.
Please do not forget the ✅' like '✅ button 🙏😊 & Share it with your friends; thanks, and Trade safe.

MATIC / USD [Polygon] EWP TC FIB ANALYSIS WEEKLY TFElliott Wave Analysis for MATIC/USD (Polygon) 1W Time Frame Chart
The chart presents a detailed Elliott Wave analysis with corrective patterns, Fibonacci levels, and a long-term price projection.
MATIC is currently in a final corrective phase (Wave C of an ABC correction) within a descending channel.
A potential bottom formation near the 0.618–0.65 Fibonacci retracement level (~$0.19 - $0.22) suggests a possible trend reversal. (Strong support zone)
The RSI (Relative Strength Index) is in the oversold zone, indicating that selling pressure may be exhausting.
The previous bullish impulse (Wave (5)) ended around $2.75
This was followed by an WXY corrective multi zigzag, which appears to be reaching its final stage. The chart suggests that Wave (C) of the correction is nearing completion.
Bearish Scenario:
If the $0.19 - $0.22 support fails, further downside towards $0.10 - $0.05 is possible.
However, this scenario would likely require a broader crypto market downturn.
Conclusion: Potential Long-Term Trend Reversal
The current zone suggests a possible bottom formation, which could lead to a new bullish cycle.
A breakout above $0.42 - $0.50 with strong volume would confirm the trend reversal.
Traders might consider accumulation in this range with a stop-loss below $0.17.
Overall Outlook: Bullish mid-term outlook once the bottom is confirmed.

AUDCAD | Reoccurring FractalsWe're looking at 3 complete fractals and the fourth one being the current one. Same phase as the last, a bit of sideways trading/consolidation then aggressive buying breaking out to the upside.
Price action has been trending upwards with HHs and HLs and we're currently at a Lower High bouncing off the lower trendline below.
Would be ideal to look for long positions only for this setup as bulls are looking stronger from this view.
~300pips going into the 3rd wave.

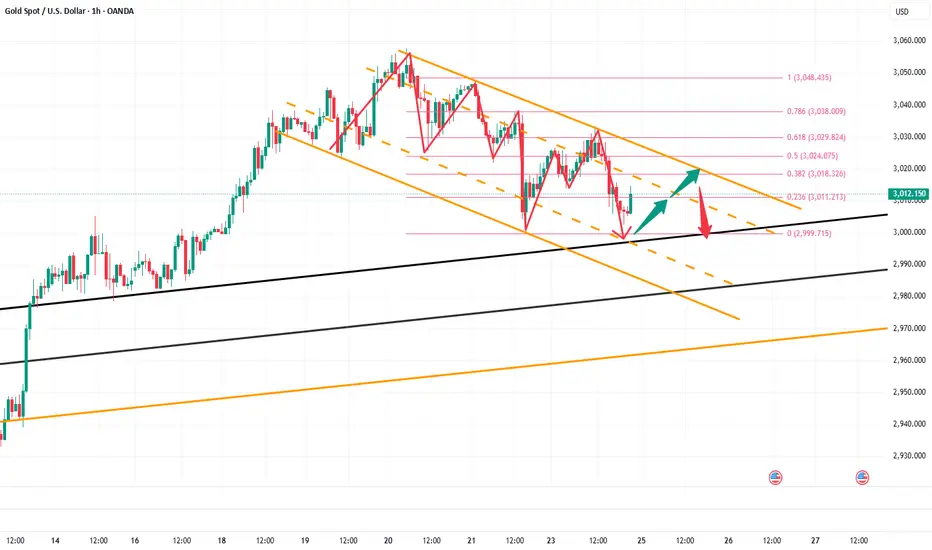
Bulls or Bears – Who's in Charge?Tomorrow could be an exciting day for gold! 🎢 The current trend channel has broken out and is now moving sideways. The big question: Will the market push higher, or are we in for a drop?
If the bulls take control, we could see a test of the $3,036 zone – a key target for long traders! 🚀 But be careful: If the price falls below $3,015, it's time to watch closely! If the market stays bearish, further downside could be on the horizon.
So, keep an eye on the charts, set your strategy, and be ready when the move happens! 🔥📊
This is my first Idea in TV, what do you think – bulls or bears? 🐂🐻
----------------------------------------------
This is just my personal market idea and not financial advice! 📢 Trading gold and other financial instruments carries risks – only invest what you can afford to lose. Always do your own analysis, use solid risk management, and trade responsibly.
Good luck and safe trading! 🚀📊

Gold Likely to Extend Decline Toward the 2995-2985 ZoneGold encountered resistance and pulled back after reaching around 3026 during the rebound, failing to break the descending channel effectively. In the short term, bearish momentum remains dominant. On the daily chart, gold has closed with three consecutive bearish candlesticks, it weakens rebound expectations and suggests further downside remains possible.
The key short-term level to watch is around 3010. If gold breaks below this level during the pullback, the downtrend structure will become more pronounced. This would likely lead to another test of the 3000 level, with further downside potential extending toward the 2995-2985 range.
I remain committed to shorting gold on rebounds. My primary plan is to enter short positions within the 3020-3030 range. I will make more detailed trading plans and trading signals every day according to the real-time market situation, which is also the testimony of every successful transaction and profit of mine; the article has a certain lag, if you want to copy the trading signals to make a profit, or master independent trading skills and thinking, you can choose to join the channel at the bottom of the article

GOLD → Tense fundamental environment and retest of 3025FX:XAUUSD is forming a correction within the descending channel. The situation is becoming complex and confusing. The focus is on the channel resistance and on the support at 3004.9. Further price movement depends on the fundamental data...
The problem is the uncertainty around the US tariff policy and the outcome of talks between Russia and the US on ceasefire in Ukraine.
The market is focused on US consumer confidence data and comments from Fed officials. The rise in the dollar, supported by Bostic's hawkish statements and strong PMIs, is pressuring gold, but the lack of clarity on tariffs and geopolitical tensions are limiting its further decline
Technically, the situation is simple in that it all depends on the resistance of the current channel. A break and consolidation above 3025 will trigger growth. A false break of the channel resistance will provoke a continuation of the decline both to 3004 and to 2980.
Resistance levels: 3024.6, 3038, 3056
Support levels: 3004.9, 2987, 2981
Based on the difficult fundamental environment, which is far from any positive decisions, the tensions in the Middle East, and the tariff war, I can conclude that gold will try to strengthen once again, as we have technical support: a strong bullish trend, a strong 3004 level, and a cascade of locally rising lows.
A failed breakdown will be false and in this case, a price consolidation under 3017 will trigger a fall to 3004.
Regards R. Linda!

The rebound presents a perfect opportunity to short gold.📍Gold has once again rebounded to the 3020-3025 range in the short term. You might think the bulls have regained control, but I see this rebound as a prime opportunity to short gold.
📍Currently, a new descending channel has formed within gold’s short-term structure. Despite multiple rebound attempts, the price has failed to break above this channel, further reinforcing its downward pressure. Additionally, on the daily chart, gold has printed three consecutive bearish candlesticks, undermining bullish sentiment and weakening confidence. This has also diminished the effectiveness of the 3000 support level, increasing the likelihood of further downside.
🔎Trade Idea:
Xauusd: Sell at 3015-3025
TP:3005-2995
SL:Adjust according to risk tolerance.
📩Trading means that everything has results and everything has feedback. I have been committed to market trading and trading strategy sharing, striving to improve the winning rate of trading and maximize profits. If you want to copy trading signals to make a profit, or master independent trading skills and thinking, you can follow the channel at the bottom of the article to copy trading strategies and signals

NEM - Big Move AheadOver the long term, I expect to see NEM at 100. My crude wave count shows that we are entering into a wave 3 that can boost shares to mid $80s.

EUR-USD bearish until mid-2025?Based on chart, there is potential downside for EURUSD going forward until mid 2025 or longer as long as the weekly bearish channel hold. We may stop trading the said direction if weekly candle breaks upwards (closes) outside the bearish channel.
This is a longer time frame (TF) (1W graph) directional idea.
What y'all think? Give your comments down below?

CRUDE OIL(WTI): Bullish Continuation Confirmed
One of the setups that we discussed on a today's live stream
was a bullish flag pattern on WTI Crude Oil on an hourly chart.
Its resistance breakout provides a strong bullish confirmation.
We can expect growth at least to 70 level.
❤️Please, support my work with like, thank you!❤️

Descending Channel in XAU/USD (Gold)Trade Setup for Descending Channel in XAU/USD (Gold)
**📉 Bearish Trade Setup (Sell Strategy)**
Since the price is trending within a descending channel, the best trade approach is to **sell at resistance** and **target support levels**.
**📌 Entry Points:**
🔹 **Sell Entry #1:** Near the upper boundary of the descending channel (~3,020 - 3,030).
🔹 **Sell Entry #2:** If price retests and fails to break above the 21 EMA (~3,015 - 3,018).
**🎯 Target Levels (Take Profit - TP):**
✅ **TP1:** 3,000 (Psychological level and lower channel support)
✅ **TP2:** 2,980 (Next major support zone)
✅ **TP3:** 2,960 (Extended target if the trend continues)
**🔒 Stop Loss (SL):**
🚨 **SL Above 3,035-3,040:** If price breaks out above the descending channel, it invalidates the setup.
**📊 Trade Confirmation:**
✅ **EMA Rejection:** Watch for price rejecting the **21 EMA (Blue Line)** as resistance.
✅ **Volume Analysis:** Look for increased selling volume when price approaches resistance.
✅ **Bearish Candlestick Patterns:** Such as **bearish engulfing, shooting star, or evening star** near resistance.
**📈 Alternative Bullish Setup (If Trend Breaks Upward)**
If price **breaks above 3,040 with strong volume**, it could signal a trend reversal. In this case:
🔹 **Buy Entry:** After a confirmed breakout & retest above 3,040.
🎯 **Targets:** 3,060 - 3,080.
🚨 **SL:** Below 3,030.
**Conclusion:**
🔻 **Primary Strategy: Sell on Rallies within the Channel.**
🔺 **Alternative Plan: Wait for a Bullish Breakout Before Buying.**
📉 **Stay disciplined with Stop Loss & Risk Management!*

Short gold at the right time after rebound📍Gold experienced a sharp decline to around 3002 in the short term — did it catch you off guard? Despite the rapid drop, I remained committed to my trading logic and strategy. As long as gold holds above the 3005-2995 support zone, a rebound toward the 3015 level remains likely. After stabilizing, gold has already rebounded above 3014, nearly reaching our target zone of 3015. In response, we opted to manually close our positions to lock in profits.
📍Looking ahead, our primary focus will be on the 3015-3025 resistance zone. In the short term, gold has shown signs of forming a descending channel structure. If it fails to decisively break above the 3015-3025 zone and invalidate the downtrend channel, there remains a possibility of a retest of the 3000 level, with further downside potential toward the 2995-2985 range.
🔎Trade Idea:
Xauusd: Sell at 3015-3025
TP:3010-3000
SL:Adjust according to risk tolerance.
📩Trading means that everything has results and everything has feedback. I have been committed to market trading and trading strategy sharing, striving to improve the winning rate of trading and maximize profits. If you want to copy trading signals to make a profit, or master independent trading skills and thinking, you can follow the channel at the bottom of the article to copy trading strategies and signals
XRP/USDT:BUY LIMITHello friends
You can see that after the price fell in the specified support area, buyers came in and supported the price and created higher ceilings and floors.
Now we can buy at the specified levels with capital and risk management and move with it to the specified targets.
*Trade safely with us*

BNB/USDT:BUY LIMITHello friends
You can see that after the price fell, buyers entered the specified support area and supported the price and created higher ceilings and floors.
Now we can buy at the specified levels with capital and risk management and move to the specified targets.
*Trade safely with us*
