GBPCAD: Bullish Price ActionThe 📈GBPCAD pair retested a horizontal structure that was previously broken on the 4-hour chart.
Following this retest, the price formed an inverse head and shoulders pattern and broke above a resistance line of a bullish flag pattern.
This suggests potential upward movement in the near future.
The next resistance level to watch is at 1.8692.
Parallel Channel

Charting the Path Forward: Key Levels to WatchPrevious Analysis: Successful Bullish Breakout
In our previous analysis, we identified a Falling Wedge pattern accompanied by bullish divergence, forecasting a breakout above 147.807. The price hit our target, confirming the bullish momentum and reaching key Fibonacci levels.
What’s Next:
Upon analyzing the chart, we observe that price has found support at 147.535 after a pullback during the American session. We anticipate the price to reach our first target, and after consolidation and a possible pullback, we expect to hit our second target near the upper line of the channel.
However, if the price declines from the first target and breaches support at 147.535, the next key support level is at 146.306.
Remember to follow your risk management strategies to protect your capital.

GOLD → Consolidation ahead of Fed rate meeting...FX:XAUUSD goes into consolidation 3038 - 3024 before the news - Fed rate meeting. The situation is generally predictable, but gold is reacting to rising geopolitical risks.
Gold is stabilizing before the Fed decision , markets are waiting for the data. The regulator is expected to keep rates, but Powell's forecasts will determine further dynamics.
“Hawkish” tone of the Fed may lead to the strengthening of the dollar and gold correction.
“Dovish” signals about economic risks will support the growth of metal prices.
Geopolitical tensions and Trump's tariffs continue to have an impact.The market is preparing for high volatility on the background of the Fed's decision and events in the world
Resistance levels: 2038, 2045
Support levels: 3024, 3015, 3004.9
Several scenarios can be considered for trading:
Breakdown of resistance 3038 - 3045, consolidation of the price above the level with subsequent growth to 3050 - 3060.
Or wait for the reaction to the news and with a possible breakdown of support to look for strong levels to trade a false breakdown, for example 3024, 3015, 3005.
Regards R. Linda!

USDJPY → Resistance retest (wedge) before the Fed meetingFX:USDJPY is forming a correction to trend resistance as part of the dollar index consolidation. An interesting situation is forming which could be a continuation of the downtrend.
Fundamentally, today is an important day. The FED interest rate meeting is ahead. Traders are waiting, the dollar is consolidating at this time. Most likely the rate will remain unchanged, but in this key everyone is interested in Powell's comments on monetary policy and their future actions.
USDJPY at this time is forming a correction to the bearish trend resistance, before the news the currency pair may test the resistance conglomerate: a wedge, 0.79 fibo, or an orderblock located outside the channel
Resistance levels: 150.16, 150.95
Support levels: 148.92
False breakout of the resistance zone can provoke a fall, as well as breakdown of the support of the “wedge” with the subsequent consolidation of the price in the selling zone. The price may test the zone of interest at 147.6, 146.54.
Regards R. Linda!

USD/JPY 4H – Short Setup at Upper Trend Channel Projection.USD/JPY 4H – Short Setup at Upper Trend Channel Projection
USD/JPY is currently trading within a well-defined descending channel. Price is approaching the upper trend channel projection, a key area derived from parallel structure analysis. While this level has not been tested multiple times, it aligns with the broader bearish trend, making it a potential rejection zone.
If price fails to close above this projection on the 4H timeframe, a short position will be executed with a stop-loss above the recent highs. The initial target is the previous lows at 146.60, while the extended target is the lower trend channel trendline.
Watching for confirmation before entry.


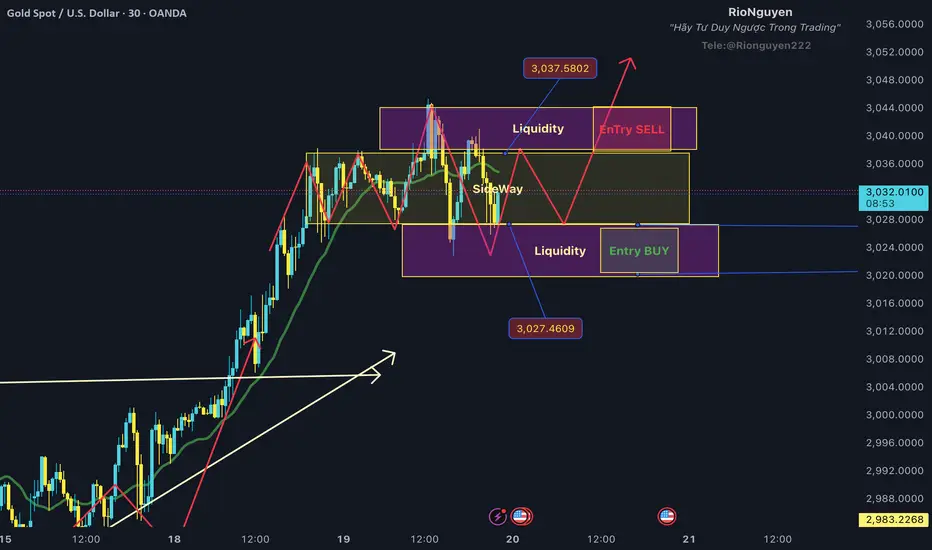
What is Gold Waiting For? Is This the ATH 3045? In our group, we secured profits in two rounds when gold hit an all-time high of $3045. Currently, we are still focusing on selling at $3040-$3045, as this is the liquidity grab zone for sellers.
I believe we can still trade within the sideway range, and be cautious of the two liquidity sweep zones as I have marked in the image.
Sell Liquidity 3040-3045: We can place Sell Limit orders in this area.
Buy Liquidity 3020-3025: We can place Buy Limit orders in this area.
The reason for this sideway phase of gold is that the market is awaiting the Fed meeting at 1:30 AM tomorrow, March 20th. After that, a strong trend will emerge. My plan is still leaning towards the Buy side, as the market is currently concerned about a potential economic recession in the US.
Therefore, we can focus on making small profits during this sideway period and wait for the next upward wave.
Thank you for your review, and I hope you'll stay longer by pressing Follow.
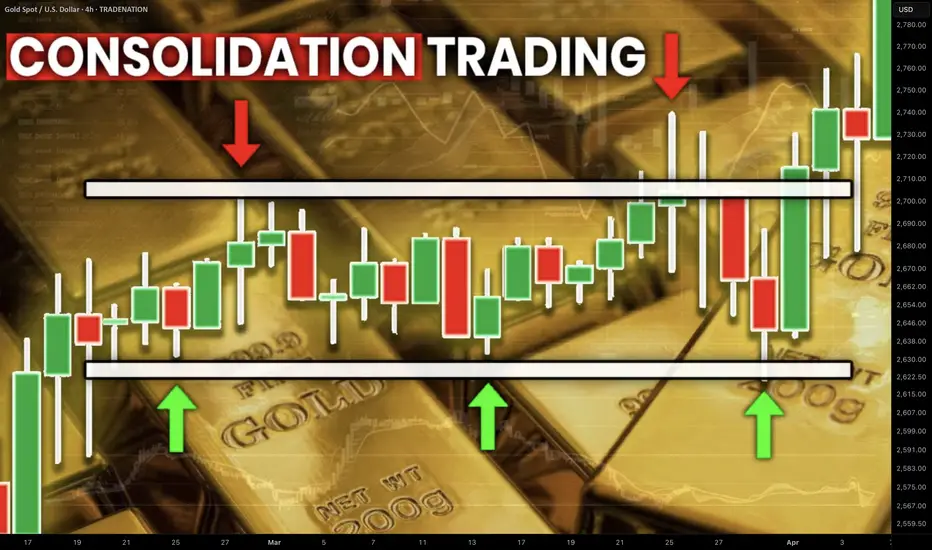
Best GOLD XAUUSD Consolidation Trading Strategy Explained
In article , you will learn how to identify and trade consolidation on Gold easily.
I will share with you my consolidation trading strategy and a lot of useful XAUUSD trading tips.
1. How to Identify Consolidation
In order to trade consolidation, you should learn to recognize that.
The best and reliable way to spot consolidation is to analyse a price action.
Consolidation is the state of the market when it STOPS updating higher highs & higher lows in a bullish trend OR lower lows & lower highs in a bearish trend.
In other words, it is the situation when the market IS NOT trending.
Most of the time, during such a period, the price forms a horizontal channel.
Above is a perfect example of a consolidation on Gold chart on a daily.
We see a horizontal parallel channel with multiple equal or almost equal highs and lows inside.
For a correct trading of a consolidation, you should correctly underline its boundaries.
Following the chart above, the upper boundary - the resistance, is based on the highest high and the highest candle close.
The lowest candle close and the lowest low compose the lower boundary - the support.
2. What Consolidation Means
Spotting the consolidating market, it is important to understand its meaning and the processes that happen inside.
Consolidation signifies that the market found a fair value.
Growth and bullish impulses occur because of the excess of demand on the market, while bearish moves happen because of the excess of supply.
When supply and demand find a balance, sideways movements start .
Look at the price movements on Gold above.
First, the market was rising because of a strong buying pressure.
Finally, the excess of buying interest was curbed by the sellers.
The market started to trade with a sideways range and found the equilibrium
At some moment, demand started to exceed the supply again and the consolidation was violated . The price updated the high and continued growth.
Usually, the violation of the consolidation happens because of some fundamental event that makes the market participants reassess the value of the asset.
At the same time, the institutional traders, the smart money accumulate their trading positions within the consolidation ranges. As the accumulation completes, they push the prices higher/lower, violating the consolidation.
3. How to Trade Consolidation
Once you identified a consolidation on Gold, there are 2 strategies to trade it.
The resistance of the consolidation provides a perfect zone to sell the market from. You simply put your stop loss above the resistance and your take profit should be the upper boundary of the support.
That is the example of a long trade from support of the consolidation on Gold.
The support of the sideways movement will be a safe zone to buy Gold from. Stop loss will lie below the support zone, take profit will be the lower boundary of the resistance.
AS the price reached a take profit level and tested a resistance, that is a short trade from that.
You can follow such a strategy till the price violates the consolidation and establishes a trend.
The market may stay a very extended period of time in sideways, providing a lot of profitable trading opportunities.
What I like about Gold consolidation trading is that the strategy is very straightforward and completely appropriate for beginners.
It works on any time frame and can be used for intraday, swing trading and scalping
❤️Please, support my work with like, thank you!❤️
I am part of Trade Nation's Influencer program and receive a monthly fee for using their TradingView charts in my analysis.
Gold (XAU/USD) Breakout & Retest Trade Setup - Bullish Move!Gold (XAU/USD) has successfully broken out of the consolidation zone after a strong rally. The price action recently tested the previous resistance level, which is now acting as new support.
Trade Setup:
Entry: Price has retested the breakout zone and is showing signs of bullish momentum.
Support: The previous resistance area (now turned support) is holding well.
Stop Loss: Placed just below the support at $3,034.562 to manage risk.
Target: A potential upside move towards the $3,055 zone, which aligns with the next key resistance level.
This setup follows a breakout-retest continuation pattern, a classic technical strategy where price revisits a breakout level before resuming the trend. If bullish momentum continues, we can expect a move towards the projected target.
📌 Key Levels to Watch:
Support: $3,034.562
Resistance/Target: $3,055
Current Price: $3,039.925
💡 Risk-to-Reward Ratio: Favorable, as the stop loss is placed strategically below support.
⚠️ Disclaimer : This is not financial advice. Always manage your risk and use proper risk management techniques.
What are your thoughts on this setup? Will Gold push higher or face rejection? Let me know in the comments! 🚀💬

Silver Update | $40This TA focuses on long term projections using the last fractal pattern and a fibonacci extension to help with finding targets.

GBPAUD Wave Analysis – 18 March 2025- GBPAUD reversed from the support zone
- Likely to rise to resistance level 2.060
GBPAUD currency pair recently reversed from the support area between the support level 2.0290 (former multi-month resistance from December) and the 38.2% Fibonacci correction of the upward impulse from February.
The upward reversal from this support zone stopped the previous short-term ABC correction 4.
Given the strong multi-month uptrend, GBPAUD currency pair can be expected to rise to the next resistance level 2.060 (which reversed the previous upward impulse wave 3).

GBPUSD Wave Analysis – 18 March 2025
- GBPUSD reversed from support zone
- Likely to rise to resistance level 1.3050
GBPUSD currency pair recently reversed from the support zone between the support level 1.2900 and the upper trendline of the daily up channel from January.
The upward reversal from this support zone created the daily Japanese candlesticks reversal pattern Bullish Engulfing - which continued the active impulse wave (C).
Given the strongly bullish sterling sentiment, GBPUSD currency pair can be expected to rise to the next resistance level 1.3050 (the former monthly high from November).

NZDCAD: Bearish After the News?! 🇳🇿🇨🇦
NZDCAD turned bearish after a release of Canadian Inflation data.
The price retraced from a key daily resistance and broke
a support line of a rising parallel channel on an hourly time frame.
The market may drop at least to 0.8293
❤️Please, support my work with like, thank you!❤️
I am part of Trade Nation's Influencer program and receive a monthly fee for using their TradingView charts in my analysis.

Euro will rebound from support area and continue to move upHello traders, I want share with you my opinion about Euro. This chart illustrates how the price entered an upward channel and immediately broke below the 1.0500 support level. After trading for some time within the buyer zone, it dropped to the support line. Following this move, the Euro reversed and started climbing, eventually reaching the 1.0500 level again, breaking above it, and making a retest. The price then continued to rise and later reached the current support level, which coincided with the support area and the channel's trend line, where it traded for a while. Soon after, the Euro broke through the 1.0805 level and remained within the support area for an extended period before climbing to 1.0945. At that point, it reversed and started declining. The Euro quickly dropped to the support line of the channel and then bounced back up. However, it recently fell again to the support line of the channel, where it has been gradually moving higher since. Given this setup, I expect the Euro to decline to the support area before rebounding and continuing its upward movement within the channel. Based on this, my TP is set at 1.1150. Please share this idea with your friends and click Boost 🚀

GOLD - Price can correct to support area and then continue growHi guys, this is my overview for XAUUSD, feel free to check it and write your feedback in comments👊
A few moments ago price started to grow inside a rising channel, where it so long rose near support line and reached $2845 level.
Then Gold broke this level, exited from channel and started to trades inside flat, where it at once made retest.
After this movement, Gold started to grow and later grew to top part of flat, which coincided with $2955 level.
Price some time traded near this level and then corrected to support area, after which started to grow.
Gold rose to $2955 level and broke it, thereby exiting from flat too and then it continued to move up next.
Possibly, Gold can fall to the support area, correcting, and then continue to rise to $3040
If this post is useful to you, you can support me with like/boost and advice in comments❤️

Bitcoin (BTC/USD) Potential Breakout from the Downtrend Channel!Bitcoin is currently trading inside a descending channel, with price consolidating in a small range. A breakout from this zone could trigger a strong bullish move toward the upper boundary of the channel.
🔹 Key Observations:
BTC is trading within a well-defined downward channel.
Current Consolidation: A small range has formed, suggesting a potential buildup before a breakout.
Target Projection: If price breaks out, we could see a move toward the 90,790 level, aligning with the upper trendline.
📈 Bullish Scenario:
A breakout above the consolidation area may lead to a push toward 90,790.
Confirmation of strength will be needed above resistance levels.
🔻 Bearish Risk:
If rejection happens at resistance, BTC may continue downward within the channel.
💡 Key Levels to Watch:
Resistance Target: 90,790
Current Support: 82,500
Will BTC break out of the downtrend, or will the channel continue to hold? Let’s discuss below! 📊🔥

HelenP. I Gold will continue to move up in upward channelHi folks today I'm prepared for you Gold analytics. Looking at the chart, we can see that the price entered the channel and began moving higher along the trend line. Soon, it climbed to Support 2, which aligned with the support zone, broke this level, retested it, and then continued its upward movement. Later, Gold reached Support 1, which also coincided with a support zone. Shortly after, it broke this level as well, reaching the resistance line of the channel before making a correction to another support zone. The price traded around this area for some time before making a corrective move below Support 1, even briefly breaking the trend line in a false breakout. However, it quickly resumed its upward movement within the channel. Gold then broke through Support 1 again, retested it, and rebounded from the support zone. Based on the current structure, I expect XAU/USD to make a corrective move toward the trend line before continuing its growth inside the upward channel. Given this scenario, my goal is set at 3070 points. If you like my analytics you may support me with your like/comment ❤️

Gold (XAU/USD) Sell-Off Continues | Bearish Target insightGold Spot (XAU/USD) indicates a potential continuation of the current downtrend.
🔹 Sell Limit at 3082: A significant level where a sell order was placed, marking the start of the recent decline.
🔹 Strong Downtrend: After rejecting the 3082 level, gold has been making lower highs and lower lows, confirming bearish momentum.
🔹 Support & Target Zone: Price is approaching a key support area near 2880-2900, which aligns with the marked target level.
📉 Bearish Outlook:
If the price breaks below the current support, further downside is expected.
A potential bounce could occur at the target zone before a trend reversal.
💡 Key Levels to Watch:
Resistance: 3082
Support/Target: 2880-2900
Traders should monitor price action at support to determine if further downside is likely or if buyers step in for a potential reversal.
What’s your outlook on gold? Will the bearish trend continue? 📉💰

Orbs to provide a 20x?Welcome back dearest reader!
Today we will analyse another project called Orbs. Looking at their website the fundamentals look great! But other than that, the chart also looks fantastic!
When looking at past performance its clear orbs has been in a massive flag formation since march 2021, it has broken out in october 2023 and has just now touched a very important support zone! Expecting upside momentum from here untill august.
Target: 0.40$
Stoploss: 0.0145$

NASDAQ INDEX (US100): Important Breakout I spotted a great example of a bullish reversal on 📈US100.
The index formed a double bottom pattern on a 4-hour chart and broke and closed above a resistance line of a descending channel.
There is a positive response on retesting the key support level based on a broken neckline.
It is expected that the index will continue to rise towards the 20,000 / 20180 levels.

GOLD is at temporary topaccording to this massive and long-term rising channel for gold, seems like the top is so close & we might see temporary pull back to the bottom of this channel which makes sense, because it is the previous ALL TIME HIGH

OMUSDT → Paranormal behavior. Rally readinessBINANCE:OMUSDT as a whole looks stronger than the market. After a strong rally a correction in the format of a bearish wedge is formed, subsequently the price broke the resistance and is trying to consolidate above the key support
Against the background of a weak market OM coin has good prospects as technically someone is interested in this project and the coin as a whole behaves strongly and looks stronger than the market.
A breakout of the bearish wedge (consolidation pattern within the correction) is forming. If the bulls keep the coin above the previously broken figure resistance and above the base of the 6.752 reversal pattern, the growth may continue in the short to medium term
Resistance levels: 7.39, 7.98
Support levels: 6.752, 6.51
One of the few coins that is rising while bitcoin is falling. Focus on the previously mentioned support levels, as well as on the local resistance 7.05, the break of which may provoke a prolongation of growth
Regards R. Linda!

GBPUSD → Consolidation after a trend breakout. Long-Squeeze?FX:GBPUSD may test the local support amid the pre-news correction of the DOLLAR. Traders are waiting for inflation data, high volatility is possible
The fundamnetal situation is predisposed in favor of the pound sterling, which has an advantage on the back of the falling dollar, which is likely to take a medium-term position on the back of the Trump administration.
Technically, GBPUSD is consolidating above the key support zone of 1.286 - 1.280 below which a huge pool of liquidity has formed which could be tested before the trend continues.
Important news ahead. Traders are waiting for CPI data. High volatility is possible
Resistance levels: 1.2938 (trigger)
Support levels: 1.2868, 1.281, 1.2728
Bulls may be aggressive and keep the price from correcting downwards. In this case, price consolidation above 1.2938 could be a good entry point for the continuation of growth. But because of the upcoming news, I would prefer to wait for a retest of the liquidity zone 1.2868 - 1.281 before taking action to open a position.
Regards R. Linda!
