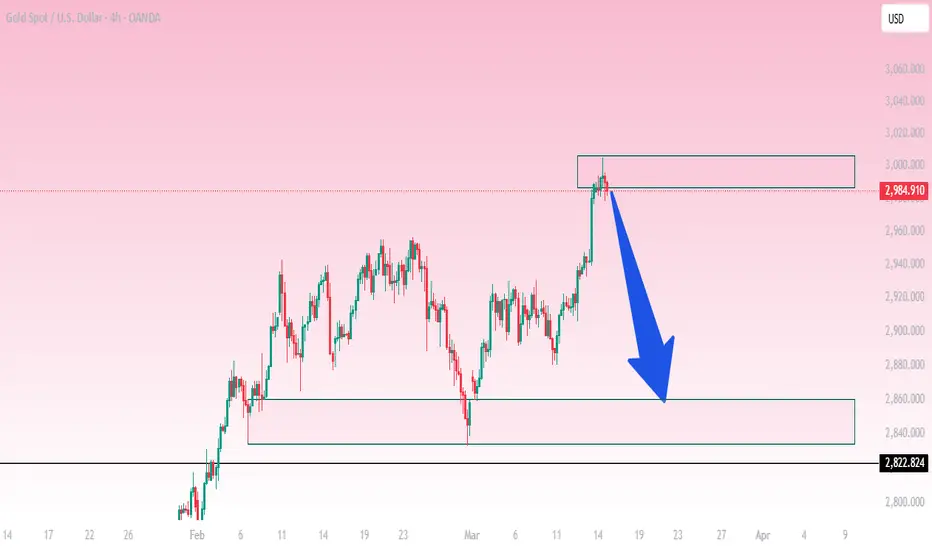
Gold (XAU/USD) - Potential Liquidity Sweep Before ReversalGold has been in a strong uptrend, forming a rounded bottom pattern, which led to a breakout above key resistance. Currently, price is consolidating near the all-time high (ATH) around $3,005, suggesting a potential liquidity sweep before a larger move.
📌 Key Observations:
Rounded Bottom Formation: A bullish reversal pattern led to a breakout.
Consolidation Zone: Price is ranging just below the ATH, likely gathering liquidity.
Liquidity Sweep & Weak Highs: The chart suggests a push above the ATH to trigger stops before a potential reversal.
Projected Bearish Move: A break lower could lead to a corrective move towards $2,920 - $2,800 in the coming sessions.
⚠️ Trading Plan:
Bullish Scenario: A clean breakout above ATH with strong volume could invalidate the bearish setup.
Bearish Scenario: If the liquidity sweep occurs and price fails to hold above ATH, a strong sell-off could follow.
Traders should watch for confirmation signals before entering any positions. Stay cautious and manage risk effectively!
📊 What are your thoughts? Will gold continue higher or reverse? Share your views below!
#XAUUSD #Gold #Trading #Forex #LiquiditySweep #ATH
Parallel Channel

AUDNZD giving signs of bearish trendCurrently, the price is breaking an important support level, which has been tested a couple of times. Apart from this violation of parallel channel, it can be seen that as soon as the price broke the lower trendline, it returned to retest that level and went down sharply. Our bearish trend will be confirmed once the price marks LL and comes back for LH; then, we can either place a sell limit or sell stop order

BITCOIN → Short-squeeze 86-89K before falling further to 75KBINANCE:BTCUSD continues to form a downtrend after breaking the bullish structure on the weekly timeframe. There is no bullish driver yet, and technically, the price is heading to the global imbalance zone of 75-73K
The past crypto summit and any other talk of cryptovalt support cannot support the market. Such events end with further market decline.
Technically, the market continues to form a downtrend (global counter-trend), based on this alone, we can say that the price is now going against the crowd and this is generally logical behavior. Globally, the zone of interest is located in the following zones - 75K, 73K and order block 69-66K
Locally, I would emphasize the nearest liquidity zones, located at the top, which can be tested before the further fall: 86697, 89.397
Resistance levels: 85135, 86678, 89397
Support levels: 79987, 78173, 73512
After the false break of 78K support there is no strong reaction, the market is forming a struggle for 84-85K zone, which generally indicates buying weakness. Before the further fall there may be a short-squeeze relative to the above mentioned zones of liquidity, which may lead to a further fall
Regards R. Linda!

Bitcoin Rejection at Resistance – More Downside Ahead?BTC/USD is trading within a descending channel, and price is now testing a key resistance zone near $84,500. If sellers step in, we could see a strong rejection leading to a further drop.
📍 Trade Setup:
Short Entry: Near $84,500 - $85,000 (resistance zone)
Stop Loss: Above $87,400 (to invalidate bearish setup)
Target: $71,700 - $71,500 (lower boundary of the channel)
🔍 Technical Factors:
✔️ Bearish market structure with lower highs and lower lows
✔️ Resistance zone acting as a strong supply area
✔️ Descending channel guiding price lower
💡 Trading Plan:
Look for rejection signs (bearish wicks, engulfing candles, or trendline rejections) before confirming a short position.
A break above $87,400 could invalidate this setup and signal a potential reversal.
📢 What’s your view? Will Bitcoin break down, or are the bulls ready to take control? Let’s discuss! 🚀👇

XAU/USD Reversal Setup – Potential Drop Incoming!Gold (XAU/USD) has recently tested a key resistance zone around $2,990, where price action is showing signs of rejection. The market made a strong bullish push, but the momentum appears to be fading near this supply zone.
📉 Possible Scenario:
A bearish reaction from this resistance level could lead to a retracement towards the next key demand zone between $2,860 - $2,840.
If selling pressure continues, we might even see a retest of the $2,822 support level.
🔍 Technical Outlook:
Price is currently at a resistance zone, making it a high-probability short setup.
Confirmation with bearish candles or trendline breaks could provide more confidence for sell entries.
Targets for shorts are set at $2,860 and potentially $2,822.
💡 Trading Plan:
Look for bearish confirmations (rejections, engulfing patterns, trendline breaks) before entering short trades.
A daily close above $3,000 would invalidate this setup and could signal further bullish movement.
What do you think? Are you bearish or bullish on Gold? Drop your thoughts in the comments! 📊🔥
Royalty Breakout: A 60% Move in the Making?This is the monthly chart of royalty companies FNV, WPM, RGLD, SAND, and OR combined. A five-year consolidation was recently broken on the weekly timeframe, with confirmation. The last similar breakout after consolidation led to a ~150% increase from the bottom.
At today's gold price of $3,000, this scenario looks highly probable. If it unfolds, these companies could see a cumulative gain of around 60% from current levels.

DOGEUSDT near major daily supportsAs we can see price can easily dump more to the 0.9$ support zone but soon we can expect channel resistance to break too and if that happen then market is once again bullish and bull candles can easily pump the price to 0.30$ at least.
DISCLAIMER: ((trade based on your own decision))
<<press like👍 if you enjoy💚

GOLD will dump to 2800$ and then 2600$ which is 0.38Fib supportsoon we are looking for correction and dump for gold after months of being bullish and this fall or dump can be short-term and end near 2800$ or it can continue to hit targets like 2600$ even.
DISCLAIMER: ((trade based on your own decision))
<<press like👍 if you enjoy💚

BTC Speculative Elliot Wave Count (Diagonal as C)This sketch is based on the channels generated by my automated custom indicator, "Seer Tee," designed to replicate Candle Range Theory (CRT) by @Romeotpt.
**Assumptions:**
1. We are in a corrective zigzag wave's final progressive wave, C.
2. Wave C is a diagonal.
3. The second internal wave of the diagonal forms an expanded or running flat.
4. The flat includes a diagonal C.
Any invalidation of these assumptions will necessitate a revision of the entire count. Therefore, this sketch is a hypothetical, fragile, and speculative representation of the count.

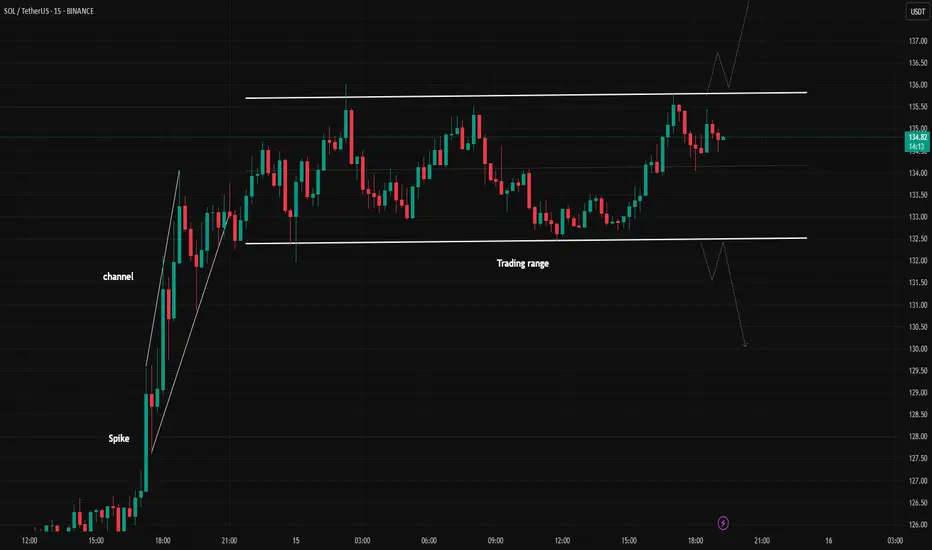
SOLUSDT Upward or downward?Hello,
In the 5-minute timeframe, you can sell at the top of the trading range and buy at the bottom of the trading range (by observing reversal candles and patterns).
Alternatively, you can wait for a breakout and enter in the direction of the breakout.
Be mindful of fake breakouts.
May your trades be profitable!
ATOM ANALYSIS📊 #ATOM Analysis
✅There is a formation of Descending Channel Pattern in weekly time frame.
After a breakout of the pattern we would see a bullish momentum and can Target for $7.6 in few weeks🧐
👀Current Price: $4.680
🎯 Target Price : $7.600
⚡️What to do ?
👀Keep an eye on #ATOM price action and volume. We can trade according to the chart and make some profits⚡️⚡️
#ATOM #Cryptocurrency #Breakout #TechnicalAnalysis #DYOR

Gold can exit from wedge and then continue grow to 3100 pointsHello traders, I want share with you my opinion about Gold. This chart shows how the price moved upward within a rising channel, reaching the 2665 level, which aligned with the buyer zone, and breaking through it. After that, the price retested this level and continued to rise within the channel. It then touched the support line, rebounded to the current support level, and broke through that as well. Following this, Gold made another retest and climbed to the resistance line of the channel before starting to decline. In a short time, the price dropped to the channel’s support line, then broke out of the pattern and continued falling within an ascending wedge. Eventually, it reached the 2835 support level, which coincided with the wedge’s support line and a broader support area, before beginning to recover. For some time, Gold traded near the wedge’s support line, and recently, it rebounded and reached the resistance line. Given this structure, I believe Gold may first make a corrective move before breaking out of the wedge by surpassing the resistance line. If that happens, I expect further growth, which is why my TP is set at 3100. Please share this idea with your friends and click Boost 🚀

BITCOIN - Price can reach resistance line of wedge and then dropHi guys, this is my overview for BTCUSDT, feel free to check it and write your feedback in comments👊
Some time ago price started to decline inside falling channel, where it aat once boucned from support line and rose to resistance line.
Then it continued to fall and reached $91300 level, broke it soon, and continued to decline next.
Price exited from channel and started to trades inside wedge, where it at once made upward impulse to $91300 level.
After this, price some time traded near $91300 level and then in a short time declined to support area.
But soon, BTC bounced from this area and recently it started to grow from $80000 support level.
In my mind, Bitcoin can rise to resistance line and then drop to $77850 support line of wedge pattern.
If this post is useful to you, you can support me with like/boost and advice in comments❤️

MDT ANALYSIS📊 #MDT Analysis
✅There is a formation of Descending Channel Pattern in daily chart. Currently #MDT is in bearish way.
After a breakout of the pattern and major resistance level we would see a bullish momentum otherwise the price will drop more 🧐
👀Current Price: $0.02980
⚡️What to do ?
👀Keep an eye on #MDT price action and volume. We can trade according to the chart and make some profits⚡️⚡️
#MDT #Cryptocurrency #Breakout #TechnicalAnalysis #DYOR

DEGOUSDT → An attempt to change the trend will end in a fallBINANCE:DEGOUSDT.P tried to break the trend, but faced strong resistance and a weak cryptocurrency market. The fall may continue...
After breaking through the resistance of the descending channel, a bullish momentum (distribution) of 45% is formed, but the price bumps into a strong resistance of 2.11 - 2.18, which forms a trading range. Bears are not ready to give this zone to buyers and put pressure, a false breakout of resistance is formed after a long struggle for this zone and liquidation is formed when the base of 2.0 is broken. Buyers are in the panic zone. If the price fixes below 2.11 - 2.18, the fall in the short or medium term may continue.
Resistance levels: 2.00, 2.18, 2.274
Support levels: 1.75, 1.584, 1.359
The market is generally weak and altcoins are reacting aggressively to local bitcoin movements (the point of which is to gather liquidity before a further fall). BTC has not yet reached a key target, which together with the lack of a bullish driver in the market creates pressure for altcoins.
Regards R. Linda!

Bitcoin - 60% crash to 32K | ETH is dying | Trump scam?Technically, Bitcoin is entering a huge bear market! This is what my charts and fundamentals tell me at the moment.
Trump returned to the White House on January 20, 2025. This day, Bitcoin hit a new all-time high (109,588 USD), and since then, Bitcoin has been going only down! In 2019, Trump said he is not a fan of crypto. x.com
So isn't it weird that Bitcoin has been going down since the beginning of his presidential post? (On January 20). Random or planned? Answer by yourself, but something seems to be fishy here. What about the latest Trump post on TruthSocial about the strategic crypto reserve? The market reacted very positively, but after a few days, the whole market completely crashed and is now finding its new low. Was this another trap? Clearly, everyone who bought into this news is at a loss on his trading account; that's for sure.
What is happening to Ethereum? Ethereum is almost at the same price it was in 2018!! 7 years ago, the price of Ethereum was 1440 USD; the current price is around 1700 USD. I predict ETH to go to 750 USD in 2026. Why is this new technology struggling? Investors all over the world and early adopters are very disappointed by the performance of this coin. It also seems like the crypto market completely collapses, and only Bitcoin is surviving. Even though Bitcoin hit only 109k, which was most likely the ultimate top for the next few years, it was also less than everyone expected. I don't really want to talk about other altcoins because they are down 95% to 99%, and this bull market did nothing (sideways price action). In conclusion, this was the weakest bull market in history.
From a technical point of view, Bitcoin (and all altcoins) is breaking down on the weekly chart! The bullish market structure is broken, and we entered a new downtrend. Where to buy BTC, ETH, SOL, XRP, and other coins? You can write me a comment below, and I will tell you. I start with BTC—buy Bitcoin at the 0.618 FIB retracement. This FIBO is at 32 688 USDT, so we need to wait 1 year for the price to come to this level. Be patient.
So what to buy? Maybe focus on very low-cap coins; they do not follow the general trend (bull or bear). I have a tip for many coins, such as ATC (AutoTCrypto). Contract EQBMxFekc39SONbY8Mes8IwnZZlsPzeZhwz2c7sqMkkjI0uy. Where to buy? Use a decentralized exchange, such as dextools or ston.fi.
Write a comment with your altcoin + hit the like button, and I will make an analysis for you in response. Trading is not hard if you have a good coach! This is not a trade setup, as there is no stop-loss or profit target. I share my trades privately. Thank you, and I wish you successful trades!

Amd - Please Look At The Structure!Amd ( NASDAQ:AMD ) is about to retest massive support:
Click chart above to see the detailed analysis👆🏻
For about 5 years Amd has been trading in a decent rising channel formation. That's exactly the reason for why we saw the harsh drop starting in the beginning of 2024. But as we are speaking, Amd is about to retest a massive confluence of support which could lead to a beautiful reversal.
Levels to watch: $100
Keep your long term vision,
Philip (BasicTrading)

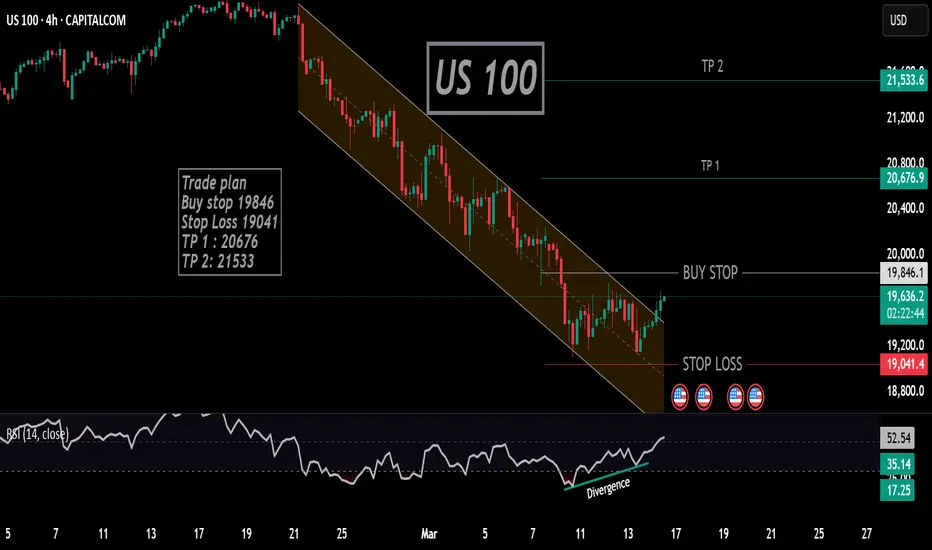
US 1001#bearish channell bearkout
2# double bottom
3# also Bulish Divergence.
Trade plan
Buy stop 19846
Stop Loss 19041
TP 1 : 20676
TP 2: 21533
EURUSD Faces Resistance zone – Will Bears Take Over?The EURUSD ( FX:EURUSD ) has reached the Resistance zone($1.0983-$1.0916) as I expected in my previous post . Can the EURUSD break the Resistance zone($1.0983-$1.0916) ?
EURUSD is moving near the Resistance zone($1.0983-$1.0916) , the Resistance line , and Yearly Resistance(1) .
According to the Elliott Wave theory , EURUSD seems to have completed 5 impulse waves and we can expect Corrective Waves .
Also, we can see the Regular Divergence(RD-) between Consecutive Peaks .
I expect the EURUSD to decline to at least the Support zone($1.0817-$1.0760) in the coming hours after breaking the lower line of the ascending channel . One of the EURUSD targets could be as wide as the ascending channel .
Note: If EURUSD breaks the Resistance zone($1.0983-$1.0916), we can expect more pumps.
Please respect each other's ideas and express them politely if you agree or disagree.
Euro/U.S. Dollar Analyze (EURUSD), 1-hour time frame.
Be sure to follow the updated ideas.
Do not forget to put a Stop loss for your positions (For every position you want to open).
Please follow your strategy and updates; this is just my Idea, and I will gladly see your ideas in this post.
Please do not forget the ✅' like '✅ button 🙏😊 & Share it with your friends; thanks, and Trade safe.

Gold in a tradingranget seems that gold has entered a tradingrange and is not breaking out for now.
Switch to the 5-minute timeframe; you can enter a trade when you spot reversal candles at the top and bottom of the trading range.
There is a high probability of the channel extending.
Good luck!

GOLD - Price can turn around and start to fall to $2835 levelHi guys, this is my overview for XAUUSD, feel free to check it and write your feedback in comments👊
Price started to grow inside rising channel, where it soon reached $2690 level, but then made small correction.
After this, Gold broke $2690 level, made retest and then continued to move up inside rising channel.
Later price reached $2835 level, which coincided with support area and soon broke it too, thereby exiting from channel.
Next, Gold started to trades inside a flat, where it at once rose to the top part and some time traded near it.
Then price corrected to support level, after which started to grow and now it trades almost near top part of a flat.
In my mind, Gold can reach the top part of flat and then start to decline to $2835 support level.
If this post is useful to you, you can support me with like/boost and advice in comments❤️

EURO - Price can rise a little and then fall to support areaHi guys, this is my overview for EURUSD, feel free to check it and write your feedback in comments👊
Some days ago, the price started to grow inside a rising channel, where it firstly broke $1.0365 level and then reached resistance line.
After this, Euro declined to support line of channel, making a gap, after which, in a short time, it rose to $1.0365 level.
Price some time traded near this level and then continued to grow inside a rising channel, but later it corrected.
Then Euro made strong upward impulse, thereby exiting from rising channel and soon broke $1.0765 level.
Next, price made a retest and continued to move up, so, I think Euro can make a small movement up.
Also, then I expect that Euro may start to decline to $1.0730 support area, breaking support level.
If this post is useful to you, you can support me with like/boost and advice in comments❤️

NZDCAD: Strong Bullish Signals 🇳🇿🇨🇦
I see 2 strong price action confirmations on NZDCAD:
the price broke a resistance line of a bullish flag
and then formed a confirmed change of character CHoCH on a 4H.
I think that the market will continue a bullish rally.
Next resistance - 0.83
❤️Please, support my work with like, thank you!❤️
I am part of Trade Nation's Influencer program and receive a monthly fee for using their TradingView charts in my analysis.
