Pepe - Parallel Chanel Local Monthly Feb RangeThe only thing I can come up with other than a "Magic Pill" is to follow the trend. Follow the short term trend.
Based on this analysis:
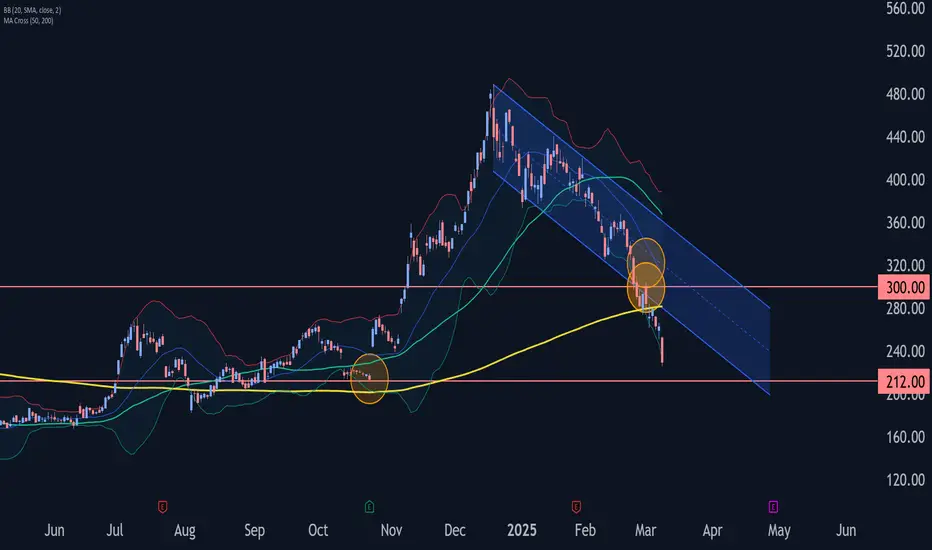
Parallel Channel

Tesla Wave Analysis – 10 March 2025
- Tesla falling inside sharp impulse waves 5 and (C)
- Likely to fall to support level 212.00
Tesla falling inside the sharp downward impulse wave iii, which started earlier from the round resistance level 300.00 (former support broken in February).
The price earlier broke the support trendline of the daily down channel from December – which signalled the acceleration of the active impulse waves 5 and (C).
Tesla can be expected to fall to the next support level 212.00 (former monthly low from October) and the target for the completion of the active impulse wave 5.
BTC/USD Daily Chart Analysis! Detailed AnalysisCurrent Market Overview:
Bitcoin (BTC/USD) is currently trading around $85,963, showing a decline of -0.92% on the daily timeframe. The price action indicates the formation of a potential double top pattern, suggesting a possible trend reversal.
Key Technical Observations:
1. Double Top Formation (Bearish Reversal Pattern)
Top 1 & Top 2 indicate a classic double top pattern, signaling potential weakness in bullish momentum.
The price failed to break above resistance, confirming selling pressure at higher levels.
A confirmed breakdown from this pattern could lead to a significant decline towards key support levels.
2. Breakdown of Ascending Trendline
The chart shows an ascending trendline, which has now been broken.
This break signals a shift in market structure, favoring a potential bearish trend.
After breaking the trendline, BTC/USD may attempt a retest before continuing lower.
3. Support Levels & Take Profit (TP) Targets
TP1: $68,296 – This level acts as the first major support and potential take-profit zone for short sellers.
TP2: $49,433 – A stronger support zone aligning with a previous accumulation area. If BTC breaks below TP1, TP2 becomes the next key level to watch.
Potential Price Scenarios:
🔴 Bearish Scenario (Primary Outlook)
BTC/USD retests the broken trendline or recent highs before continuing downward.
Price drops towards TP1 ($68,296), where a temporary bounce may occur.
If the selling momentum continues, BTC could fall further towards TP2 ($49,433), a major historical support level.
🔵 Bullish Scenario (Less Likely Alternative)
If BTC holds above $85,000 and breaks above the double top resistance, the bullish trend may continue.
A strong push above $90,000 could invalidate the bearish outlook, leading to new all-time highs.
Trading Plan & Strategy:
✅ For Short Entries:
Look for a retest of the broken trendline or rejection at $90,000 resistance before entering.
Target TP1 ($68,296) as the first take-profit level.
If price continues dropping, hold for TP2 ($49,433).
❌ For Long Entries (Risky):
Only consider longs if BTC reclaims the $90,000+ level with strong volume.
Set stop-losses below $85,000 to manage risk.
Final Thoughts:
Bitcoin shows bearish signs with a double-top formation and a trendline breakdown. While a short-term bounce may occur, the overall outlook suggests a move towards $68,000 and potentially $49,000. Traders should wait for confirmation before entering trades. 📉🚨

Uncertainty and Bearish Pressure: U.S. Equities Under TrumpU.S. equities are facing a significantly more challenging landscape than initially anticipated with the arrival of Donald Trump's new administration in 2025. Contrary to some initial expectations, which foresaw a favorable environment for stock market growth driven by lower regulations and a more lenient tax policy, markets are experiencing strong bearish pressures, with the Nasdaq 100 officially entering correction territory after falling more than 10% from its recent highs.
The root of this decline lies primarily in the deep uncertainty created by the lack of clarity and consistency in the government's trade policies. Although the stated goal is to revitalize domestic industry and manufacturing through protectionist tariffs, its implementation has been chaotic and contradictory, leaving investors paralyzed, unable to plan strategic investments due to constant changes in government decisions.
In fact, one could argue that trade uncertainty might have been less damaging if tariffs had been clearly introduced from the outset and then gradually removed through diplomatic negotiations, thus avoiding the current climate of indecision. Adding to this is the pressure stemming from government plans to significantly reduce the federal workforce, heightening fears of a prolonged economic stagnation, especially after President Trump recently failed to publicly rule out a possible recession during this period, which he himself described as a "transition".
Additionally, U.S. equities, which had relied heavily on the strong performance of big tech companies—particularly those boosted by advancements in artificial intelligence—are now facing increasing competition from China, a factor that threatens to erode North America's technological supremacy and further pressure the already lofty valuations of these companies.
Looking ahead, a key factor in all this will be the Federal Reserve's response. Although the central bank has pledged caution in its monetary policy, the economic reality we appear to be heading toward could open the door for additional interest rate cuts, provided that tariff uncertainties do not trigger new inflationary pressures. The evolution of these tariffs and the clarity the Trump administration can provide will be crucial in determining the future direction of the markets.
In summary, the initial promise of growth under the new presidential term has been overshadowed by trade and economic uncertainties, which now dominate investors' agendas. The recent market performance underscores that uncertainty is, perhaps, the greatest enemy of stock market growth at this moment.
Pepperstone doesn’t represent that the material provided here is accurate, current or complete, and therefore shouldn’t be relied upon as such. The information, whether from a third party or not, isn’t to be considered as a recommendation; or an offer to buy or sell; or the solicitation of an offer to buy or sell any security, financial product or instrument; or to participate in any particular trading strategy. It does not take into account readers’ financial situation or investment objectives. We advise any readers of this content to seek their own advice. Without the approval of Pepperstone, reproduction or redistribution of this information isn’t permitted.

Downtrend Forming in Apple?Apple held up better than many large technology stocks last week, but traders may still see downside risk in the smartphone giant.
The first pattern on today’s chart is a potential falling channel since December 26. Continuation of that trend may point toward new lows under $210.
Second, AAPL bottomed at $219.71 in the fourth quarter. The previous quarter’s low was $196. Given weakness in the broader market, could dip-buyers wait for tests of those longer-term levels?
Third, the stock appears to be stalling at its 50- and 100-day simple moving averages. That may reflect a weakening long-term trend.
Next, MACD is falling. The 8-day exponential moving average (EMA) is also at risk of slipping below the 21-day EMA. Those points may reflect weakness in the shorter term.
Finally, AAPL is one of the most active underliers in the options market. (It’s averaged more than 900,000 contracts per day in the last month, according to TradeStation data.) That could make some traders look to position for moves with calls and puts.
TradeStation has, for decades, advanced the trading industry, providing access to stocks, options and futures. If you're born to trade, we could be for you. See our Overview for more.
Past performance, whether actual or indicated by historical tests of strategies, is no guarantee of future performance or success. There is a possibility that you may sustain a loss equal to or greater than your entire investment regardless of which asset class you trade (equities, options or futures); therefore, you should not invest or risk money that you cannot afford to lose. Online trading is not suitable for all investors. View the document titled Characteristics and Risks of Standardized Options at www.TradeStation.com . Before trading any asset class, customers must read the relevant risk disclosure statements on www.TradeStation.com . System access and trade placement and execution may be delayed or fail due to market volatility and volume, quote delays, system and software errors, Internet traffic, outages and other factors.
Securities and futures trading is offered to self-directed customers by TradeStation Securities, Inc., a broker-dealer registered with the Securities and Exchange Commission and a futures commission merchant licensed with the Commodity Futures Trading Commission). TradeStation Securities is a member of the Financial Industry Regulatory Authority, the National Futures Association, and a number of exchanges.
Options trading is not suitable for all investors. Your TradeStation Securities’ account application to trade options will be considered and approved or disapproved based on all relevant factors, including your trading experience. See www.TradeStation.com . Visit www.TradeStation.com for full details on the costs and fees associated with options.
Margin trading involves risks, and it is important that you fully understand those risks before trading on margin. The Margin Disclosure Statement outlines many of those risks, including that you can lose more funds than you deposit in your margin account; your brokerage firm can force the sale of securities in your account; your brokerage firm can sell your securities without contacting you; and you are not entitled to an extension of time on a margin call. Review the Margin Disclosure Statement at www.TradeStation.com .
TradeStation Securities, Inc. and TradeStation Technologies, Inc. are each wholly owned subsidiaries of TradeStation Group, Inc., both operating, and providing products and services, under the TradeStation brand and trademark. When applying for, or purchasing, accounts, subscriptions, products and services, it is important that you know which company you will be dealing with. Visit www.TradeStation.com for further important information explaining what this means.

Resistance on the Edge? A breakout in Sight!In our previous analysis, we anticipated a price drop—and it played out perfectly, securing 10,315.6 pips in profit.
What’s Next?
Now, after analyzing multiple timeframes, we see that the price has bounced off the 2nd large channel’s middle line, a key support level respected multiple times in the past. Currently, it’s trading around 2915.44, near our resistance zone at 2922.
Since March 4 (Tuesday), the price has been testing this level repeatedly, suggesting that the resistance is weakening. If 2922 breaks, our next targets will be:
📍 2940 – Next resistance zone
📍 2949 – First price target
📍 2968 – Second price target
🛡 A trader’s first goal is survival. Profits come second.
🔑 Take care of your losses, and the profits will take care of themselves.
Stay disciplined and trade wisely. Happy trading!

ETH 1900 is gold idea for this Year!!!!ETH 1900 is gold idea for this Year!!!!
If you have idle capital, you can consider buying and holding CME:ETH1! for the long term, as the price of 1900 this year is quite good. Hopefully, it will reach 3000 USDT by the end of the year."

EURO - Price can drop to $1.0700, breaking support levelHi guys, this is my overview for EURUSD, feel free to check it and write your feedback in comments👊
Recently price started to trades inside a broadening wedge, where it at once bounced up from support level to resistance line.
Then Euro some time traded in a range, and then dropped to support line of wedge, breaking $1.0420 level.
After this, Euro turned around and made strong upward movement to resistance line of a broadening wedge.
Also, it broke $1.0420 level and soon exited from broadening wedge and broke $1.0770 level too.
Next, Euro continued to move up inside rising channel, where it rose from support level to resistance line.
Possibly, price can rise a little in a channel and then bounce down to $1.0700, breaking support level and exit from channel.
If this post is useful to you, you can support me with like/boost and advice in comments❤️

GBPAUD → Correction to strong support before continuing growthFX:GBPAUD is forming a range with a consolidation target after breaking the base of the ascending triangle. The pound is correcting due to the dollar
Technically, on the daily timeframe we have a strong bullish structure, the price is trying to accelerate after breaking the trend resistance, but against the background of the dollar correction the pound sterling is also making a small pullback. There are no strong fundamental changes and the general direction may continue.
At the moment the focus is on ob, located in the zone of 2.0285, as well as the liquidity zone, which is located below 2.0285 + weekly low - 2.015, which also hides a huge pool of liquidity that can be tested.
Resistance levels: 2.05088
Support levels: 2.0285, 2.0151
On the background of the uptrend and the correction to the support after the update of the maximum, we can consider the strategy - false breakdown of the support with the purpose of continuation of the growth. Emphasis on 2.0285 - 2.015
Regards R. Linda!

BITCOIN → The fall continues... 82K → 76K → 73KBINANCE:BTCUSD is in a sell zone. Trump's comments on the federal reserve, crypto summit failed to impact the crypto market other than a global shakeup and liquidation...
The market has failed to see a proper bullish driver, so far. Trump's comments on the Fed ended in a global shakeup (liquidation). Yesterday's summit went so far as to prevent the cryptovalt market from turning green.
Technically. Global growth is temporarily halted, the flagship is moving into a deep correction phase, with 73K still the primary target. The market needs liquidity, as it will not be possible to grow at the expense of buyers and only bullish leverage all the time.
Price is forming a 90K - 82K range in the short zone after exiting the global consolidation. False break of 91K resistance ( global consolidation support ) ended with a fall, which may continue to both 82K and 73.5K.
Resistance levels: 89400, 91K, 93K
Support levels: 82K, 78K, 73K
The key zone of interest and liquidity is 73-66K. The price is working on a false break of resistance, the imbalance of forces in favor of bears, thus the first stop may happen in the zone of 82K ( lower boundary of the range ). Further it is necessary to observe the reaction to the support. Consolidation, breakdown and consolidation below 82K will provoke a fall to lower targets.
Regards R. Linda!

BITCOIN - Price can continue to grow inside rising channelHi guys, this is my overview for BTCUSDT, feel free to check it and write your feedback in comments👊
Some time ago, price entered a falling channel, where it reached resistance line and then continued to fall.
In a short time, price declined to $98000 level, after which rose a little and then dropped to support line of channel.
After this, price rose to resistance area and soon broke $98000 level and continued to decline next.
BTC fell to $83600 level and even lower, thereby exiting from falling channel and started to grow in another channel.
In rising channel, Bitcoin grew a little and then corrected, after which it continued to move up.
So, I expect that Bitcoin can correct a little and then rise to $98000 resistance level.
If this post is useful to you, you can support me with like/boost and advice in comments❤️

Gold can reach seller zone and then drop to support levelHello traders, I want share with you my opinion about GOLD. Looking at this chart, we can observe how the price moved within an upward channel before reaching the resistance line and making a corrective move down to the support line. After that, Gold climbed to the support level, which aligned with the buyer zone, and eventually broke through, exiting the channel. Following this breakout, XAU began trading within a range, briefly pulling back to the buyer zone before resuming its upward movement. Shortly after, Gold reached the seller zone and consolidated there for some time, as this area coincided with the upper boundary of the range. Later, the price made a correction down to the support level before reversing direction. Since then, the price has been rising steadily, and at this point, it remains in an uptrend. Given this setup, I expect Gold to re-enter the seller zone before initiating a decline toward the support level, which aligns with the lower boundary of the range. Based on this, my target is set at the 2850 support level. Please share this idea with your friends and click Boost 🚀

NETSOL-Leveraging Parallel ChannelNetsol is currently moving in a parallel channel and is available at lower line i.e. 135.56. Can be bought at CMP with SL of 123.20 and TP can be 168 i.e. upper channel line

STCL-Leveraging channel movementShabbir Tyle seems to move in a channel and is currently available at the lower channel line. Buying at CMP of 13.02 can give TP of upper channel line i.e. 17.20 while SL can be 11.30

GOLD - Price can correct to support level and then start to growHi guys, this is my overview for XAUUSD, feel free to check it and write your feedback in comments👊
The chart shows how the price rose in a rising channel, reaching the $2925 level before breaking it.
Then it touched resistance line of channel and made correction to $2925 level, where it some time traded.
After this, price moved up and then started to decline inside a triangle, where it soon exited from channel.
Next, price broke $2925 level and declined until to support line of the triangle, breaking $2880 level too.
But soon, Gold made strong movement up, breaking $2880 level and rose to resistance level, after which it corrected.
Now, I think that XAU can exit from a triangle, fall to support level and then start to grow to $2940
If this post is useful to you, you can support me with like/boost and advice in comments❤️


XAU/USD Daily Chart Analysis! Detailed ExplainationMarket Overview:
Gold (XAU/USD) is currently trading around $2,910, showing a slight decline of -0.05% on the daily timeframe. The market has been in a strong uptrend, breaking previous structures and forming higher highs and higher lows. However, the current price action suggests a potential pullback before another bullish continuation.
Key Technical Observations:
1. Resistance & Strong Resistance Zone ($2,950 - $3,000+)
The price has reached a strong resistance zone near the $3,000 psychological level, where selling pressure is evident.
A weak high has been marked, indicating that buyers may attempt to break this level, but sellers could push the price down before any significant breakout.
If price successfully closes above this resistance, it could trigger further bullish momentum towards $3,100 or higher.
2. Support and Demand Zone ($2,750 - $2,800)
The demand zone between $2,750 and $2,800 has historically acted as a strong support level.
This zone aligns with previous price accumulation and a key structural support level.
A pullback to this area could present buying opportunities, as institutional buyers may step in.
3. Market Structure and Breaks of Structure (BOS) & Change of Character (ChoCH)
Multiple Change of Character (ChoCH) points have been noted, signaling shifts in momentum.
The Break of Structure (BOS) suggests a continuation of the prevailing bullish trend, with minor corrections along the way.
The most recent ChoCH indicates a potential short-term bearish retracement before a continuation to the upside.
4. Strong Low and Potential Support Levels ($2,500 - $2,600)
The strong low is marked below $2,500, which acts as a long-term support zone.
If the demand zone at $2,750 - $2,800 fails, the next major support area lies around $2,600.
However, given the overall bullish trend, a drop to these levels would likely be short-lived unless macroeconomic factors shift significantly.
Potential Price Scenarios:
🔵 Bullish Scenario (Primary Outlook)
Price may retrace towards the $2,750 - $2,800 demand zone.
If buyers defend this level, we can expect a bullish reversal towards $2,950 - $3,000 resistance.
A strong breakout above $3,000 would likely trigger further upside momentum towards $3,100+.
🔴 Bearish Scenario (Alternative Outlook)
If sellers take control and push price below the $2,750 support, further downside could follow.
In this case, the next major support levels would be $2,600 - $2,650, where buyers may re-enter.
A breakdown below $2,500 would signal a shift in long-term market structure, invalidating the bullish trend.
Trading Plan & Strategy:
✅ For Long Entries:
Look for bullish price action (e.g., pin bars, bullish engulfing candles) in the $2,750 - $2,800 demand zone.
Target $2,950 - $3,000 as the first take-profit level.
If price breaks above $3,000, hold positions for a move towards $3,100 or higher.
❌ For Short Entries:
If price struggles to break above $3,000, short positions can be considered with stop losses above resistance.
Targets for short trades: $2,800 (first TP), $2,650 (second TP).
Final Thoughts About Trend:
Gold remains in a strong bullish trend, but a short-term retracement could be expected before the next rally. Traders should focus on key levels like $2,750 - $2,800 support and $3,000 resistance to confirm the next move. Watch for confirmation signals before entering trades. 📊🚀

OTHERS looking very interesting..I think OTHERS is about to show some strength personally. The Daily is rounding to the bottom and price action is showing steeper upward movement. These are the targets is either side breaks. I would like to see at least a quick capitulation down to the green area before I would recommend diversifying into these assets/memes/god only knows.
#NFA #Godspeed

Amazon - Catch The Parabolic Rally Now!Amazon ( NASDAQ:AMZN ) will start the parabolic rally:
Click chart above to see the detailed analysis👆🏻
Just a couple of months ago, we finally saw the expected all time high breakout on Amazon. Following the overall governing rising channel pattern, I simply do expect the acceleration of the current rally, the creation of a parabolic rally, but maybe we will see a bullish retest first.
Levels to watch: $180, $400
Keep your long term vision,
Philip (BasicTrading)

Berkshire Hathaway - Gearing Up for a Bullish RallyNYSE:BRK.B is exhibiting strong bullish momentum, supported by consistent price strength and a clear uptrend. Recent price action confirms buyers' dominance, with the stock pushing higher and breaking through key levels, signaling further upside potential.
With no significant resistance ahead, the next logical target is $519.50, aligning with the upper boundary of the channel. If you agree with this analysis or have additional insights, feel free to share your thoughts in the comments!

GOLD → Consolidation ahead of NFP. What can happen?FX:XAUUSD is heading for resistance after a false breakdown of 2895. The market continues to test 2926 with the aim to break this zone. There is news ahead and the risks of increased volatility are growing.
Markets remain jittery over Trump's tariff plans, which supported gold demand. Trade tensions and mixed U.S. jobs data are adding to inflation risks, which could weaken the dollar. All eyes are on the NFP report.
Based on the analysis of the last few reports, a rough conclusion is that on average in the first 15 minutes, weak data led gold to rise 60 points and strong data led gold to fall 50 points
However, other factors such as inflation and data revisions may dampen the market reaction. The final effect depends on investors' assessment of the Fed's future policy.
Resistance levels: 2926, 2942
Support levels: 2912.5, 2909.5, 2895
Before the news, the price may test 2926 with a false breakout (MM trap for liquidity) and roll back to the nearest support.
But further prospects depend on the news. Gold is in consolidation 2926 - 2895. On the background of possible weak data gold may overcome 2926 and accelerate to ATH. Strong data may provoke profit taking and correction to 2895 - 2875
Regards R. Linda!

AUDUSD → Retest of the imbalance zone before growth FX:AUDUSD on the back of strong dollar decline has all chances for further growth, but today, Friday, the risks are quite high, as NFP is ahead...
The currency pair is forming a local uptrend, in tandem with the falling dollar the Aussie may continue its strengthening course.
On the 4H a local correction to the imbalance zone is forming, where a rather strong support line 0.63 is just passing. The price is forming a false breakout and after capturing liquidity is trying to consolidate higher. If the bulls can keep the defense above 0.63 - 0.633, the price will be able to continue the growth phase in the short and medium term.
Support levels: 0.63, 0.6255
Resistance levels: 0.633, 0.6363
Consolidation above 0.63, subsequent rise and consolidation above 0.633 is an ideal scenario that could confirm the bulls' intentions to go higher. But, NFP and other news are ahead. Risks are rising and we should expect high volatility in the markets
Regards R. Linda!

EURJPY: Bullish Move From Support 🇪🇺🇯🇵
EURJPY looks bullish after a completion
of a consolidation on a key daily/intraday support.
A formation of a bullish imbalance candle provides a strong bullish confirmation.
I think that the price will go up and hit at least 160.33 level.
❤️Please, support my work with like, thank you!❤️
