Do you think GOLD will go up or down today with the Nonfarm newsDo you think GOLD will go up or down today with the Nonfarm news?
In the Asian and European sessions, gold will still have a sideways range, but the range will be smaller than yesterday.
The price reaction will be from the 2916-2919 area down to 2900. And it's likely that today's Nonfarm news will be a liquidity sweep of buy orders to the 38.2% Fibonacci level, which is the 2970-2980 price range
-In summary, this analysis predicts that:
+ Before the Nonfarm news is released, the price of gold may trade within a narrow range.
+When the Nonfarm news is released, there is a possibility that the price of gold will make a temporary sharp move up to around 2970-2980 to "sweep liquidity" from buy orders, before potentially reversing downward.
Parallel Channel

What we saw in 1929 and 2000 is happening in 2025With how bad the economic data is right now, there's no way we can push through this trendline. Short SPY long TLT

GOLD → Consolidation ahead of Friday's NFP. What to expect?FX:XAUUSD stops and forms consolidation within the range 2926 - 2894.9. A false break of support may bring the market back to its senses amid the bearish dollar rally
A weaker dollar and expectations of Fed policy easing are supporting demand for the metal despite a pause in Trump's tariff measures.
Traders are waiting for key NFP data that could determine the future trajectory of the dollar and Fed policy. For today, all eyes are on Initial Jobless Claims.
Technically, gold within the 2926 - 2894 range is looking to test the liquidity zone on the support side as there is an unfilled fvg below 2894.9. Against the backdrop of gold's bullish trend and falling dollar, the chances of a rebound are quite high
Resistance levels: 2926, 2942
Support levels: 2894.9, 2878.7
Price may test the daily low or fvg, form a false breakdown of one of the mentioned support zones and continue to rise after capturing liquidity within the global uptrend
Regards R. Linda!

USDJPY → Readiness to break the daily support levelFX:USDJPY is testing strong key support at 148.64 for a breakdown. A falling dollar could affect further movement
The falling dollar is supporting the Japanese Yen, thus we may see the currency pair falling.
The price is trying to break the support of the daily level. A pre-breakdown consolidation of 150.3 - 148.64 is formed relative to this support. The last retest of the level ended with a small false breakdown, indicating that there is no one to defend the support anymore, there was no reaction except for another local consolidation, the purpose of which is to accumulate the potential to break the support.
Resistance levels: 150.3, 150.95
Support levels: 148.64, 147.17
The focus is on the level of 148.64 concerning which the market is struggling. The bulls have little chance to hold this level, as the dollar's fall exerts quite a lot of pressure.
The breakdown and fixing of the price below 148.64 may provoke a fall to 147 - 144.
Regards R. Linda!

DFDS bearish target hit -> bottom?As shown on an older chart, this was the target for the down trend.. Symmetry + ab=cd reached at channel low and a zone. 54% to the first upside target! Let's go.
SL might be too optimistic, but I'm willing to try a few times.
Would be f'ing epic :D
/edit.. There's a minor first target at gap close at 130

PI/USDT : UPDATE...hello friends
Considering the good growth of this token, it has made a good ascending channel which is well supported by the bottom of the channel and it can be said that it is a valid channel...
Now we expect it to move to the specified goals.
Note that the indicated support is an important support for the price and must be maintained for further growth.
*Trade safely with us*

Plan GOLD 06/03/2025Today the market has no outstanding news, and is waiting for NonFarm news tomorrow
so today is likely to be a sideways range in the area from 2900-2925
Hope you get good buy sell prices in this range
SELL: price range 2925-2930
SL: 2935
TP: 2900
BUY: price range 2890-2900
SL: 2895

GOLD (XAUUSD): Consolidation Continues
On a yesterday's live stream, we discussed that Gold is consolidating
within a horizontal range.
After a test of its resistance, we got a local sideways movement and distribution.
Violation of its minor support is a strong intraday bearish signal.
Because of that, I think that the price may drop to 2900 support.
❤️Please, support my work with like, thank you!❤️
I am part of Trade Nation's Influencer program and receive a monthly fee for using their TradingView charts in my analysis.

Google Update - Trade this range and new ATH Identified Update video on the google Long that has been planned since early FEB. The level has now been hit and we got a nice reaction off that level . In this video I look into where I think we go next and how price plays out .
In the video I use the following tools TR Pocket FIB , 0.618 FIB , Pivots , Parallel Channel and the Fixed range Vol Profile.
If we stay range bound inside the channel then we have the potential to see a new high on google at the top of the channel in confluence with 1-1 ext + tr pocket expansion .
Watch the video and mark the levels on your chart and ensure to set your alerts .
Dont forget to Boost the chart Please and i welcome any questions TY

Bitcoin (BTC/USD) – Symmetrical Triangle Breakout or Breakdown?Bitcoin is currently consolidating inside a symmetrical triangle on the 1H timeframe, preparing for a strong move in either direction!
Key Levels to Watch:
📌 Breakout Target: $105,939 (+18%) 🚀
📌 Breakdown Target: $73,429 (-18%) ⚠️
📌 Resistance Zone: $92,000 (important breakout level)
📌 Support Zone: $84,000 (potential breakdown zone)
Technical Analysis:
🔹 BTC is forming a symmetrical triangle, which typically leads to a strong breakout or breakdown.
🔹 A breakout above $92,000 could send Bitcoin towards $105,939.
🔹 A breakdown below $84,000 could push BTC towards $73,429.
🔹 Confirmation with volume is key before entering a trade!
Trade Plan:
✅ Bullish Scenario: Buy above $92,000, target $105,939
❌ Bearish Scenario: Short below $84,000, target $73,429
🎯 Wait for a confirmed breakout or breakdown before entering a position.
Bitcoin is at a critical decision point—which way will it go? Let me know your thoughts in the comments! 🚀👇

Gold (XAUUSD) Breakout Setup – Targeting $3,014Gold is showing strong bullish momentum on the 1H timeframe, forming a breakout structure with a well-defined resistance and support zone.
Key Levels:
📌 Resistance: Around $2,940 (previous rejection zone)
📌 Support: Around $2,900 (previous consolidation zone)
📌 Target: $3,014 (+3.16% move)
Technical Analysis:
🔹 Gold recently broke out of a bullish flag pattern after a strong uptrend.
🔹 Price successfully retested the support zone and is now pushing higher.
🔹 A breakout above $2,940 could trigger a sharp rally towards the $3,014 target.
🔹 Volume confirmation and strong momentum support further upside potential.
Trade Plan:
✅ Long above $2,940 with a target of $3,014
❌ Stop-loss below $2,900 to protect against fake breakouts
Gold remains bullish, and if the price holds above the breakout zone, we could see a strong move higher! 🚀

Ready to short gold againBrothers, as I strongly expressed my point of view in the last article, short gold near 2916 and 2923, TP: 2895-2885. Gold just fell below 2895 during the decline, hitting our target area as expected. In this short gold transaction alone, I made more than $20K in profit. If you execute the transaction according to the trading strategy published in my channel, I believe you must have made a satisfactory profit.
At present, gold has rebounded again after touching 2894, and is currently trading near 2917. According to the current structure, gold has encountered resistance in the 2930-2940 area many times, and formed a triple top structural resistance in the short-term structure; and before the NFP market on Friday, I think it is difficult for gold to form a unilateral trend market, and it may still be dominated by maintaining a volatile market, so it is not easy for gold to break through the 2930-2940 resistance area in the short term.
So in short-term trading, I think gold is below 2930, and we still have the opportunity to short gold again, but the short-term TP setting can move up to the area around 2910-2900.Bros, profits are the ultimate goal in trading. Accumulating profits is what changes lives and destinies. Choosing wisely is far more important than just working hard. If you want to replicate trade signals and earn stable profits, or if you want to deeply learn the correct trading logic and techniques, you can consider joining the channel at the bottom of this article!


GBPJPY strong bearish expectations
GBPJPY CHANNEL pattern visible, price is break zone and here now expecting to see bearish strong push.
SUP zone: 192.100
RES zone: 188.000, 187.100

GOLD - Price can continue to grow and exit from wedgeHi guys, this is my overview for XAUUSD, feel free to check it and write your feedback in comments👊
The price started to grow inside the rising channel, first reaching the support line and then rising to the $2835 support level.
Next, Gold broke this level and continued to move up and rose to $2930 level, after which started to fall in wedge.
Gold exited from a channel and continued to decline near support line of wedge, but later it bounced to resistance area.
Long time XAU trades in this area and reached resistance line of wedge, after which turned around and started to fall.
Price broke $2930 level and fell to support line of wedge, after which bounced and made a gap.
So, I expect that Gold can correct little and then rise to $2930 level, exiting from wedge pattern.
If this post is useful to you, you can support me with like/boost and advice in comments❤️

HelenP. I Bitcoin can bounce of resistance level and start fallHi folks today I'm prepared for you Bitcoin analytics. A while ago, the price began to decline within a downward channel, briefly rebounding from the resistance zone, which aligned with a key resistance level. BTC then moved up to the channel’s resistance line before dropping back into the resistance zone, where it traded for some time. Later, BTC broke through the 94,800 level and continued falling until it reached the channel’s support line, eventually breaking out of the channel. Shortly after, the price broke below the support level, which also coincided with a support zone, and dropped to the trend line. Following this move, BTC reversed direction and started to rise, eventually testing the support level once again and breaking through it. After that, the price made a retest of the support level, which aligned with the trend line, before making a strong upward impulse toward the 94800 resistance level. However, not long ago, BTC started declining again. Given the current structure, I anticipate that BTC/USDT will revisit the resistance level before reversing and heading down to 88K$, breaking through the trend line along the way. If you like my analytics you may support me with your like/comment ❤️

GOLD → Consolidation v. 2921. Ready for a breakthroughFX:XAUUSD continues to strengthen on the background of growing economic risks and also on the background of aggressive fall of dollar. The metal is at resistance at 2921 and is preparing to go even higher....
The dollar breaks the bullish structure on the background of comments of the U.S. Ministry of Finance on the reduction of rates. The verbal intervention as manipulation is affecting the markets quite aggressively. Further decline in gold is unlikely due to trade war risks and expectations of soft Fed policy.Additional impetus to gold may be given by weak ADP employment data and PMI data
Gold has two important liquidity zones. 2913 and 2903, the closest area has already been tested (liquidity zone reached) and now all eyes are on 2920.7. If it holds, gold will return to 2913-2903 support, if resistance is broken, momentum will be formed.
Resistance levels: 2920.66, 2942, 2954
Support levels: 2913, 2903, (0.5) fibo)
Gold is testing 2913.34 at the moment, a rebound is forming due to the liquidity collected. In the short term, the focus is on 2920.7. Breaking the level and fixing the price above the trigger will most likely provoke the continuation of growth to 2942-2954
Regards R. Linda!

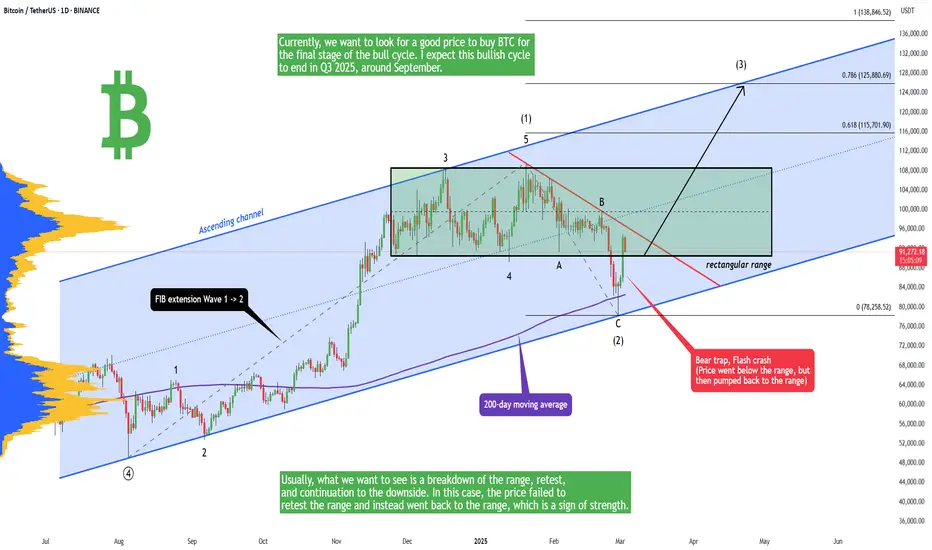
Bitcoin - Dump and Pump | Crypto resurrected - next 125,000 USDLast week Bitcoin and the whole crypto market dumped like crazy, but on Sunday at the start of March, the crypto market was resurrected from the abyss! After Trump's post, the crypto market pumped in a very short period of time. But let's take a look at the technicals.
The price dropped below the rectangular range but then pumped back into the range. What does it tell us? Usually, what we want to see is a breakdown of the range, retest, and continuation to the downside. In this case, the price failed to retest the range and instead went back to the range, which is a sign of strength. Currently, we want to look for a good price to buy BTC for the final stage of the bull cycle. I expect this bullish cycle to end in Q3 2025, around September.
The price of Bitcoin is inside this huge ascending parallel channel on the daily chart, and as long as this channel holds, we have to be bullish. Let's take a look also at the weekly timeframe. What we can see here is a bullish hammer with an extremely long wick (reversal candle). The price also got rejected from the 20-weekly moving average.
Write a comment with your altcoin + hit the like button, and I will make an analysis for you in response. Trading is not hard if you have a good coach! This is not a trade setup, as there is no stop-loss or profit target. I share my trades privately. Thank you, and I wish you successful trades!
CAKEUSDT → False breakout of resistance. Return to the trendBINANCE:CAKEUSDT is forming a false breakdown of key resistance as part of a bullish rally. Further altcoin decline may be influenced by bitcoin's decline, the flagship looks rather weak
Technically, the move in Cake looks like a counter-trend maneuver to gather liquidity before a further, possible fall. The altcoin market is weak and most coins continue to look for a bottom, while bitcoin is consolidating but with a hint of a decline to 91-90K.
CAKEUSDT is focusing on 2.6144 - 2.7288. If the bears keep the price below these zones, the coin could head down in the short to medium term
Resistance levels: 2.6144, 2.7288, 2.2964
Support levels: 2.420, 2.0634
Statistically, a false breakdown provokes the strongest movements, often even trend changes. In this case, it is a counter-trend movement and if the price reverses locally, the coin will be under the pressure of the trend again. A price fixing below 2.6144 may strengthen the fall to 2.42, 2.06, 1.04.
Regards R. Linda!

GBPUSD → Correction before bullish trend continuationFX:GBPUSD has been rising for the last month and a half as the market sentiment and the behavior of the dollar, which is gradually updating lows.
The tariff war by trump is just in full swing. The dollar continues its correction on the back of US politics as well as inflation data.
GBPUSD at this time is trading in the bullish zone, above the support at 1.262 - 1.2576. Thus, within the framework of the correction, which has been observed since the opening of the European session, the price may test the liquidity area before further growth.
Resistance levels: 1.2718, 1.2678
Support levels: 1.262, 1.2576
The local trend is bullish and the price is forming a local correction. In this case, it is worth looking for strong support zones with the purpose of rebound and continuation of growth. Targets in this case are intermediate highs: 1.2718, 1.2811
Regards R. Linda!


Bitcoin may rebound up from buyer zone to 94100 resistance levelHello traders, I want share with you my opinion about Bitcoin. A few days ago, the price was moving inside a downward channel, where it reached the support line and immediately bounced back up to the channel’s resistance. After that, BTC continued its decline, testing the resistance level, which aligned with the seller zone. The price briefly dipped below this level but quickly reversed and rebounded. Eventually, Bitcoin exited the channel and moved into a range, reaching its upper boundary before turning downward again. In a short period, the price dropped to the seller zone, where it consolidated for some time. BTC then attempted to push higher but failed and resumed its decline. Breaking below the 94100 resistance level, the price moved further down, fluctuating between support and resistance lines. Bitcoin eventually fell to the support line, breaking through the 83400 support level, which aligned with the buyer zone. However, this breakdown turned out to be a false move, as BTC immediately rebounded and surged back above that level. Currently, BTC is continuing its upward movement. I anticipate that the price may first test the buyer zone before resuming its growth. Additionally, if it manages to break through the resistance line, it could keep climbing higher. With this in mind, my TP is set at the 94100 resistance level. Please share this idea with your friends and click Boost 🚀

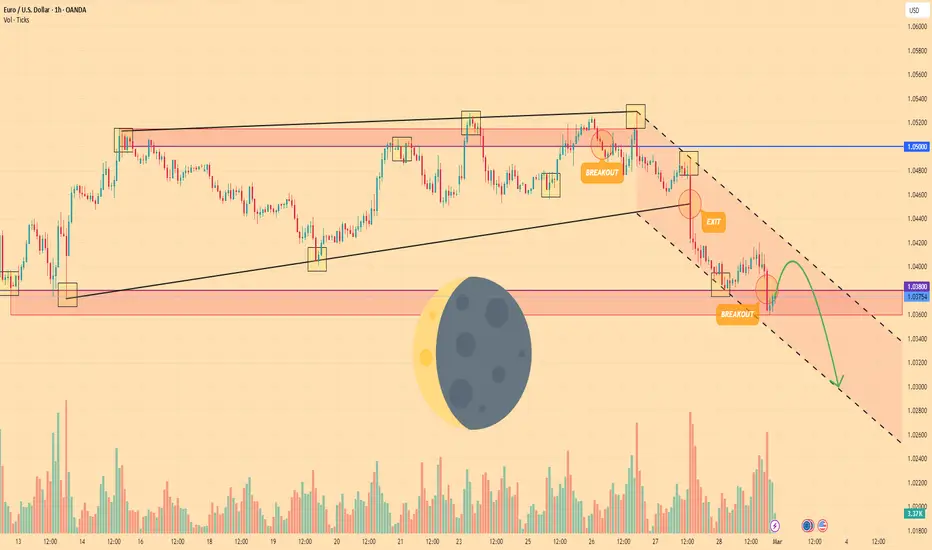
EURO - Price can continue to decline inside falling channelHi guys, this is my overview for EURUSD, feel free to check it and write your feedback in comments👊
Recently price declined to $1.0380 level and then started to grow inside a wedge, where it at once reached $1.0500 level.
Then price turned around and made correction movement to support line of the wedge, after which quickly bounced up.
Price grew to $1.0500 level and some time traded near this level and later finally broke it, after which turned around.
Euro broke $1.0500 level again, exited from wedge and continued to decline inside falling channel.
Inside channel, price declined to $1.0380 level and a few moments ago broke it and now continued to fall.
Possibly, Euro can rise a little higher than $1.0380 level and then continue to fall to $1.0300 inside channel.
If this post is useful to you, you can support me with like/boost and advice in comments❤️