XAUUSD → Will Retrace till 2802-2794 but after hitting 2835Hello Traders!
As gold has made its ATH 2830 which was also a trendline where gold respect that trend line and down now every thinking for retracement but gold will do a breakout till 2835 as gold done on previous trendline
gold can hit 2835 easily before drop to retracement level of 2794, so for now i am bullish till 2835 in that zone i will see a good entry for sell.
Support: 2802
Resistance:2830
Fib Golden Zone: 2794-2796
Liquidity Zone: 2794
Gold will continue its trend after retracement but we need a good entry for sell almost from 2835
Parallel Channel

Gold Retracement has begun and will end on the order block.Hello, Traders!
As gold dropped from 2830 and is now trading between 2812-2813, this decline is true and valid till 2772-2773 since I identified significant liquidity, an order block, FVG, and parallel channel trendline support.
So gold should make this extremely serious and genuine move in order to continue the bullish trend.
Support number: 2801-2796.
Resistance: 2830.600.
Order Block: 2771–2778
Fair Value Gap: 2778–2779
Golden Zone of Fib: 2794-2801
We will trade in tiny time frames with other confirmations like morning star or any bullish engulfing candle, with suitable stop loss below order block and liquidity zones.
If you liked my analysis, please support my idea and follow me.

XAUUSD GOLD ⇒ Sellers interested in retesting gold.Hello, Traders!
As we all know, this week gold made ATH with a red candle and also did a retest to 2799, but this retest is not enough for the continuation of the bullish trend. Here I have presented my analysis regarding gold.
Currently, gold is trading at 2799 at the gold support level, as the new week begins in three hours, so gold can do a gap down opening with a strong volume candle, and we can see 2774 in gold because gold is in a strong bullish trend, so it should touch 2774, which is the golden zone of fib to continue its bullish trend.
Support Level: 2758 – 2767
Resistance Level: 2815 – 2819
Fib Golden Zone: 2773 – 2763.
Liquidity Zone: 2730 (strong low)
Because gold is trading in an ascending channel, our aim would be the ascending trendline, but our entry point should be the golden zone of fib.
Do not enter at ATH because it is the initial technical analysis, thus our buy entry is quite dangerous, so we will wait for a retest.
For now, we can take sell trades for scalping, but always utilize SL because SL is better than liquidation, thus I'm in for sell until 2763.
If you enjoy my analysis Please support my concept and follow me for more analysis.
Have a wonderful day, thank you!

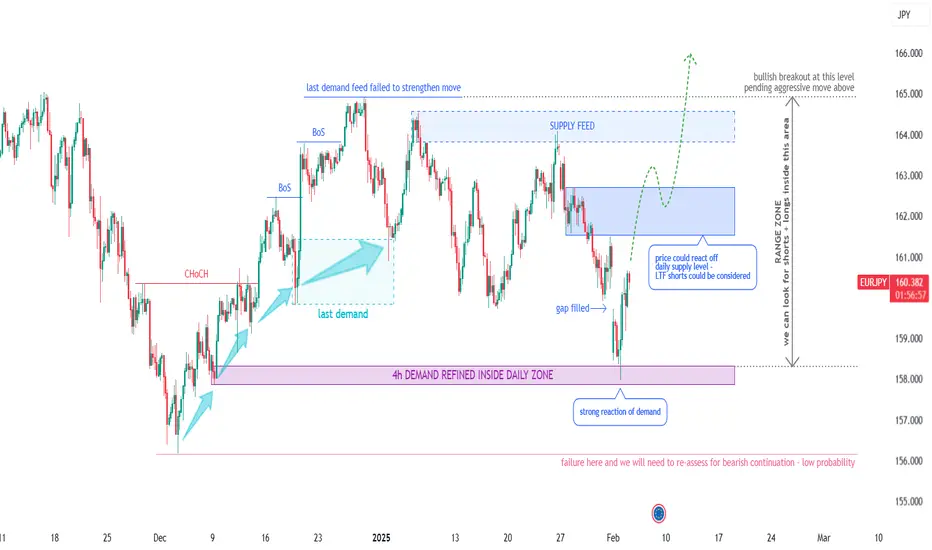
EURJPY Potential Longs - Short & Long Term (Technical Analysis)Technical Outlook:
Looking at previous price movement, we see it's been trending up since August 2024, with the last reaccumulation phase ending in early 2024. We recently saw a demand chain, but the last push couldn't quite hit new highs. Supply then took over, driving the price back down to a daily demand level. At this point, we've seen some strong bullish reactions on the lower timeframes, which is interesting and here's why -
Potential Scenarios & Probabilities:
Scenario 1 (High Probability) – Demand should regain control, leading to a bullish breakout.
Scenario 2 (Medium Probability) - Price could range within the ascending channel for a while.
Scenario 3 (Low Probability) – The bulls might disengage, resulting in a bearish break and continuation thereafter.
Trading Considerations:
Price is currently in a discounted zone within the ascending channel (158.000 – 168.000) . We can look for trading opportunities within this range, focusing on strong supply and demand areas, anticipating the eventual bullish breakout. A long position closer to the bottom of the range could turn into a swing trade. If you're trading inside the range on lower time frames, it's smart to keep an eye on volume, overbought/oversold levels, and relative currency strength.
Final Notes:
With the price moving sideways for a good six months, range trading is definitely a possibility. But the real goal is to catch that bullish breakout when it happens, and it looks like it's getting close. As always, manage your risk carefully, and don't hesitate to take the trade when the setup is right – assuming you've got a solid plan and a clear target in mind.
OANDA:EURJPY
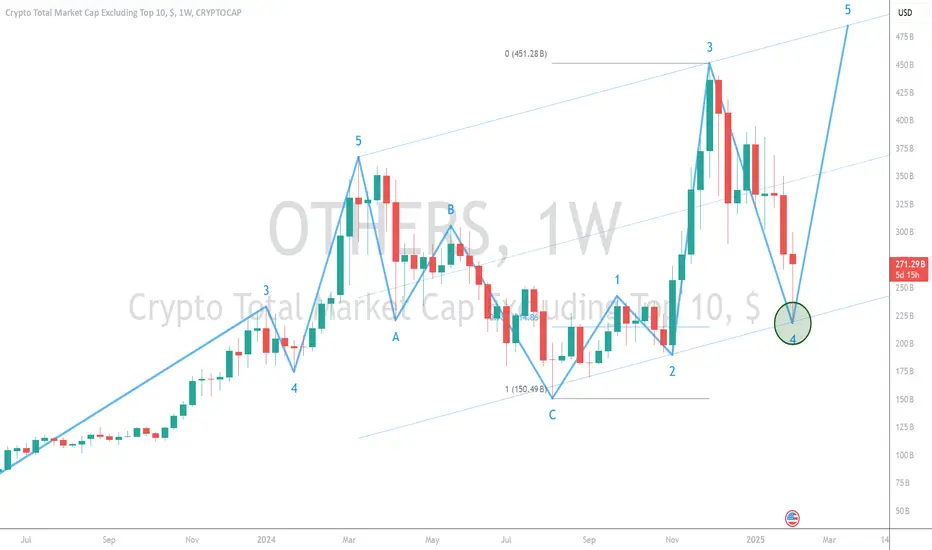
The Altcoin Bloodbath Is Over — New Highs Ahead!Altcoins have likely found a bottom, with CRYPTOCAP:OTHERS rebounding off its channel support, aligning with the 78.6% Fibonacci retracement level. This confluence suggests a strong technical base, positioning the market for a move toward new highs at the channel top. If momentum follows through, altcoins could see a sustained recovery as liquidity returns to risk assets. 🚀
GOLD → Price is susceptible to manipulation. Correction?FX:XAUUSD amid high risks of tariff wars and high inflation reaches a new ATH and trend resistance, but due to manipulation by politicians there is a possibility of a small correction.
Gold price is consolidating above $2,800 after an all-time high of $2,831, awaiting US employment data and Fed speeches. Volatility increased amid manipulations about Trump's tariff policy: first they set tariffs, then a few hours later they cancel them. In a word, “politicians”. Gold is going into correction after a false breakout of resistance of the ascending channel and on the news about temporary suspension of tariff increase by the USA. Overall gold is holding its ground as the Fed remains cautious on rate cuts.
Resistance levels: 2817, 2830
Support levels: 2811, 2801, 2790
If the price breaks 2811 and consolidates below this area, we should expect a correction to 2800 - 2790 in the short term, there is no hint of a trend change, growth may continue from the key support areas.
Regards R. Linda!

OMNOM. No fear, accumulate.$OMNOM price has been moving in a local descending channel for 84 days and recent dump brought almost to support, immediately bouncing back 67% and currently moving in the middle of the channel. Possible local rebound target is 800% higher than the current price.

ACTUSDT → Attempting to change the trend BINANCE:ACTUSDT is trying to move into the realization phase after breaking through the resistance of the bearish wedge, a pattern capable of changing trends
After a prolonged downtrend, the coin has found a bottom in the 0.1500 area and yesterday's bitcoin recovery was a bullish driver for ACT. The market is pretty much confirmed manipulation by the US government and will have to come to terms with that.
Technically, the focus is on 0.21400 support. The key pattern to wait for is a false break of the support followed by a consolidation above the level and the start of an upside move. This would be a characteristic bullish maneuver that could lead to local strengthening.
Resistance levels: 0.26800, 0.35120
Support levels: 0.21420, 0.1500
For a trend change, the coin needs not only to consolidate above the support, but also to overcome the resistance at 0.26800. The altcoin market is weak, so there should be strong confirmations to open positions in one direction or another.
Regards R. Linda!

golden channel gold price are making higher highs with higher low and going rocket on trump trade war
lower trend line big support level
as long as price trading above lower white line it is bullish
if lower line breakdown then $2720 big support level
hawkish fed risk because tariff war has increased inflation expectation until it changes again on nfp on friday

Gold Retracement started and will stop on order blockHello Traders!
As gold dropped from 2830 and now trading between 2812-2813 this drop is genuine and valid till 2772-2773 because there i found strong liquidity, order block, FVG and also parallel channel's trendline support.
so gold should do this move which is very real and genuine for a bullish trend continuity.
Support: 2801-2796
Resistance: 2830.600
Order Block: 2771-2778
Fair Value Gap:2778-2779
Golden Zone of Fib: 2794-2801
we will trade in small time frame with some other confirmations like morning star or any bullish engulfing candle with proper stop loss below order block and liquidity zones
if you like my analysis kindly boost my idea and follow me

USDCHF → The bullish trend may get its continuationFX:USDCHF is entering the realization phase after a prolonged correction. A favorable background is created by the uptrend and rising dollar...
The technical outlook on the daily timeframe is very good. The price after breaking the trend resistance tested the previously broken line. The currency pair after the false breakout managed to consolidate above the key point, marking an interim bottom and further prospects.
Technically, the focus is on the resistance at 0.911, if the bulls can overcome this area and consolidate above this level, the currency pair will be able to realize a rise to 0.918 - 0.93.
Resistance levels: 0.911
Support levels: 0.90555
Before breaking the resistance, the currency pair could test 0.90555 due to the liquidity generated below this area. But, the trigger that can provoke further growth is 0.911
Regards R. Linda!

GBPUSD → What are the chances of a fall after a FB?FX:GBPUSD is testing the resistance of the downtrend, but the price does not have the strength to go beyond this range. Ahead of the news that can strengthen the downward movement....
On D1, the price is also forming a false breakdown, but relatively important level, thus confirming that the price is still in the selling zone. Ahead is the Fed rate meeting, where the interest rate is likely to remain at the same level. But the most important thing will be Powell's speech. If the official's tone is hawkish, which is the most likely scenario at the moment, the dollar will get support, which may negatively affect the GBP.
Technically, the strongest moves occur after false breakouts.
Resistance levels: 1.24887
Support levels: 1.2414, 2.2377
A retest of the trend resistance ends with a false breakout and consolidation of prices below the line... A break of the support at 1.2414 will trigger further selling. If there is no unexpected news, the currency pair may fall to 1.224
Regards R. Linda!

GOLD → Sellers taking interest for retesting in goldHello Traders!
As we all know that last week gold has made ATH with red candle and also did a retest to 2799 but this retest is not enough for continuation of bullish trend here i have shared my analysis about gold
Currently gold is trading on 2799 at gold support level as next week is going to start in 3 hours so gold can do a gap down opening with strong volume candle and we can see 2774 in gold because gold is in strong bullish trend so it should touch 2774 which is golden zone of fib to continue its bullish trend.
Support Level: 2758-2767
Resistance Level: 2815-2819
Fib Golden Zone: 2773-2763
Liquidity Zone: 2730 (also strong low)
As gold is trading in a ascending channel so our target would be the trendline of ascending trendline but our entry should be at golden zone of fib.
Do not take entry at ATH that is the first of technical analysis so here our entry for buy would be very risky so we will wait for retest.
For Now we can take sell trade for scalping but always use SL because SL is better than liquidation so i am in for sell till 2763
If you like my analysis kindly boost my idea and follow me for more analysis
Analysis By: PIPsOptimizer
Have a nice day thank you!

XAUUSD TODAY'S MAPPING IN 4H TF Hello Guy's Welcome To Another Day Of TRADING
Here we are mapping chart of XAUUSD ( GOLD ) in 4-Hour TF
This chart shows the price of gold (XAUUSD) over time. The price is moving in an upward trend (light blue channel).
Current Situation: The price recently dropped but is near a strong support area (gray zone).
Prediction: If the price stays above this support, it might bounce back up and continue rising.
Risk: If it falls below the support zone, the trend could change.
Basically, the idea is that gold might go up again after a small dip, but if it breaks below support, the trend could reverse.

Lowe’s Makes a Lower HighLowe’s has been falling since mid-October, and some traders may see further downside risk.
The first pattern on today’s chart is the series of lower highs and lower lows over the last three months. If the resulting descending channel remains in effect, it could point to potential move below the January 8 low of $242.96.
Next, the 50-day simple moving average (SMA) recently turned negative and crossed below the 100-day SMA. Prices are now stalling at both. That may suggest its longer-term is weakening.
LOW also ended last week below its 8-day exponential moving average. That may suggest its short-term is weakening.
Next, stochastics are dipping from an overbought condition.
Finally, President Trump’s tariffs on Mexico and Canada may impact the home-improvement chain.
TradeStation has, for decades, advanced the trading industry, providing access to stocks, options and futures. If you're born to trade, we could be for you. See our Overview for more.
Past performance, whether actual or indicated by historical tests of strategies, is no guarantee of future performance or success. There is a possibility that you may sustain a loss equal to or greater than your entire investment regardless of which asset class you trade (equities, options or futures); therefore, you should not invest or risk money that you cannot afford to lose. Online trading is not suitable for all investors. View the document titled Characteristics and Risks of Standardized Options at www.TradeStation.com . Before trading any asset class, customers must read the relevant risk disclosure statements on www.TradeStation.com . System access and trade placement and execution may be delayed or fail due to market volatility and volume, quote delays, system and software errors, Internet traffic, outages and other factors.
Securities and futures trading is offered to self-directed customers by TradeStation Securities, Inc., a broker-dealer registered with the Securities and Exchange Commission and a futures commission merchant licensed with the Commodity Futures Trading Commission). TradeStation Securities is a member of the Financial Industry Regulatory Authority, the National Futures Association, and a number of exchanges.
TradeStation Securities, Inc. and TradeStation Technologies, Inc. are each wholly owned subsidiaries of TradeStation Group, Inc., both operating, and providing products and services, under the TradeStation brand and trademark. When applying for, or purchasing, accounts, subscriptions, products and services, it is important that you know which company you will be dealing with. Visit www.TradeStation.com for further important information explaining what this means.

TRUMP Token Analysis: Is This Best Buy Zone Before a +40% PUMP!?Today, I decided to re-analyze the OFFICIAL TRUMP token( BINANCE:TRUMPUSDT ) for you; if you want to have the TRUMP token in your portfolio, in what range can you buy this token, and at what prices can you sell it with a profit or even prevent further loss?
TRUMP Token started correcting after all the hype, after the news of the launch of the Official Melania Meme token ( BINANCE:MELANIAUSDT.P ) and has dropped more than -60% from its All-Time High(ATH) .
TRUMP Token is moving near the upper line of the descending channel and the Resistance zone($32-$30) .
According to the theory of Elliott waves , the TRUMP token seems to be completing microwave 5 of microwave c of the main wave Y . The main wave Y could end in a Potential Reversal Zone(PRZ) and be another opportunity to buy TRUMP Token , of course, with capital management in mind .
I expect the TRUMP token to start rising again after the -15% decline from the close of the lower high line of the descending channel and the Support lines and at least a +20% increase .
Note: Of course, the FOMC Statement, Federal Funds Rate decision, and Press Conference can affect the general trend of the crypto market and the TRUMP token.
Note: If the TRUMP token goes below $22.00, there is a possibility that the fall will continue.
Note: However, concerns have been raised about supply concentration, with 85% of the tokens controlled by Trump's team, who have reportedly liquidated approximately $500 million worth of tokens. This situation poses potential risks for retail investors.
What do you think about the TRUMP token? Can the TRUMP Token rise again, or is it forming a Dead Cat Bounce Pattern ?
Please respect each other's ideas and express them politely if you agree or disagree.
OFFICIAL TRUMP Analyze (TRUMPUSDT), 1-hour time frame.
Be sure to follow the updated ideas .
Do not forget to put Stop loss for your positions (For every position you want to open).
Please follow your strategy and updates; this is just my Idea, and I will gladly see your ideas in this post.
Please do not forget the ✅' like '✅ button 🙏😊 & Share it with your friends; thanks, and Trade safe.

Bitcoin can exit from triangle and continue to fall nextHello traders, I want share with you my opinion about Bitcoin. By observing the chart, we can see that the price started to grow inside the upward channel, where it at once rebounded from the resistance line of the channel and fell to the support line. Then BTC broke the support level and rose in a short time to the resistance line of the channel and then it started to decline. Bitcoin fell to the support level, which coincided with the buyer zone, thereby exiting from the channel and after it some time traded between 94250 level, it fell to 90850 points. Next, the price impulsed and continued to grow inside the upward triangle, breaking the support level again. Later it reached the even resistance level, which coincided with the seller zone. Soon, BTC broke the 104700 level, rose to the resistance line, and then fell back and continued to trades between the 104700 level. Later BTC broke this level and fell below, after which turned around and quickly rose to the resistance line of the triangle and then dropped to the support line, where at the moment continues to trades close. So, in my mind, I think that Bitcoin can move up and then exit from the triangle and continue to decline to the 94250 support level. For this case, I set my TP at this level. Please share this idea with your friends and click Boost 🚀

EURO - Price can reach resistance level and then bounce downHi guys, this is my overview for EURUSD, feel free to check it and write your feedback in comments👊
A few moments ago price broke $1.0410 level and started to trades inside flat, where it at once fell to $1.0250 level.
Then Euro bounced up from this level and rose to resistance area, after which turned around and started to decline.
In a short time, price fell to $1.0180 points, thereby exiting from flat and then started to grow in rising channel.
Inside channel, price broke $1.0250 level, rose a little, and then made a small correction to support line.
Next, Euro rose to $1.0530 points, thereby breaking resistance level and making a gap, but soon fell to $1.0350 points.
Price exited from channel, so, now I think it will make move to resistance level and then fall to $1.0250 level.
If this post is useful to you, you can support me with like/boost and advice in comments❤️

USDJPY → Trump crashes the market, dollar ralliesFX:USDJPY breaks downtrend structure. Monday started unexpectedly for traders with Trump's actions, which gutted localized situations not only in the forex...
The imposition of tariffs, another batch of statements about the Eurozone, BRICS, and also this: “Trump said that the Fed made the right decision last week to suspend rate cuts” produced a corresponding reaction in the market. On the back of inflation expectations, the dollar is accelerating its growth, thus provoking a rally in USDJPY.
Technically, the focus is on the resistance at 155.95 and the support of the previously broken channel, which can be tested before further growth.
Resistance levels: 155.95, 156.6
Support levels: 155.0, 153.6
The price is trying to consolidate in the buying zone, but the resistance at 155.95 is holding the price back from active strengthening. Breakdown and consolidation of the price above this area may provoke growth to the trend resistance.
Regards R. Linda!

GOLD (XAUUSD): Breakout & Bullish OutlookGold is trading in a long-term bullish trend within a parallel rising channel.
The market successfully broke and closed above an important daily horizontal resistance level that was previously set at an all-time high on Friday.
After the market opened, there was a retest of this broken structure, which was met with a bullish response.
As a result, it is likely that the bullish trend will continue. The next target is set at 2817.

PEPEUSDT🚀 PEPE/USDT Technical Analysis
PEPE has entered a critical support zone after a sharp correction. Historically, this area has acted as a strong launching pad for significant upward moves (see previous rallies of 339% and 224%).
Currently, price action is respecting the lower boundary of the ascending channel, showing potential for a bullish reversal. Should it hold, the next targets could align with key resistances around 0.00001400 and potentially as high as 0.00002000 in the mid-term.
🟠 Key Levels to Watch:
Support: 0.00001080
Resistance: 0.00001350, 0.00001750
📈 Momentum Outlook: A breakout above the orange resistance zone would indicate renewed bullish momentum. However, a failure to hold the support zone may suggest further downside risk.
Stay tuned for updates! 🔔

Hedera Daily: Beware of the Bearish Dragon Pattern
In my previous article, I focused on Elliott Wave counts for HBAR.
()
This time, I’ll approach the analysis from a different perspective:
1. **Dragon Pattern**
2. **Weekly Candlesticks**
3. **Parallel Channel**
4. **Oscillator**
5. **Fundamentals**
6. **Key Levels**
7. **Short-term Forecast and My Position**
---
### 1. Dragon Pattern
The Hedera daily chart suggests a bearish “Dragon Pattern” forming. For a reference on a previous Dragon Pattern in Bitcoin, see:
()
---
### 2. Weekly Candlesticks and the Dow Theory on the daily
Overlaying the weekly candlesticks schematically also indicates a clear bearish bias. Unless the weekly candle closes bullish—or at least recovers to 31 cents—the continuation of the downtrend looks very likely. The daily lower-low in the Dow Theory we already have might emphasize the bearish sentiment more.
---
### 3. Parallel Channel
The price has dropped below the yellow line on the diagonal parallel channel. The following likely targets appear to be the light blue or gray lines. Considering this, it seems natural to expect a move toward the green box, although the path may involve some fluctuations.
---
### 4. Oscillator
At the same time, the oscillator values remain at their respective low levels, suggesting a scenario where any downward move might be more gradual than abrupt. However, such a steep decline itself isn't excluded at the extreme of oscillator values.
---
### 5. Fundamentals
From a fundamental standpoint, overall market sentiment is pessimistic, influenced by the DeepSeek shock and U.S. tariff concerns, making a short-term return to optimism seem unlikely. However, from a TA perspective, this aligns with the scenario many have been anticipating. If a decline materializes now, it may reflect the market providing its catalyst.
---
### 6. Key Levels
On the downside, the area near the 23-cent low is almost particular to command attention. I watch around 17.5 cents (the top of the green box). If the price does reach this level, panic selling could spark wicks down into the 15-cent region. Although the bottom of the box is around 12.6 cents—and the likelihood of dropping that far seems slim—long-term HBAR holders like myself would welcome the opportunity.
---
### 7. Short-term Forecast and My Position
As I posted on X (formerly Twitter), I’m currently short 34.5 cents and plan to take profits around 17.9 cents. Since a minor bounce could happen first, I don’t intend to add to my short position at this level. My spot buy orders are scattered from around 24 to 15 cents, illustrating my long-term bullish stance on Hedera.
For a bullish take, feel free to check out my earlier analysis (admittedly a bit optimistic, but I’m confident in the overall movement):
()

can EURUSD drop furtherwith the last bearish divergence, the price dropped so sharply that it broke the bullish parallel channel and the current scenario indicates that there are higher chances that the price will go down and to benefit from that situation instant selling by placing the stop loss right above the last LH would be a good idea to get 1:1 RR
