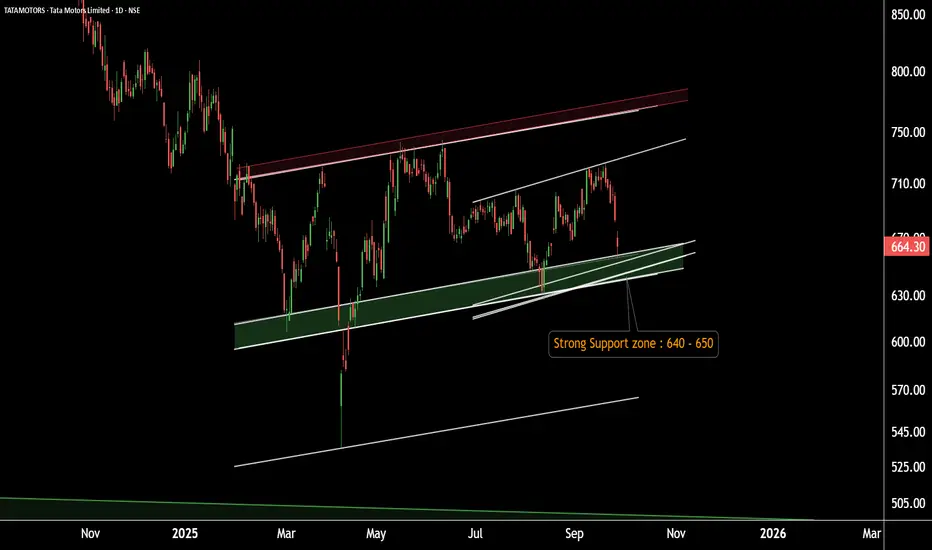
Tata Motors – Back at Key Support! Setting Up for the Next Bull.Tata Motors Daily Chart Update
Tata Motors is moving within a well-defined parallel channel, with a strong support zone around 630–650.
If this zone holds, the stock may see upward momentum.
Potential upside target: 730–740.
Thank you!
Patterntrading
SBIN Chart Breakout – Momentum AheadSBIN Double Breakout Alert
On the 4H timeframe, SBIN has given a parallel channel breakout.
Additionally, it has also confirmed a broadening pattern breakout.
Sustaining above the ₹850–₹860 level may open the path for higher prices ahead.
Thank you!

Bitcoin - Will the parallel channel hold?Introduction
The Bitcoin market is currently showing an interesting structure that offers both bullish and bearish possibilities. By analyzing the liquidity dynamics, the channel formation, and key areas of interest highlighted on the chart, we can gain a better understanding of the potential scenarios that may play out in the short to medium term. This analysis focuses on the recent liquidity sweep, the behavior within the rising channel, and the critical zones that could act as decision points for price movement.
Liquidity sweep above the highs
Recently, the market performed a liquidity sweep above the previous highs. This type of price action typically occurs when liquidity pools are triggered, trapping breakout traders and providing institutional players with favorable entries in the opposite direction. The sweep has set the stage for the next move, and it becomes crucial to see whether price sustains above this level or rejects it decisively.
Rising channel
Price is currently trading within a rising channel, which often acts as a short-term bullish structure but can also precede reversals if broken to the downside. The channel is providing clear levels of support and resistance, with the midline serving as a short-term equilibrium point. As long as price remains inside this channel, traders should expect oscillations between its boundaries, but any break below it could trigger a stronger move toward lower support zones.
Bearish scenario
In the event that price fails to hold within the channel, the bearish scenario points toward a retest of the lower fair value gap (FVG) around the 113,000 level. This would align with a deeper correction, offering the market a chance to rebalance inefficiencies left behind during the recent bullish rally. A sustained breakdown from the channel could accelerate selling pressure, with liquidity below key lows acting as a magnet for price.
Bullish scenario
On the other hand, if price manages to respect the rising channel and reclaim the liquidity sweep level, the bullish scenario would see a continuation toward the higher 4-hour fair value gap around 119,000–120,000. This area is a major point of interest, as it represents an unfilled imbalance that could attract buyers if momentum continues. Holding above the midline of the channel would strengthen the bullish outlook and could even lead to a retest of previous highs.
Final thoughts
Overall, the market is at a decisive stage where both bullish and bearish outcomes remain valid. The liquidity sweep has created a reaction point, and the rising channel offers a clear framework for monitoring price behavior. Traders should remain flexible and prepared for either outcome, watching closely for confirmations such as a clean break of the channel or a strong reclaim of resistance levels. Ultimately, the reaction around the current structure will determine whether Bitcoin continues higher toward the upper fair value gap or corrects lower into the demand zone below.
-------------------------
Thanks for your support. If you enjoyed this analysis, make sure to follow me so you don't miss the next one. And if you found it helpful, feel free to drop a like 👍 and leave a comment 💬, I’d love to hear your thoughts!

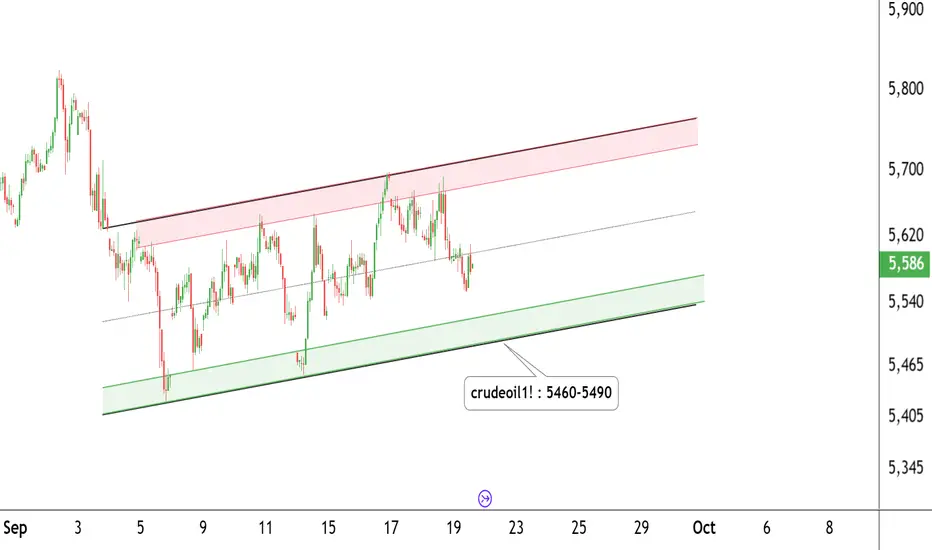
Crude Oil Trading Levels – Plan Your Move!CRUDE OIL – Daily Timeframe Update
Crude Oil is trading within a well-defined parallel channel on the daily chart.
The price is currently taking support near the 5460–5490 zone and moving within an ascending channel.
Support Zone: 5460 – 5490
Resistance Zone: 5700 – 5720
If these levels sustain, we may see higher prices ahead in Crude Oil.
Thank you!!
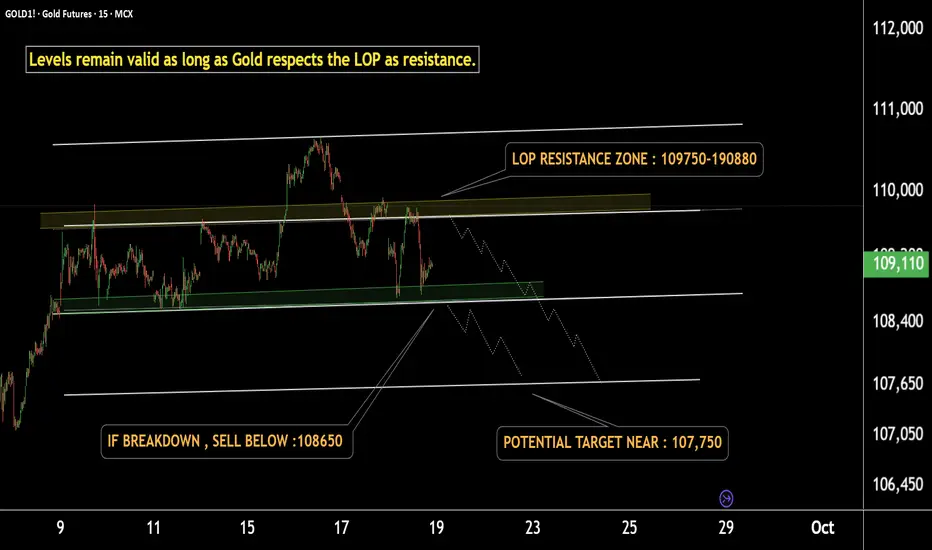
Gold setup indicates a fall ahead – Stay alert, traders!This is the 15-minute chart of GOLD1!
Gold is moving in a well-defined parallel channel and currently respecting the LOP resistance zone at 109750–109850.
The channel’s lower boundary near 108650 may act as short-term support.
If Gold breaks down below this support, the projected downside target is near 107750.
In case of range-bound movement, the ideal sell zone remains at the LOP (109750–109850).
If this resistance level sustains, Gold may fall and test the lower targets.
Additionally, a Head & Shoulders pattern has formed within the channel, with its downside target aligning with the channel projection.
Thank you.
ETH ANALYSIS🔴 #ETH Analysis : ❓❓
🔮There is a formation of "Bullish Pennant Pattern" in #ETH in 4HR time frame. We can expect around $4850 bullish move if the price break the pattern.📈
⚡️What to do ?
👀Keep an eye on #ETH price action. We can trade according to the chart and make some profits. ⚡️⚡️
#ETH #Cryptocurrency #Breakout #DYOR

HDFC Life Insurance – A Big Pattern Unfolding!This is the daily timeframe chart of HDFC Life Insurance.
The stock is currently forming a Diamond Pattern with a support zone around 760–770.
In the short term, the price action indicates a potential move toward the pattern resistance zone at 800–810.
A confirmed breakout above this level could unlock a larger upside, with a pattern target projected near 915.
Thank you

Nestle India Buy Alert – Golden Opportunity for InvestorsNestle India – Technical Update
Timeframe: 1-Hour Chart
Price Action: Nestle India is trading within a well-defined parallel channel.
Support Zone: Currently sustaining above the 1170–1180 LOP support zone.
Outlook: If the stock holds this level, we may witness upside momentum.
Potential Target: 1280–1290 near the channel resistance.
Thank you!

Big pattern alert on Varun Beverages Ltd.Eyes on the move..Varun Beverages Ltd (VBL) – Technical Update
On the daily chart, VBL is trading within a well-defined parallel channel, with a strong support zone around ₹425–437.
The stock is also forming a Symmetrical Triangle Pattern, with immediate support in the ₹450–460 zone.
If these levels hold and sustain, we may witness higher price levels in the coming sessions.
Chart structure indicates strength – keep this stock on your watchlist.
Thank you!

+151% done on Q/USDT Shared the trade for Q in the linked post earlier . It has now gained over 151% and nearing the targets
SL trailed
Easy 10 RR running right now....

HINDCOPPER Buy Zone Unlocked – Big Move AheadHindCopper Daily Chart Update
HindCopper is sustaining above the Line of Polarity (LoP).
Strong support zone is visible near 240–245 levels.
If this support holds, stock may move higher towards 275–282 levels.
Thank You !!

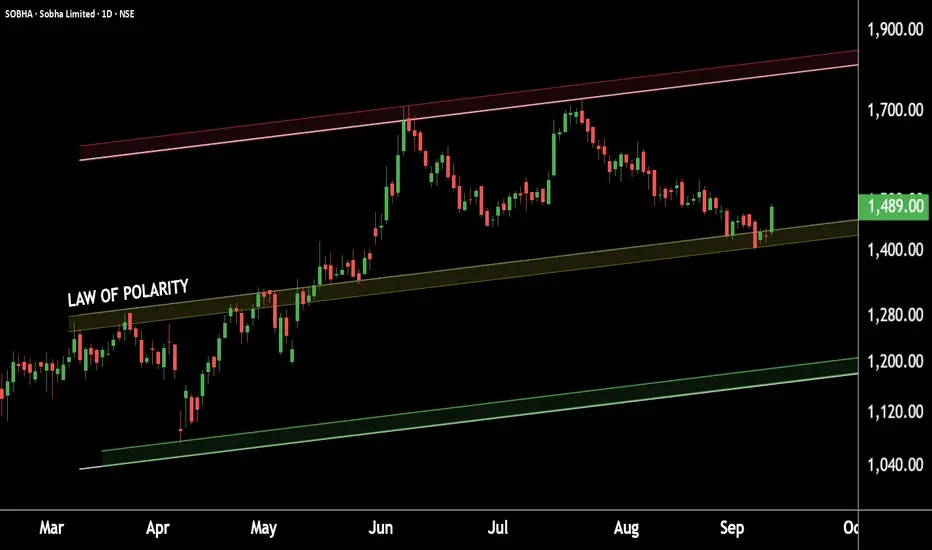
SOBHA Limited: Building Momentum from the Base!This is the daily chart of SOBHA Ltd.
The stock is currently taking strong support at Law of polarity near at the 1400–1450 zone.
If this level sustains, we may witness higher prices in SOBHA Limited.
Thank You !!
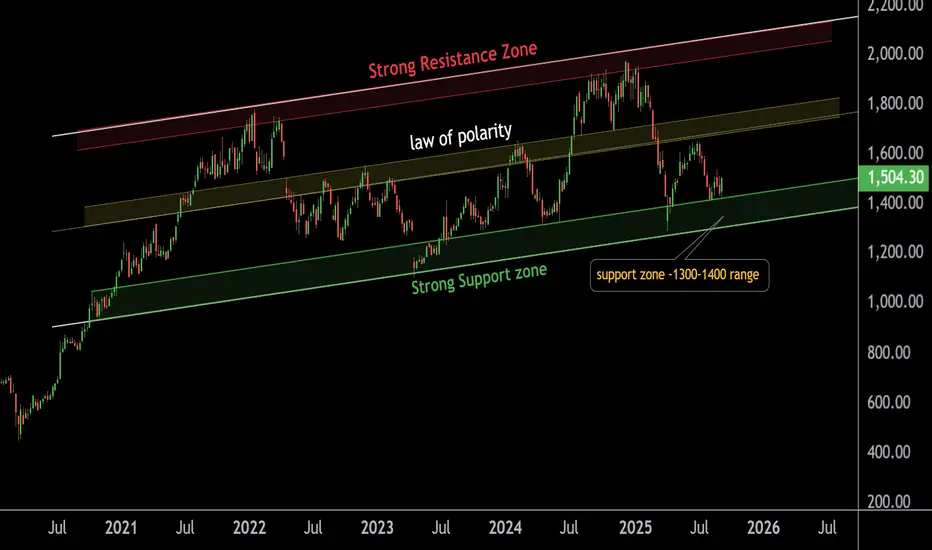
Infosys Holding Strong at Powerful Support – Big Move AheadThis is the weekly chart of Infosys (INFY).
INFY is currently trading within an ascending parallel channel, with a strong support zone in the ₹1300–₹1400 range.
The stock has shown a bounce from this level, offering traders and investors a favorable opportunity to accumulate.
If this support sustains, the next potential upside targets are around ₹1750–₹1800, with the upper boundary of the channel positioned near ₹2100–₹2200.
Thank you.
ICICIBANK: Support Zone & Hidden Setup UnfoldingICICI Bank – Technical Outlook
On the daily and 1-hour charts, ICICI Bank is showing strength near a key support zone of 1370–1390.
On the 1-hour timeframe, the stock is forming a diamond pattern around the 1380–1400 range.
A sustained move above this support zone may trigger upside momentum and lead to higher price levels in the coming sessions.
Conclusion: ICICI Bank is currently at a crucial support area with a developing bullish structure. Traders and investors should monitor these levels closely for potential opportunities.

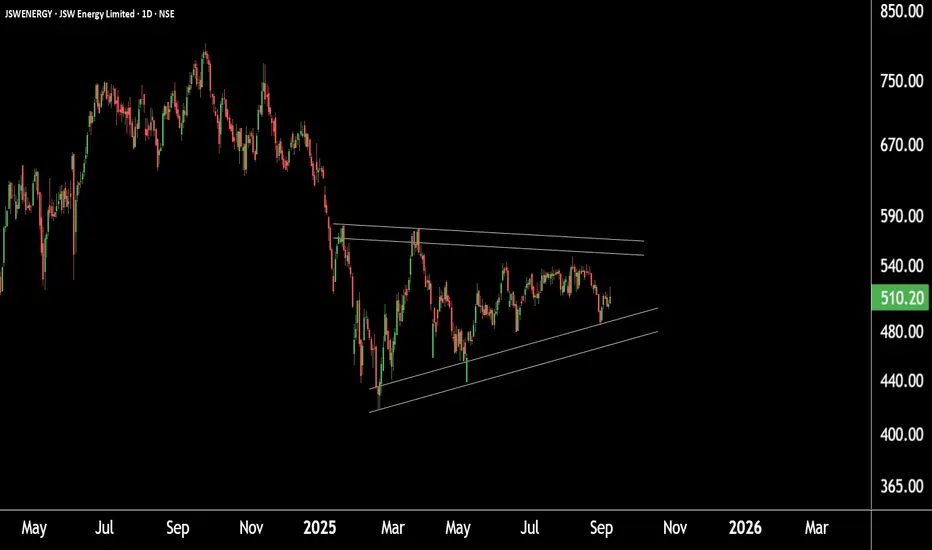
Chart Alert: Major Pattern Formation in JSW EnergyThis is the daily timeframe chart of JSW Energy.
The stock is currently forming a symmetrical triangle pattern with support around ₹465–₹475 and resistance near ₹564–₹570.
If JSW Energy sustains above this resistance zone, it could trigger a breakout, potentially leading to higher price levels in the coming sessions.
Thank you.
NMDCNSE:NMDC
Note :
1. One should go long with a Stop Loss, below the Trendline or the Previous Swing Low.
2. Risk :Reward ratio should be minimum 1:2.
3. Plan your trade as per the Money Management and Risk Appetite.
Disclaimer :
>You are responsible for your profits and loss.
>The idea shared here is purely for Educational purpose.
>Follow back, for more ideas and their notifications on your email.
>Support and Like incase the idea works for you.

KROSSNSE:KROSS
Note :
1. One should go long with a Stop Loss, below the Trendline or the Previous Swing Low.
2. Risk :Reward ratio should be minimum 1:2.
3. Plan your trade as per the Money Management and Risk Appetite.
Disclaimer :
>You are responsible for your profits and loss.
>The idea shared here is purely for Educational purpose.
>Follow back, for more ideas and their notifications on your email.
>Support and Like incase the idea works for you.

Momentum building… Canara Bank in the spotlightCanara Bank (CANBK) Technical View
Canara Bank is currently trading within a well-defined parallel channel and has recently bounced strongly from its demand zone near 100–105.
At the same time, the stock is also moving inside a falling channel pattern, which provides important reference levels:
Support is placed around 105–107
Resistance is seen near 115 and 122
Importantly, the stock is sustaining above its daily, weekly, and monthly pivot levels, signaling strong upside potential. In addition, the RSI is holding above 50, which indicates momentum is building and a strong move could emerge at any time.
If the stock manages to hold the support levels, there is a strong possibility of witnessing higher prices in Canara Bank in the coming sessions.
Thank you.

ETHUSD holds support & breaks out📊 ETHUSD – Daily Timeframe Update
ETHUSD had formed a descending broadening pattern, which has already broken out.
Price is now retesting the support zone at 3600–3700.
From its last leg, ETHUSD is moving inside an ascending parallel channel.
Within this channel, it shows range-bound action near the 3650–3700 support zone.
If ETHUSD dips again and sustains above 3650–3700, it may provide a strong long opportunity.
Thank You !!

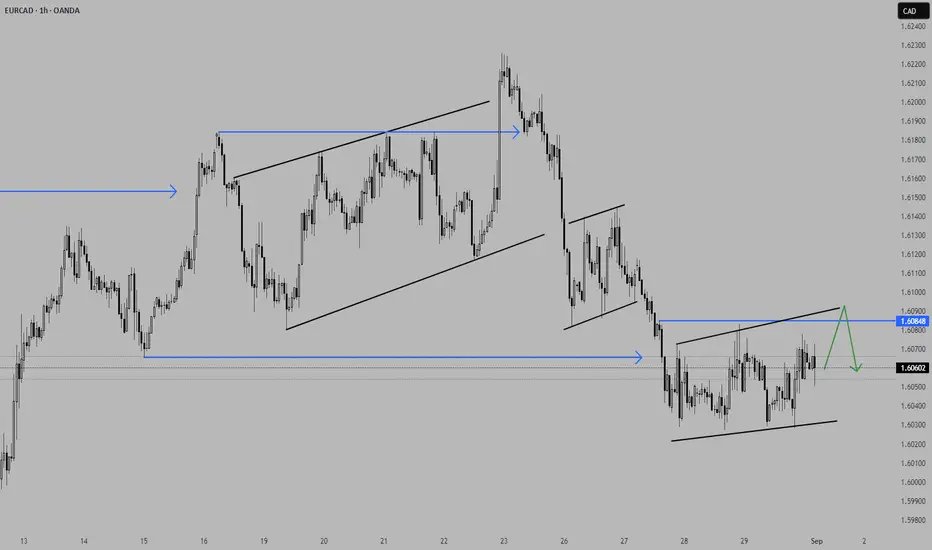
Price is in a nice sequence for a continuation shortPrice tapped the previous HTF high in the form of a 3-touch structure before starting a bearish move with almost perfect sequence.
After the first impulsive move, the continuation structures became larger further into the run.
We are now trading through an AoI to the left, and price is forming a bigger continuation bear flag structure. Considering we are further in the run, I am looking for a clear confirmation to enter a short trade, preferably with 2x bearish H1 high-test candles on top of the structure or a H4 reversal candlestick pattern.
*
**
*** **** *****
👉 The pairs I publish here are usually discussed in detail in my Weekly Forex Forecast (WFF) and are now showing further developments or price action worth mentioning.
Remember, technical analysis is subjective; develop your own approach. I use this format primarily to hold myself accountable and to share my personal market views.
⚠ Ensure you have your own risk management in place and always stick to your trading plan.
*** **** *****
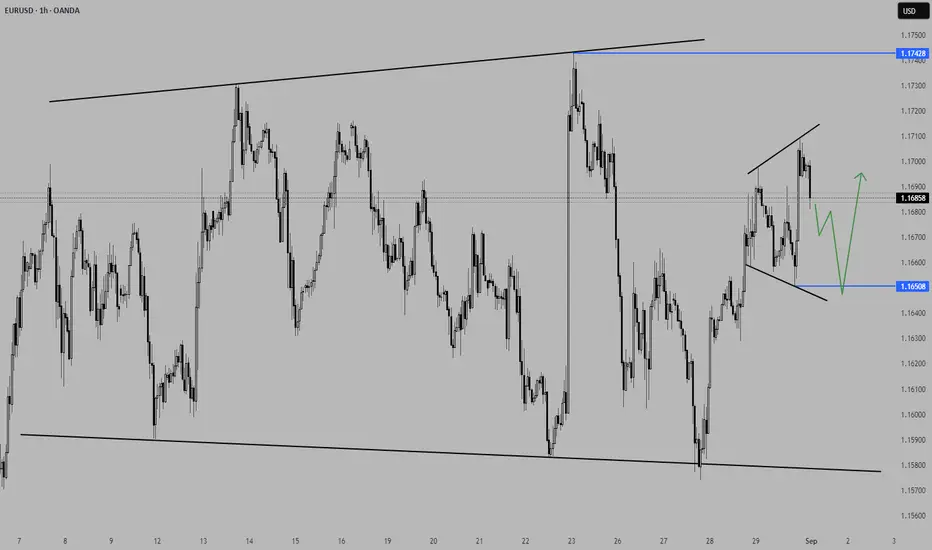
Continuation within a HTF consolidation, wait for confirmation Price is in a larger consolidation phase for the better part of August. After tapping the previous low of the structure at around 1.158, price formed an impulsive leg and is now forming a bullish continuation. Considering Labor Day Monday in the US, it could take some time for price to finish the structure before we see the next impulsive move to the upside.
*
**
*** **** *****
👉 The pairs I publish here are usually discussed in detail in my Weekly Forex Forecast (WFF) and are now showing further developments or price action worth mentioning.
Remember, technical analysis is subjective; develop your own approach. I use this format primarily to hold myself accountable and to share my personal market views.
⚠ Ensure you have your own risk management in place and always stick to your trading plan.
*** **** *****
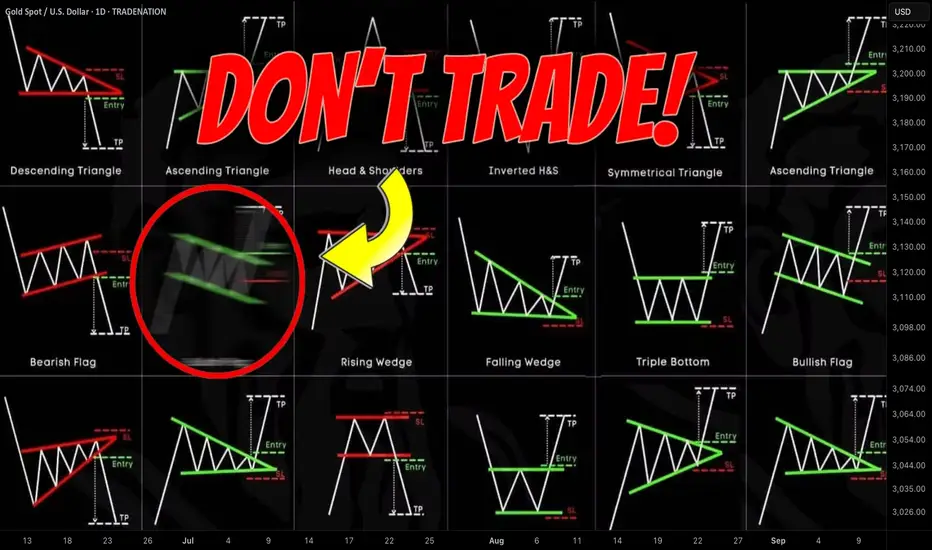
Best Price Action Chart Patterns by Accuracy Last Year
Last year I shared more than 1300 free signals and forecasts for Gold, Forex, Commodities and Indexes.
In my predictions, quite often I relied on classic price action patterns.
In this article, I will reveal the win rate of each pattern, the most accurate and the least accurate formations of last year.
Please, note that all the predictions and forecasts that I shared last year are available on TradingView and you can back test any of the setup that I identified last year by your own. Just choose a relevant tag on my TradingView page.
Also, some of the forecasts & signals were based on a combination of multiple patterns.
Here is the list of the patterns that I personally trade:
🔘 Double Top or Bottom with Equal Highs
The pattern is considered to be valid when the highs or lows of the pattern are equal.
The pattern gives a bearish/bullish signal when its neckline is broken.
🔘 Double Top or Bottom with Lower High/Higher Low or Cup & Handle
The pattern is considered to be valid when the second top/bottom of the patterns is lower/higher than the first one.
The pattern gives a bearish/bullish signal when its neckline is broken.
🔘 Head & Shoulders and Inverted Head and Shoulders
The pattern gives a bearish/bullish signal when its neckline is broken.
🔘 Horizontal Range
The pattern is the extension of a classic double top/bottom with at least 3 equal highs/lows.
The pattern gives a bearish/bullish signal when its neckline is broken.
🔘 Bullish/Bearish Flag
The pattern represents a rising/falling parallel channel.
It gives a bullish/bearish signal when its upper/lower boundary is broken.
🔘 Rising/Falling Wedge Pattern
The pattern represents a contracting rising/falling channel.
It gives a bullish/bearish signal when its upper/lower boundary is broken.
🔘 Rising/Falling Expanding Wedge
The pattern represents an expanding rising/falling channel.
It gives a bullish/bearish signal when its upper/lower boundary is broken.
🔘 Descending/Ascending Triangle
The pattern is the extension of a cup & handle pattern with at least 2 lower highs/lows.
The pattern gives a bearish/bullish signal when its neckline is broken.
Please, also note that all the patterns that I identified and traded were formed on key horizontal or vertical structures.
Remember that the accuracy of any pattern drops dramatically if it is formed beyond key levels.
I consider the pattern to be a winning one if after a neckline breakout, it managed to reach the closest horizontal or vertical structure, not invalidating the pattern's highs/lows.
For example, if the price violated the high of the cup and handle pattern after its neckline breakout, such a pattern is losing one.
If it reached the closest structure without violation of the high, it is a winning pattern.
🔍 Double Top or Bottom with Equal Highs
I spotted 85 setups featuring these patterns.
Their accuracy is 62% .
🥉 Double Top or Bottom with Lower High/Higher Low or Cup & Handle
96 setups were spotted.
The performance turned out to be a little bit higher than a classic double top/bottom with 65% of the setups hitting the target.
🔍 Head & Shoulders and Inverted Head and Shoulders
58 formations spotted last year.
Average win rate is 64%
🏆 Horizontal Range
The most accurate pattern of last year.
More than 148 patterns were spotted and 74% among them gave accurate signal.
🔍 Bullish/Bearish Flag
38 setups identified last year.
The accuracy of the pattern is 57%
Rising/Falling Wedge
The pattern turned out to be a little bit more accurate.
Among 62 formations, 59% end up being profitable.
👎 Rising/Falling Expanding Wedge
The worst pattern of last year.
I recognized 24 patterns and their accuracy was just 51%.
🥈 Descending/Ascending Triangle
64 patterns were identified.
The win rate of the pattern is 66%.
The most important conclusion that we can make analyzing the performance of these patterns is that they all have an accuracy above 50%. If you properly combine these patterns with some other technical or fundamental tools, the accuracy of the setup will increase dramatically.
Good luck in your trading!
❤️Please, support my work with like, thank you!❤️
I am part of Trade Nation's Influencer program and receive a monthly fee for using their TradingView charts in my analysis.
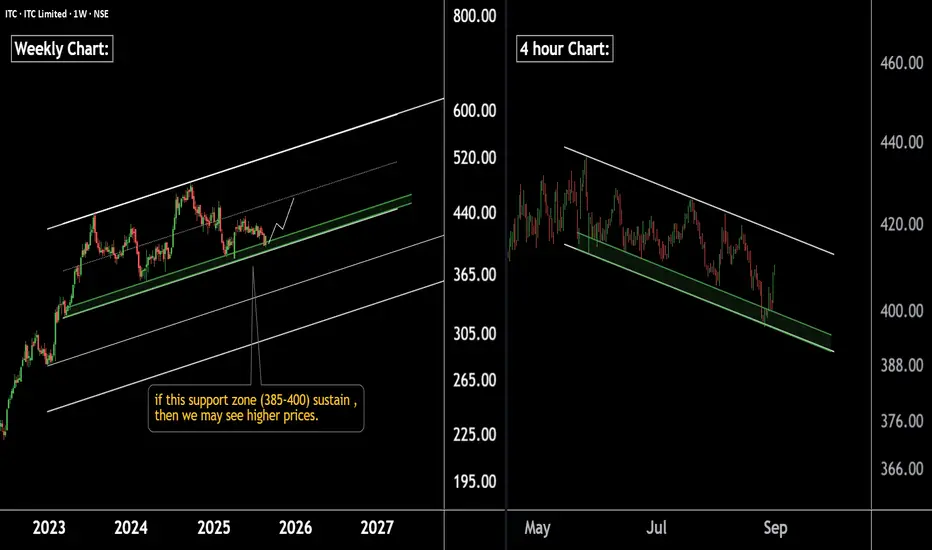
ITC at strong support zone. A good opportunity for accumulation.ITC Chart Update (Weekly & 4H Timeframe)
On the weekly chart, ITC is moving within a well-defined parallel channel, with immediate support in the 385–400 zone. A breakdown below this zone could take the stock towards the next strong support near 300.
On the 4-hour chart, ITC is forming a falling channel, with support also placed around the 390–400 zone. If this level holds, we may witness a potential upside move in ITC.
Conclusion: The 390–400 zone will play a decisive role. Sustaining above it may trigger an upward move, while a breakdown could extend weakness towards lower levels.