SHIBA: Important Pattern - UP or DOWN? 👀👇📉Hi Traders, Investors and Speculators of Charts📈
We observe an important pattern on Shiba Inu - the Flag Pattern, also known as the Pennant. From here, ONE KEY THING will give away where the price is going next. Make sure you know what to look for and don't miss it!
Another altcoin to watch closely, is LTC where we recently saw a VERY bullish sign. Find it here:
If you found this content helpful, please remember to hit like and subscribe and never miss a moment in the markets.
_______________________
📢Follow us here on TradingView for daily updates📢
👍Hit like & Follow 👍
CryptoCheck
BINANCE:SHIBUSDT
Pennant

Upward momentum of 10% -15% in IOC expected on BOSIOC has seen a consolidation on DTF (bullish pennant) after almost a consolidation of more than 60 days. Confirmation to be given on break of structure.
The company has a upwards of 500% increase in EPS QoQ growth for the last 3 quarters and increase in institutional interest.
Good for swing traders. Can expect an upward momentum of a min of 10-15%. Targets plotted on the chart.
Entry - INR 175
SL - (DL)
TSL - According to your risk profile.
Disclaimer: Please be advised that the information provided is not intended as financial advice. It is imperative to conduct thorough research before making any investment or trading decisions.

Triangle BREAKOUT on #BTCAs mentioned in the earlier post, the support level of over 65,000 remains intact.
Yesterday witnessed a significant breakthrough with Bitcoin surpassing the $71,000 mark.
Consequently, as long as the price of BTC maintains its position above $70,000, there's a strong indication of a potential new all-time high in the near future.
Additionally, it's worth noting that the MACD indicator is showing signs of convergence, with a near crossover.
DYODD.

HelenP. I Bitcoin will make correction and then continue to growHi folks today I'm prepared for you Bitcoin analytics. A few moments ago price reached the trend line and then at once rebounded from it and made a strong impulse up to support 2, which coincided with the support zone. As well, BTC started to trades in a pennant pattern, where soon price broke support 2 and made a retest. After this, BTC some time traded near this level and then made impulse up again to support 1, which coincided with the resistance zone and even entered to this zone. But soon, BTC turned around and in a short time declined to support 2, breaking support 1 one more time. After this movement, BTC rose back to support 1 and some time traded near this level, after which rebounded and fell to the support line of the pennant, which is the trend line too. A not long time ago Bitcoin rebounded from this line and made a strong impulse to higher support 1, thereby breaking it one more time and exiting from the pennant pattern. Now, the price continues to trades in the resistance zone and I expect that Bitcoin will make a little correction, after impulse up, and then continue to rise. For this case, I set my target at the 76000 level. If you like my analytics you may support me with your like/comment ❤️

Bitcoin 80K incomingLooks like CRYPTOCAP:BTC is gearing up to consolidate, forming a symmetrical triangle while RSI hints at hidden bullish divergence. 📈 Let's see how the probabilities play out! I'm on the bull side. #Bitcoin #Crypto #Bullish

BTC-USD (BITCOIN)The btc pair creates a pennant in the 1D timeframe. If the market breaks this pattern then a big move is expected, there is also an order blocker in 1d at 52500-51000 range. If the market does not give respect to the downward order block and breaks above then the market goes above 85000.

Bullish pennant breakout.RSI looking healthy.
80k incoming as BTC approaches the dmi and bounces off of the upward sloping support of the pattern.

Enzyme (MLN), Pennant breakoutOn the above daily chart price action has consolidated for approximately 20 days to form a pennant formation. A breakout occurred today. The pennant breakout occurs on past resistance, which now confirms as support.
The forecast is straightforward enough with the flagpole measuring a 60% move to the upside.
The target area is not to be confused with a market top.
Is it possible price action continues to correct further? Sure.
Is it probable? No
Ww
Type: trade
Risk: You decide
Timeframe for long: 24-48hrs
Return: 60%

Swiss Franc can exit from pennant and try to break support levelHello traders, I want share with you my opinion about Euro. Looking at the chart, we can see how the price some time ago broke the support level, which coincided with the buyer zone and rose a little higher, after which CHF made a retest to the 0.8840 level. Then, the price entered an upward pennant and made at once strong impulse up from the support line to the current support level, which coincided with the support area, but when CHF reached this level, it made a fake breakout and fell below. After this, the Swiss Franc in a short time rose back to the 0.9000 level and broke it, after which continued to move up. But soon, the price rebounded down to the support area, where it some time traded and then rose to the resistance line of the pennant. Next, CHF turned around and declined back to the support area, where at the moment, it continues to trades near the support level and line of pennant. In my opinion, the Swiss Franc can rise from the support line to almost the resistance line of the pennant and then rebound down to 0.8935 points, thereby exiting from this pattern and breaking the current support level. Please share this idea with your friends and click Boost 🚀

BTC Bullish Continuation & Future predictions Bullish pennant has formed on CRYPTOCAP:BTC , price is currently ranging. We'll see a break to the upside sooner or later after the range is done.
Expect new ATH's, this is possibly the final leg up before we hit complacency & mass retail enter.
We'll arrive at bear szn once again.
CBDC's will be pushed through globally 2025+. All thanks to crypto (Trojan horse) warming up the stage, to allow for a digital global currency. People are now used to the idea of digital money - especially and most importantly Gen Z who are the future.
Crypto is not 'freedom'. Cash is king, it's non traceable - You can track crypto through blockchain. Everything is documented.
Only a matter of time till UBI's will arrive as well. Universal basic income, which will be digital. AI will replace most jobs, and this will be the 'solution'. Limited spend, and maximum gov control.
This should make you question who the real founders of BTC is.
The wealth gap is widening and will only get worse, it's now or never to set your generations up to free from the system.
Don't sleep on this era - You're on this timeline for a reason.

ANF showing a pennant patternNYSE:ANF Showing a pennant pattern with a ~$50 upside. Buying on the dips.

XVG IdeaHi crypto Enthusiasts, here is a quick update on the XVG chart, 4H & 1D.
XVG Volume changed recently, on the left(4H) we see price approaching recent OB after making a retracement to fill the gaps.
Short term potential 68% RR - 3.24

Identifying a Bullish Pennant on Meta's 1-Day ChartThis lesson examines a potential bullish pennant forming on Meta Platforms Inc. (META), formerly Facebook, on its 1-day chart.
What is a Bullish Pennant?
A bullish pennant is a continuation pattern in technical analysis that suggests an asset's price is consolidating after a strong upward move. It's characterized by two converging trendlines, forming a pennant shape. The target price for a bullish pennant breakout is typically the height of the pennant added to the breakout point.
Identifying the Bullish Pennant on Meta's Chart:
On Meta's 1-day chart, we can observe:
Price Consolidation: Following a significant price increase, the price appears to be trading within a narrowing range between two converging trendlines. This consolidation phase suggests a potential pause before the uptrend resumes.
Target Price: By measuring the height of the pennant (the vertical distance between the trendlines), we can estimate a potential target price upon a breakout. Adding this height to the breakout point (the price where the price decisively breaks above the upper trendline) provides a preliminary target. In this case, a breakout above the resistance level could suggest a target price of $690
Important Considerations:
Confirmation from Other Indicators: While a bullish pennant is a positive technical signal, it's not a guarantee of a price increase. Look for confirmation from other technical indicators like:
Volume: Increasing volume on the breakout can strengthen the bullish case.
Moving Averages: A rising 50-day or 200-day moving average can indicate an underlying uptrend.
Relative Strength Index (RSI): An RSI value below 70 on the breakout suggests the stock isn't overbought, potentially allowing for further price appreciation.
Market Context: Consider any recent news or events that might be impacting Meta's stock price. Positive news can fuel the breakout, while negative news could hinder it.
Support and Resistance Levels: Identify key support and resistance levels on the chart. A breakout above a resistance level is more significant if it's accompanied by increasing trading volume.
Target Price: The target price based on the pennant pattern is an estimate, and the actual price movement could deviate significantly.
Conclusion:
The potential bullish pennant on Meta's chart suggests a possible continuation of the uptrend. However, it's crucial to use this information alongside other technical indicators, fundamental analysis, and proper risk management practices before making any investment decisions.

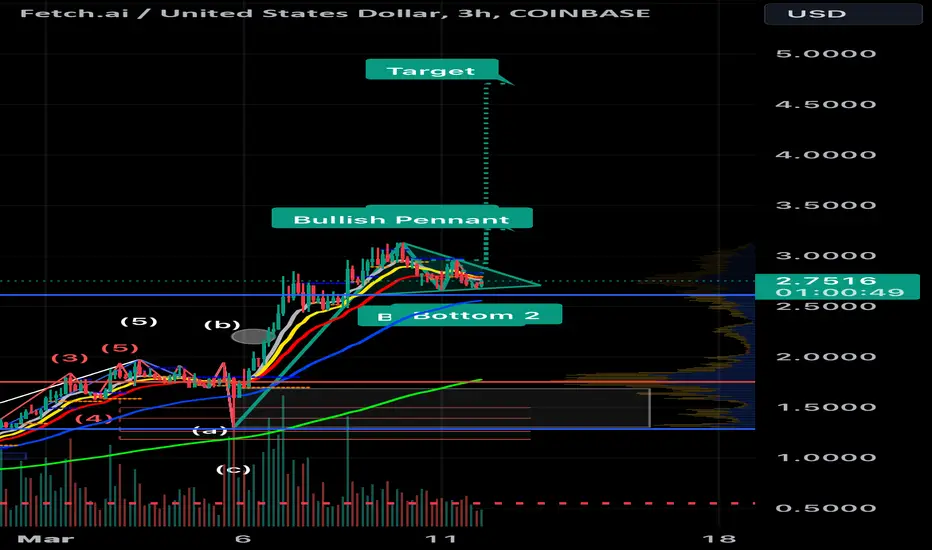
Fetch.ai (FET) Chart Analysis: Observing a Bullish Pennant BreakThe FET/USD 3-hour chart displays a pattern resembling a bullish pennant breakout. If this breakout is confirmed, technical analysis suggests a potential price target of $4.71.
Pennant on LAURSLABSLAURSLABS formed a Pennant on weekly chart. Price had a good runup prior to formation of pattern with high volume. It also had low volume upon formation of Pennant (i.e. during consolidation). Breakout has happened with above average volume as well. Entry is just above today's high with stop loss just below today's low. This setup has an ideal risk reward ratio. A typical text book setup.
Hope you like this analysis. If you like this idea please boost this idea or leave a comment below on what your view is. I'll be happy to hear from you. Otherwise, happy trading :-)

$BTC forming bullish pennant flagMIL:BTC 's current price action suggests a bullish flag continuation pattern which is so much better than forming a bearish rising wedge.

Bitcoin can correct to support line and then make impulse upHello traders, I want share with you my opinion about Bitcoin. A not long time ago price rebounded from the support level, which coincided with the support area, and in a short time rose to 69000 points, after which turned around and made a strong downward impulse to lower the 64800 level, breaking it. After this movement, BTC started to trades in an upward pennant, where rebounded from the support line and quickly rose to 68200 points, breaking the support level again, but soon price repeated a downward impulse and fell back to the support line, breaking the 64800 support level one more time. Soon, BTC started to grow and in a short time reached the support level, broke it, and finally continued to move up to the resistance level, but firstly it made a retest of the support level and only then continued to grow. When the price reached a resistance level, which coincided with the seller zone, BTC broke it, and some time traded in this zone, after which made a small correction below. Later price rose to the resistance line of the pennant, after which rebounded down, and at the moment price trades very close to the resistance level. For this case, I think that Bitcoin can make a correction movement to almost the support line and then the price will impulse up a higher resistance line and 70500 level, thereby exiting from the pennant. After this, I think BTC will continue to grow to 72500 points. Please share this idea with your friends and click Boost 🚀

ICP Road Map🗺️!!! situation+next targets.Hi.
COINEX:ICPUSDT
Today, I want to analyze ICP for you in a 3D time frame so that we can have a mid-term view of ICP regarding the technical analysis. (Please ✌️respectfully✌️share if you have a different opinion from me or other analysts).
Bullish pennant is on the table on 3D timeframe🔍
Looking for a break out and more upside📈
✅ Due to the Ascending structure of the chart...
- High potential areas are clear in the chart.
- AB=CD
- Ascending pennant
Stay awesome my friends.
_ _ _ _ _ _ _ _ _ _ _ _ _ _ _ _ _ _ _ _ _ _ _ _ _ _ _ _ _ _ _ _ _
✅Thank you, and for more ideas, hit ❤️Like❤️ and 🌟Follow🌟!
⚠️Things can change...
The markets are always changing and even with all these signals, the market changes tend to be strong and fast!!

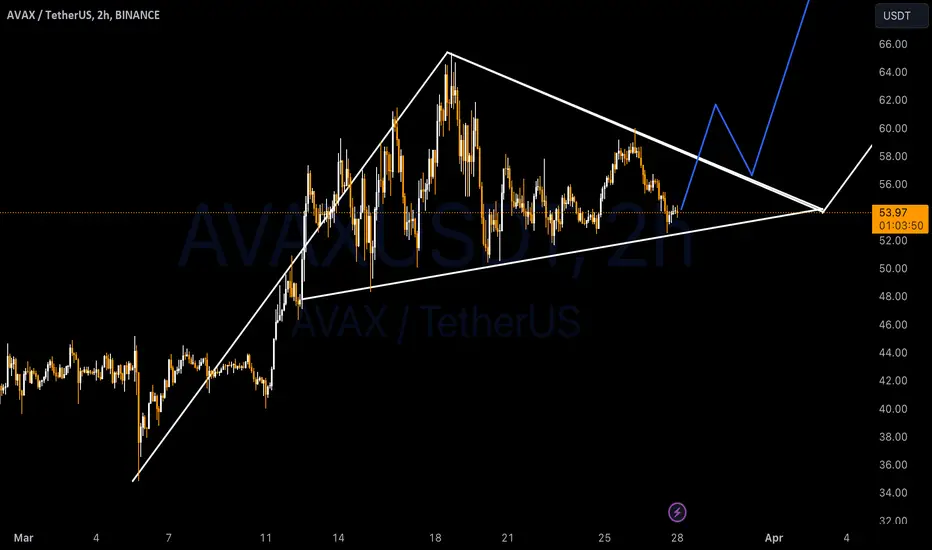
Avax to $88 waiting for breakoutPopular EVM compatible coin AVAX BINANCE:AVAXUSDT has been forming a bullish pennant on the 12 hour timeframe. Recently a number of AVAX based meme coins have done well seemingly in response to AVAX coin’s performance.
According to data from coin gecko.com, the price of Avax has risen by 37.9% in the last 30 days and is up 228% over the last one year. Still this coin is down 55.7% from it’ all time high and a return to this valuation would be a 122% gain in price.
Wait for a bullish breakout from this pennant or a breakout plus retest to confidently trade this upwards with an initial or short term target just above $85. Happy Trading!
If you found this trade idea helpful in anyway kindly support my work by leaving a thumbs up, boost and/or sharing this post with your Crypto bros. To make sure you’re one of the first to get notified when I share a new trade idea, consider following my account. Happy Trading!
✴️ Tariq Glass Entering New Long-Term Bull-MarketTariq Glass is currently maintaining its support level at 98 for the past week, representing a 38.2% Fibonacci retracement from the 106 level. Additionally, the stock has reached the breakout level of a descending trend line, signaling a robust bullish breakout. Furthermore, it has surged above the EMA50 indicator in the ongoing session. Consideration of long positions is advisable within the range of 100-98. Following the breakout from the trend line, the initial target is positioned at 104, with a secondary target at 106. Conversely, in the event of a downside breakout, employing a stop-loss strategy at 95 is recommended to mitigate risk exposure.

ARM March 15, 24: A Symmetrical Triangle?On March 15, 24, I am looking to trade NASDAQ:ARM using this symmetrical triangle/bullish pennant pattern.
A move up piercing the upper trendline will present a buy signal, with volume confirmation on break out.

Link still on track.LINK/USD 2hr chart shows a potential breakout from a wedge pattern with a target of $21. A break above $18.70 can trigger breakout.
The LINK/USD 2hr chart shows an interesting development with a potential breakout from a wedge pattern. The price has broken above the resistance trendline and could potentially reach the target of $21 based on the measured move technique. However, this is not a prediction, and other factors could influence the price action. What are your thoughts on this potential breakout and its implications? Remember, this is for educational purposes only, and you should always do your own research before making any investment decisions.

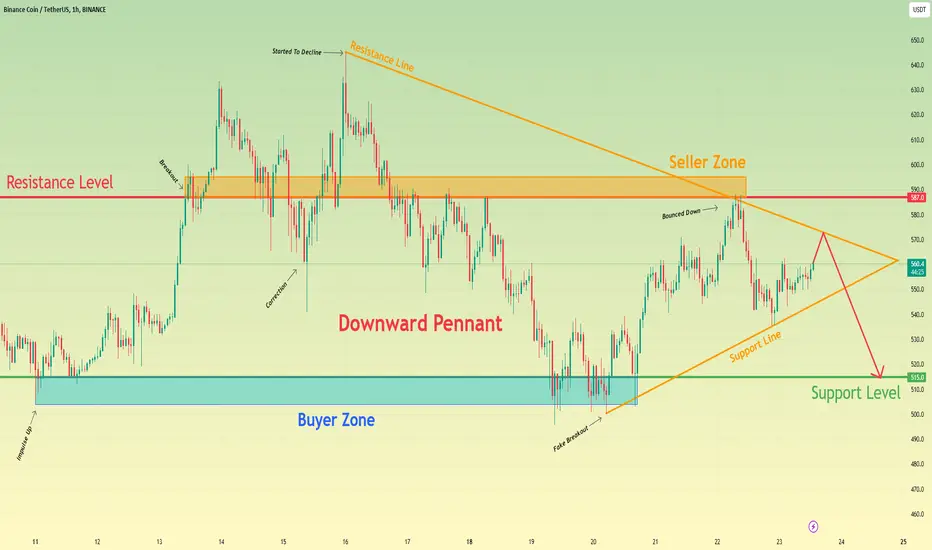
Binance Coin can exit from pennant and decline to 515 levelHello traders, I want share with you my opinion about Binance Coin. Looking at the chart, we can see how the price some time ago declined to 515 support level, which coincided with the buyer zone and at once rebounded and started to move up. Soon, the price reached a resistance level, which coincided with the seller zone and broke it, after which BNB rose a little and then made a correction below this level. Next, the price broke the 587 level again and later rose to 645 points, after which it turned around and started to decline in a downward pennant, where soon broke the resistance level one more time. After this movement, BNB made a retest of the resistance level and in a short time declined to the buyer zone, which later reached the support line of the pennant. Then price rebounded from the support line and rose to the resistance line, which coincided with the resistance level, but a not long time ago BNB rebounded and fell to the support line, which continues to rise near to this day. So, I think Binance Coin can reach the resistance line, after which turns around and starts to decline to the support level, thereby exiting from the pennant. For this case, I set my target at the 515 level. Please share this idea with your friends and click Boost 🚀