DXY:Today's trading strategyTrump's announced comprehensive tariff plan has triggered global attention. As for the U.S. Dollar Index, on Thursday, the price of the U.S. Dollar Index generally showed a significant downward trend. On that day, the price rose to a high of 103.931 at most, dropped to a low of 101.232, and closed at 101.937.
Looking back at the performance of the U.S. Dollar Index price on Thursday, after the opening in the morning, the price continued to decline in the short term. Subsequently, the price remained weak all the way with almost no rebound. It underwent short-term oscillatory consolidation and finally closed with a large bearish candlestick on the daily chart. For now, pay attention to the resistance in the 102.80 area and the level of 102.40, and keep a continuous watch for further bearish pressure.
Trading Strategy:
Sell@102.50-102.60
TP:101.50-101.30
Get daily trading signals that ensure continuous profits! With an astonishing 90% accuracy rate, I'm the record - holder of an 800% monthly return. Click the link below the article to obtain accurate signals now!
Pivot Points

TST Sell/Short Setup (4H)TST has a bearish structure on the higher timeframes.
It is currently in a pullback phase within the substructure.
We are looking for sell/short positions around the flip zone, which acts as a Supply area.
There is a liquidity pool at the bottom of the chart, which is likely the target for a sweep.
A daily candle closing above the invalidation level will invalidate this outlook.
Do not enter the position without capital management and stop setting
Comment if you have any questions
thank you

XAUUSD:Wait for Nonfarm Payrolls to boost upward trendOn Thursday, the price of gold plummeted by $110 initially. Subsequently, it rebounded from $3,054 to $3,135, surging by nearly $80. This was a typical market scenario of a double whammy for both bulls and bears in a washout. Whether it was those who chased long positions at high levels or those who chased short positions expecting a pullback, they all suffered losses. The level of $3,054 witnessed a perfect conversion from a top to a bottom.
Today, when it comes to the resistance levels of gold, there are two key positions to focus on. One is the morning's high point at $3,120, and the other is the high point of the pullback at $3,135. As for the support levels below, we should pay attention to $3,080 and $3,065. There will be a market movement influenced by the Nonfarm Payrolls data tonight. It is expected that before the release of the data, the price will fluctuate within a range above and below $3,100, which serves as the demarcation line. When the price surges, look for a pullback towards $3,100; when it dips, look for a rebound towards $3,100. It is recommended to mainly take long positions at low levels. Tonight, we need to pay attention to whether the Nonfarm Payrolls data will help gold prices rise again.
Here, I would like to caution all traders once again to protect their accounts. Wait until the washout of both bullish and bearish forces is over before resuming trading!
Trading Strategy:
buy@3080
TP:3110
Sell@3135
TP:3100
Get daily trading signals that ensure continuous profits! With an astonishing 90% accuracy rate, I'm the record - holder of an 800% monthly return. Click the link below the article to obtain accurate signals now!

BTCUSDT:Test support, go long on pullbackBitcoin has also experienced a rapid decline due to the tariff remarks of the U.S. government. It is currently testing a key support level. If it continues to fall and breaks below 81,126, a bearish trend will be confirmed. If this support level is not breached, one can initiate long positions at the low level.
Trading Strategy:
buy@81500-82500
TP:83500-84500
Get daily trading signals that ensure continuous profits! With an astonishing 90% accuracy rate, I'm the record - holder of an 800% monthly return. Click the link below the article to obtain accurate signals now!

USOIL:Continue to move downwardAfter U.S. President Donald Trump announced tariffs and the OPEC+ decided to increase oil production, concerns about the demand outlook intensified, leading to a significant decline in crude oil prices on Thursday.
The short-term trend of crude oil has dropped sharply, with all the gains since mid-March being given back. The oil price has touched a low near 66. The moving average system diverges downward, and objectively, the short-term trend direction is downward. The bearish momentum is abundant. It is expected that after a minor adjustment at a low level in the intraday trading, the short-term trend of crude oil will mainly continue to move downward.
Trading Strategy:
buy@67.5-68
TP:66-65.5
Get daily trading signals that ensure continuous profits! With an astonishing 90% accuracy rate, I'm the record - holder of an 800% monthly return. Click the link below the article to obtain accurate signals now!

IAG Additional Price Levels • LSE • Airlines Group Stock • FTSE⚠️ IAG Going to plan, looks like it's a TRUMP DUMP 🤣
Now is the TIME TO HUNT the stocks for your PORTFOLIO.
ℹ️ When TRUMP causes a DUMP I accumulate SIT BACK and just WAIT fornthe PUMP...🚀
These additional price levels will be used as an additional filter to TIME an ENTRY ONLY IF the BIDS come in 🟢SeekingPips🟢 NEEDS to see some VOLUME🚀🚀🚀

PEPE/USDT:FREE SIGNALHello dear friends
Given the price drop we had in the specified support range, a double bottom pattern has formed, indicating the entry of buyers.
Now, given the good support of buyers for the price, we can buy in steps with capital and risk management and move to the specified targets.
*Trade safely with us*

CRV/USDT: BUYHello dear friends
Due to the good price growth
Now we can buy in stages with capital and risk management and move towards the specified goals.
*Trade safely with us*

Bear Flaggin!I see the target as $25 to $26 in the near term for a final leg down before rallying to the 50% retracement level.
Volume, Politics and overall structure looks very week for semi/tech hardware stocks.
If we do rally next week from here, I would continue to short. Ill update next week.

AUD/USD For Bullishwait for pull-back near by entry point and then go long
general trend is up trend
have fun :)

NZD/USD For Bullishwait for pull-back near entry point or FVG and then go long
general trend is up trend
have fun :)

EUR/USD For Bullishwait for pull-back near by entry point or Fear Value Gap and then go long
general trend is up trend
have fun :)

Day trade XAU- Thu, 03 Apr 2025. TariffPrice continue follow risk Trump Tariff- UP
This plan for study purpose, not financial advice! Self control yours action!
Good luck mates!
#MakeCent #TradingMakeSense

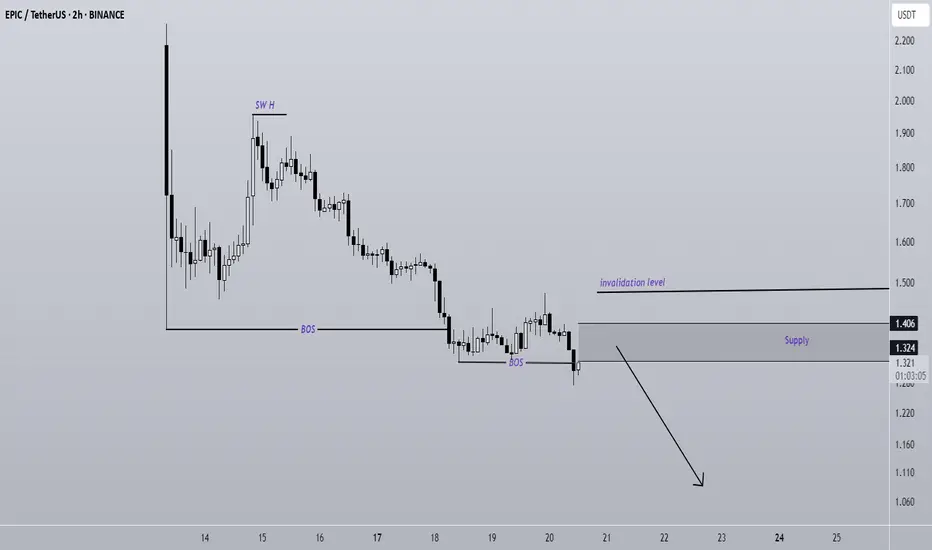
EPIC Is Bearish (2H)It has a bearish structure and is forming a trading kink, which acts as a supply zone. We expect a rejection to the downside from this supply area.
When your profit exceeds 10%, break even and secure some profits.
A daily candle closing above the invalidation level will invalidate this analysis.
A daily candle closing above the invalidation level will invalidate this outlook.
Do not enter the position without capital management and stop setting
Comment if you have any questions
thank you
This is a perfect parallel channel on XRP.This represents an ideal parallel channel. If you secured it today at the $2.0000 level, you're extremely fortunate. Opportunities like this are rare—once it appears, hold on tight and ride it to the top. The target is set at $4.38 around April 25th, 2025. Wishing you great luck and success.

Bitcoin Breaks Resistance – Bullish Flag in Play(Short-term)!!!Bitcoin ( BINANCE:BTCUSDT ) started to rise and pump after '' the Mastercard Plans to Enable 3.5 Billion Cardholders to Transact with Bitcoin and Crypto, " and the US indexes movements and managed to break the Resistance zone($84,380_$83,580) .
Bitcoin is moving near the Monthly Pivot Point and Support lines .
Bitcoin seems to be completing the Bullish Flag Pattern .
I expect Bitcoin to reach the Targets I have outlined on the chart in the coming hours and most likely fill the CME Gap($86,620_$86,565) .
There is a possibility that Bitcoin will fall again after this increase. What do you think!?
Note: The Crypto market is full of excitement. Please pay more attention to capital management than before.
Note: This analysis could be a short-term Roadmap for Bitcoin .
Note: If Bitcoin falls below $83,500, we should expect further declines, possibly heavy declines.
Please respect each other's ideas and express them politely if you agree or disagree.
Bitcoin Analyze (BTCUSDT), 15-minute time frame.
Be sure to follow the updated ideas.
Do not forget to put a Stop loss for your positions (For every position you want to open).
Please follow your strategy and updates; this is just my Idea, and I will gladly see your ideas in this post.
Please do not forget the ✅' like '✅ button 🙏😊 & Share it with your friends; thanks, and Trade safe.

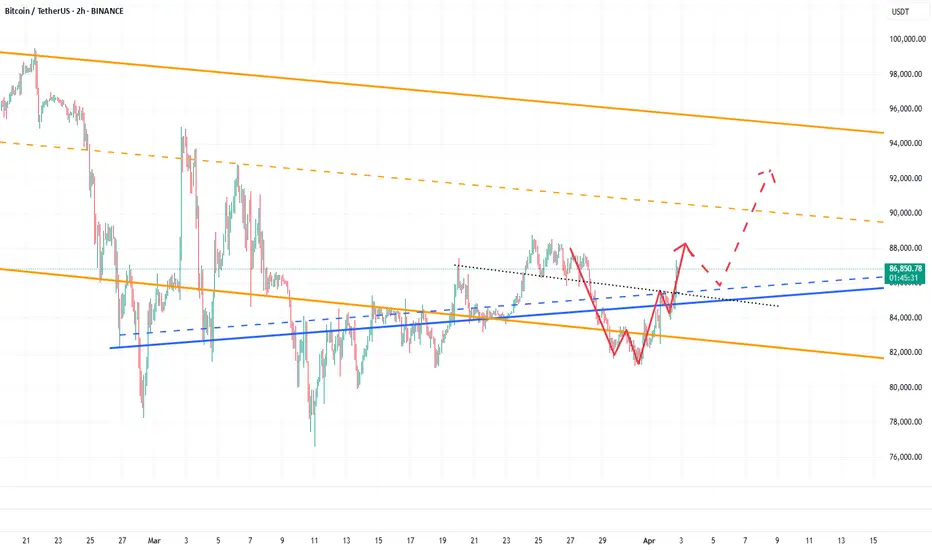
BTC already has the conditions to hit the 90000-95000 zone!A few days ago, I mentioned that BTC had the potential to surge towards the 90000-95000 range. Currently, BTC has already climbed above 87000 during its rebound, effectively opening the door to the 90000-95000 zone.
From a fundamental perspective, with bearish factors becoming clearer, if Trump adopts a more lenient stance on tariffs, BTC could extend its rebound. On the technical side, BTC has successfully broken through the short-term resistance around the 85500 level, turning the 85500-84500 area into a short-term support structure. This transition further supports BTC’s continuation to the upside, potentially testing the 90000-95000 range.
For short-term trading, we can consider waiting for a technical pullback and looking to go long on BTC once it retraces to the 85500-85000 region. The trading strategy verification accuracy rate is more than 90%; one step ahead, exclusive access to trading strategies and real-time trading settings
BTC ANALYSIS (4H)If we look at Bitcoin on hourly timeframes, we expect a rejection from the red zone. However, this rejection must be strong because if it is weak, Bitcoin may not be inclined to correct further or might at least enter a choppy corrective trend.
The substructure is also bearish, a trigger line has been lost, and ultimately, we have a bearish iCH on the chart.
Closing a 4-hour candle above the invalidation level will invalidate this analysis.
For risk management, please don't forget stop loss and capital management
When we reach the first target, save some profit and then change the stop to entry
Comment if you have any questions
Thank You

EURUSD:The euro is facing a "battle at key resistance levels"The EURUSD exchange rate continues its rebound momentum. Although the weak inflation data in the eurozone has strengthened the market's expectation of an interest rate cut by the ECB, the US dollar has weakened due to the risk - off sentiment triggered by Trump's tariff remarks, which has become a key factor supporting the short - term upward movement of the euro.
We can focus on the initial resistance level of 1.0880 above. If this level is not breached, one can attempt to short at high levels.
Trading strategy:
Sell@1.0880
TP:1.0780
Get daily trading signals that ensure continuous profits! With an astonishing 90% accuracy rate, I'm the record - holder of an 800% monthly return. Click the link below the article to obtain accurate signals now!

DXY:Expect an uptrend based on the daily chart supportOn Tuesday, the price of the U.S. Dollar Index generally fluctuated in a range. The price reached a daily high of 104.345, a low of 103.99, and closed at 104.19.
Looking back at the performance of the U.S. Dollar Index on Tuesday, after the morning opening, the price initially fell under short-term pressure. Subsequently, it halted its decline and resumed its upward movement above the daily support level, but the overall range was limited. The price rose in a volatile manner, and finally closed with a bullish doji.
From a weekly perspective, continue to focus on the 106.60 level, which is a key level for the medium-term trend. Below this level, the medium-term trend is bearish, and the price increase is temporarily regarded as a correction within the medium-term decline.
Meanwhile, from a daily perspective, temporarily pay attention to the 103.90 level, which is crucial for the wave trend. Above this level, adopt a bullish stance for the wave trend. Also, on the four-hour chart, temporarily focus on the support at the 104.10 area. Therefore, before the price breaks below the low of Monday, bet on an upward movement based on the daily support. Only after a downward break will the trend turn bearish.
Currently, there is a lot of news, so everyone must be cautious of market risks.
Trading Strategy:
buy@103.90-104
TP:104.50-104.80
Get daily trading signals that ensure continuous profits! With an astonishing 90% accuracy rate, I'm the record - holder of an 800% monthly return. Click the link below the article to obtain accurate signals now!

PLUME looks bullish (4H)A key trigger level has been broken, followed by a strong upward move.
The structure is bullish. We will look for buy/long positions in areas with high trading volume.
A daily candle closing below the invalidation level will invalidate this analysis.
Do not enter the position without capital management and stop setting
Comment if you have any questions
thank you

XAUUSD:Short at highs primarily, long on pullbacks secondarilyThe 4-hour chart shows that the short-term moving averages of gold are converging, and the lower shadows of the K-lines appear frequently. The downward momentum is weakening, which may indicate a technical correction after a period of sideways consolidation, and there is a possibility of a second upward pull.
The hourly chart shows that the price range is narrowing, and the technical pattern is gradually being adjusted into place. Currently, the upper resistance levels are between 3137 and 3142, and the lower support levels are between 3111 and 3107.
In terms of trading operations, I suggests mainly taking short positions near the end of the trading session, with going long on the pullback as a secondary strategy.
XAUUSD Trading Strategy:
sell@3130-3135
TP:3120-3110
buy@3110-3115
TP:3125-3130
Get daily trading signals that ensure continuous profits! With an astonishing 90% accuracy rate, I'm the record - holder of an 800% monthly return. Click the link below the article to obtain accurate signals now!

BTCUSDT:The long position strategy has reaped profits successfulAs I had anticipated, Bitcoin (BTC) has started to recover. BTC has successfully broken through the 86,500 mark and even reached 87,000. The long position strategy has achieved profitability.
Currently, Bitcoin still maintains a bullish trend. It is advisable to wait for a price pullback and then initiate long positions.
BTC Trading strategy:
buy@84500-85500
TP:86500-87500
Get daily trading signals that ensure continuous profits! With an astonishing 90% accuracy rate, I'm the record - holder of an 800% monthly return. Click the link below the article to obtain accurate signals now!
