ITC HOTAL WEAK ITC HOTAL WEAK
Compared to international hotel chains, ITC Hotels has a relatively smaller footprint globally, which limits its market share and brand recognition outside India
Pivot Points

NZD/JPY For Bearishyou can go short now
or
wait for pull-back near by entry point and then go short
general trend is up trend
current phase is pull-back
have fun :)

EUR/JPY For Bearishyou can go short now
or
wait for pull-back near by entry point and then go short
general trend is up trend
current phase is pull-back may be finish at target 3
have fun :)

ITC WEAK TREND 380-360ITC WEAK TREND 380-360
ITC recently acquired Century Pulp and Paper from Aditya Birla Real Estate for ₹3,498 crore. This acquisition is expected to expand ITC's paper capacity by 48%

not coin journey to 0.004it seems everything is ready for notcoin to reach 0.004
sl: under 0.0022
you can save profits on 0.0035

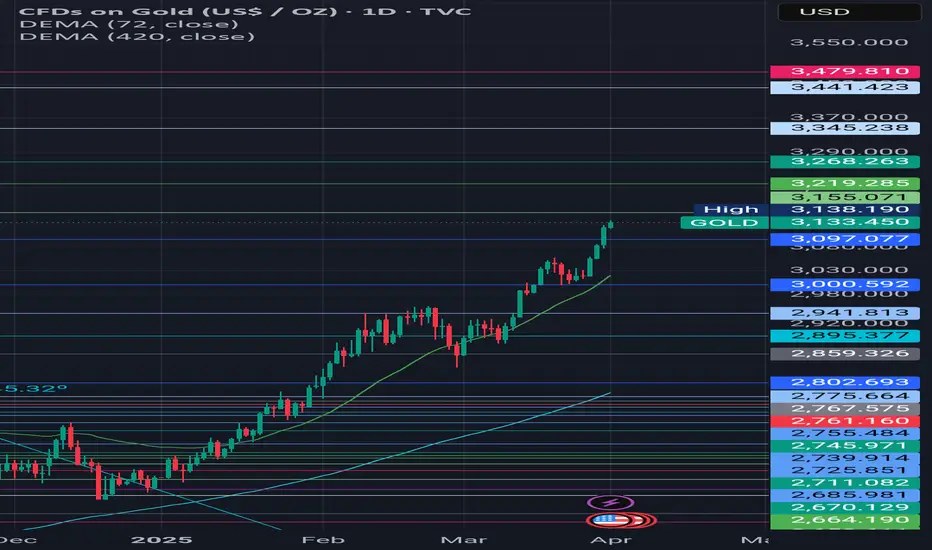
Gold Investors Beware: Bears Are Quietly AssemblingGold’s candlestick chart has displayed multiple upper shadows above the 3025-3030 zone, widely regarded as a clear rejection signal. With repeated failures to break through this resistance, gold is showing signs of forming a potential short-term top. This not only caps the upside but could also act as a key indicator of a possible bearish reversal.
Following the Asian session's opening, gold experienced a slight gap up but failed to sustain its momentum, maintaining a range-bound movement instead. The lack of strong bullish follow-through reflects weak buying interest.
Additionally, recent statements from Trump suggest a softened stance on tariff policies, with his rhetoric appearing less aggressive. If the tariffs are implemented in a more moderate manner or market reactions are less severe than anticipated, risk-off sentiment could subside, leading to a significant pullback in gold prices.
But given the presence of strong buying interest and bullish sentiment consolidation, expectations for an extensive decline remain limited. The primary support to monitor lies in the 3110-3100 range. If gold break below this zone, it may trigger an accelerated drop, with the next downside target at the 3095-3085 region.
The trading strategy verification accuracy rate is more than 90%; one step ahead, exclusive access to trading strategies and real-time trading settings

THE SKY IS THE LIMITI am a nine to fiver so at times I don't have time for the charts, but like I said on a video yesterday, this week I am looking for Buys Buys and BUYS. Stay Tuned. Happy trading

gold fibonacci levels gold is continuing to make new highs new levels to take profits from i wouldn't short this uptrend is still strong
ADA - Next Trade Setups to WatchADA’s been stuck in this sideways grind for a while, and the volume’s basically ghosting us. So, where’s it at, and where’s the next move? Let’s dig in.
ADA’s sitting at $0.6615 right now, trading below the yearly open at $0.8451 and the range’s sweet spot, the POC, at $0.7325. That tells me it’s leaning a bit bearish, but not exactly screaming panic, more like it’s just chilling in this 57 day range. It tapped the monthly open at $0.6328 recently, bounced a little, but without volume showing up, it’s like nobody’s ready to commit yet.
Key Levels
Resistance Zones (Short Opportunities)
1.) Range POC: $0.7325, this is the most traded price within the 57 day range, acting as a magnet for price. A rejection here could signal a short setup.
2.) Yearly Open ($0.8451): a psychological and structural level that could cap upside if momentum remains weak. Trading below this level keeps the yearly bias bearish. A break above with volume would flip the narrative.
Support Zones (Long Opportunities)
1.) Monthly Open: $0.6328, already saw a little bounce here with that swing failure move, perfect setup for a long trade if you were quick on the draw.
2.) Yearly Open 2024 + 21 Monthly EMA: $0.594 - $0.5928, strong confluence with the prior yearly open and a key moving average. This zone aligns closely with the swing low at $0.5801, forming a robust support cluster between $0.5801 - $0.594.
3.) 21 SMA: $0.53, a deeper support level if the above zone fails. This would indicate a more significant breakdown, but it’s a potential accumulation area for longer-term traders.
Market Structure Analysis
Bearish Bias Above Swing Low: Trading below the yearly open and POC suggests sellers are in control unless price reclaims $0.7325 with conviction.
Range-Bound Behaviour: The 57 day range indicates consolidation. Volume is the missing catalyst, watch for a spike to confirm direction.
Swing Low as Key Pivot: The $0.5801 level is critical. A hold here maintains the range; a break below shifts focus to $0.53 and signals capitulation.
High-Probability Trade Setups
Long Setups
1.) Long Setup #1 at Swing Low ($0.5801 - $0.594 Zone)
Entry Trigger: Look for a swing failure pattern (SFP) where price dips below $0.5801, reclaims it, and shows rejection of lower prices (e.g., a bullish candle with a wick below).
Stop Loss (SL): Place just below the swing low
Take Profit (TP): $0.70 (near-term resistance)
Stretch Target: $0.8451 (yearly open), though this requires stronger momentum.
Confirmation: Higher-than-average volume on the reclaim + bullish price action (e.g., engulfing candle).
2.) Long Setup #2: $0.4735 Sniper Entry
Entry Trigger: If ADA takes a bigger tumble, $0.4735 is your sniper’s nest, think of it as catching the knife with style. Could be a wick that snaps back.
This is a deeper, high-reward play. Price has to fall by a lot from here, but if it hits, the R:R is amazing, and it’s below most traders radar. Patience is the name of the game.
Short Setup
At POC ($0.7325) or Yearly Open ($0.8451)
Strategic Outlook
Current Stance: If not in a trade, the $0.5801 level is the highest-probability long setup due to confluence and R:R. The SFP at $0.6328 today was a missed opportunity, but a deeper pullback sets up an even better entry.
Breakout Watch: A decisive close above $0.7325 (POC) with volume shifts focus to $0.8451. Conversely, a break below $0.5801 targets $0.53.
Patience is Key: Low volume suggests waiting for a clear catalyst (e.g., news, BTC move) to drive ADA out of this range.
Wrapping It Up
The $0.5801 swing low long with SL below and TP at $0.7 - $0.8451 is the standout trade right now—low risk, high reward, and backed by confluence. Monitor volume closely, as it’s the linchpin for any breakout or reversal. If ADA holds this support and volume picks up, the retest of $0.8451 becomes plausible.
If you found this helpful, please leave a like and a comment. Happy trading!

Trading with the CoffeeKiller Suite: A Friend-to-Friend GuideHey there! So you've got the CoffeeKiller indicator suite loaded up on your charts, and you're wondering how to use them together as a cohesive trading system. Let me walk you through how I'd approach this setup with the Rev&Line with TrendMarker on your main price chart and the RSI+MFI Momentum Mapper and MACD Boundary as your oscillators below.
The Big Picture: How These Work Together
Think of this setup as a three-layer confirmation system:
1. Rev&Line with TrendMarker gives you the big picture trend and potential reversal points on price
2. RSI+MFI Momentum Mapper shows you the underlying momentum strength
3. MACD Boundary confirms cycle timing and helps with entry precision
What makes this system powerful is how they complement each other. When all three align, you've got a high-probability trade setup.
Reading Your Main Chart: Rev&Line with TrendMarker
This is your primary trend identifier. The key features to watch are:
- Background color: Green means bullish (both SuperTrend and PSAR agree), red means bearish. This is your first clue about trend direction.
- ZigZag lines: These connect significant pivot points, helping you visualize the trend structure.
- Marker lines: These track the price range of the current swing. The high (magenta) and low (cyan) marker lines create a channel that price tends to respect.
- Triangle signals: When you see a down triangle at a pivot high or an up triangle at a pivot low, pay attention! These often mark potential reversal points.
The beauty of the Rev&Line indicator is that it combines multiple technical concepts (ZigZag, SuperTrend, PSAR, and Donchian Channels) into one visual guide.
Checking Momentum: RSI+MFI Momentum Mapper
This oscillator is your momentum gauge, combining RSI and MFI for a more reliable signal:
- Zero line: Above zero means bullish momentum, below means bearish.
- Colored columns: Watch how these behave - the color changes tell you about momentum shifts.
- Marker lines: Just like on the main chart, these track the range of the current momentum swing.
- Peak markers: The yellow triangles mark significant momentum peaks and troughs.
When the marker lines are making higher highs in bullish territory or lower lows in bearish territory, the momentum is strong. When they start to flatten out, momentum is weakening.
Timing Entries: MACD Boundary
The MACD Boundary adds precision to your entries and confirms the other indicators:
- Histogram columns: The dynamic coloring tells you about strength and direction.
- Marker lines: These track the historical range of the current MACD cycle.
- Peak markers: Just like the RSI+MFI indicator, these show you momentum turning points.
One huge advantage of this MACD implementation is the timeframe flexibility - you can view a shorter timeframe chart but calculate the MACD on a higher timeframe for better trend alignment.
Putting It All Together: Trade Setups
Bullish Setup:
1. Main chart: Background turns green, ZigZag starts moving up, and we get an up triangle
2. RSI+MFI: Crosses above zero, columns turn green, and the high marker line starts making higher highs
3. MACD: Histogram turns green and crosses above zero
Bearish Setup:
1. Main chart: Background turns red, ZigZag starts moving down, and we get a down triangle
2. RSI+MFI: Crosses below zero, columns turn red, and the low marker line starts making lower lows
3. MACD: Histogram turns red and crosses below zero
Fine-Tuning Entries
For entry timing, I'd pay special attention to:
- When price tests the lower (cyan) marker line in an uptrend
- When the RSI+MFI indicator shows a yellow up triangle at a trough
- When the MACD histogram starts to turn back toward zero after making a notable low
Managing Risk
Use the marker lines on the main chart for stop placement - they create natural areas of support and resistance. In an uptrend, I'd place my stop just below the lower marker line. In a downtrend, I'd place it just above the upper marker line.
Pro Tips from Personal Experience
1. Watch for divergences: If the main chart is making higher highs but the oscillators are making lower highs, be cautious of a potential reversal.
2. Pay attention to confluences: When marker lines from different timeframes align at a similar price level, that's often a powerful support/resistance zone.
3. Don't fight the background color: One of the easiest mistakes is trying to short when the background is green or go long when it's red. Be patient and wait for full alignment.
4. Focus on peak markers: Those little yellow triangles on the oscillators often precede major moves, especially when they show up after a deep momentum thrust.
5. Use the percentage values: On the main chart, the percentage indicators show where price is within the current range - great for gauging how much "room" is left in the current swing.
Remember, no system is perfect, but this suite gives you a comprehensive view of market structure, momentum, and timing. When all three indicators align, that's when the highest probability setups occur.
Disclaimer
This trading system explanation is provided for educational and informational purposes only. Trading financial markets involves substantial risk of loss and is not suitable for all investors. The analysis, indicators, and strategies discussed do not constitute financial advice, investment recommendations, or signals to trade. Past performance of any trading system or methodology is not necessarily indicative of future results. Before implementing any trading strategy, consult with a licensed financial advisor who can provide personalized advice based on your specific financial situation, risk tolerance, and investment goals. Remember that no trading system can guarantee profits, and you should never invest money that you cannot afford to lose.

METROBRAND WEAK METRO BRAND WEAK
52-Week Range: ₹990.05 - ₹1,430.00
PE Ratio: 70.14, which is relatively high,
Market Capitalization: ₹29,235 crore

TITAN WEAK TRENDTITAN WEAK TREND
Market Capitalization: ₹2.81 trillion
52-Week Range: ₹2,985.05 - ₹3,867.00

EURUSD:Pay special attention to the resistance level at 1.0850In the future, two major variables will dominate the trend of the euro:
1、Details of tariff policies: If the US imposes tariffs on the EU with an intensity exceeding expectations, the euro may quickly test the support level of 1.0750. Conversely, if the measures are mild or postponed, the exchange rate may rebound above 1.0900.
2、Linkage of US economic data: If the manufacturing PMI and non-farm payroll data reinforce the "American economic exceptionalism", the US dollar may regain buying interest and suppress the euro. If the data is weak, it will solidify the expectation of an interest rate cut by the Federal Reserve in June, which is bearish for the US dollar.
We can focus on the initial resistance level of 1.0850 above. If this level is not breached, one can attempt to short at high levels.
Trading strategy:
Sell@1.0850
TP:1.0750
Get daily trading signals that ensure continuous profits! With an astonishing 90% accuracy rate, I'm the record - holder of an 800% monthly return. Click the link below the article to obtain accurate signals now!

EUR/USD BuyHello dear traders
I try to guide you in trading and creating trading positions and share my trading ideas with you so that if I make a profit, you can also make a profit with me.
These analyzes are done with great complexity and all technical parameters are taken into account as much as possible.
And finally, it is presented to you in a completely simple and practical way to use them.
Be sure to follow the capital management.
Do not risk more than 1% of the capital in any of the positions.
Keep in mind that you are responsible for all trades.
(Good luck)

BTC:Start to recoverBTC broke below 83,000 and continued to decline, reaching around the lowest level of 82,000. Currently, it generally shows a downward trend.
In my opinion, the entire bearish trend is merely a well-structured catalyst. Its function is to attract breakout sellers, create the illusion of a sustained downward trend, and trap liquidity at the low points before the true direction becomes apparent. Retail traders who short this structure are providing momentum for the next upward rally.
Before that, BTC can still be regarded as bullish, and each pullback to the demand zone can be considered as an opportunity to go long.
BTC Trading strategy:
buy@82000-82500
TP:83000-85000
Get daily trading signals that ensure continuous profits! With an astonishing 90% accuracy rate, I'm the record - holder of an 800% monthly return. Click the link below the article to obtain accurate signals now!

XAU/USD BuyHello dear traders
I try to guide you in trading and creating trading positions and share my trading ideas with you so that if I make a profit, you can also make a profit with me.
These analyzes are done with great complexity and all technical parameters are taken into account as much as possible.
And finally, it is presented to you in a completely simple and practical way to use them.
Be sure to follow the capital management.
Do not risk more than 1% of the capital in any of the positions.
Keep in mind that you are responsible for all trades.
(Good luck)

DXY:Seize the opportunity to sell short at high pricesThe situation in the Middle East is clearly deteriorating, which undoubtedly has a huge stimulating effect on the global risk aversion sentiment. More funds have started to seek safe havens. However, the best choice at present is not the US dollar. With the continuous rise of the East, more and more capital will favor this side of the East. Therefore, the pressure on the US dollar index is actually increasing, and it will be very difficult for it to rise.
Regarding the trend of the US dollar index today, although the current situation exerts great pressure, the actions to support the market of the US dollar index still take effect from time to time. So the price will not keep falling, and there will still be some oscillatory patterns. However, even if it moves in an oscillatory pattern, the upward pressure on the US dollar index will be significant. Therefore, when the price reaches the effective resistance level, it will be an excellent opportunity to short the US dollar index.
DXY Trading Strategy:
buy@104.500
TP:103.500
Get daily trading signals that ensure continuous profits! With an astonishing 90% accuracy rate, I'm the record - holder of an 800% monthly return. Click the link below the article to obtain accurate signals now!

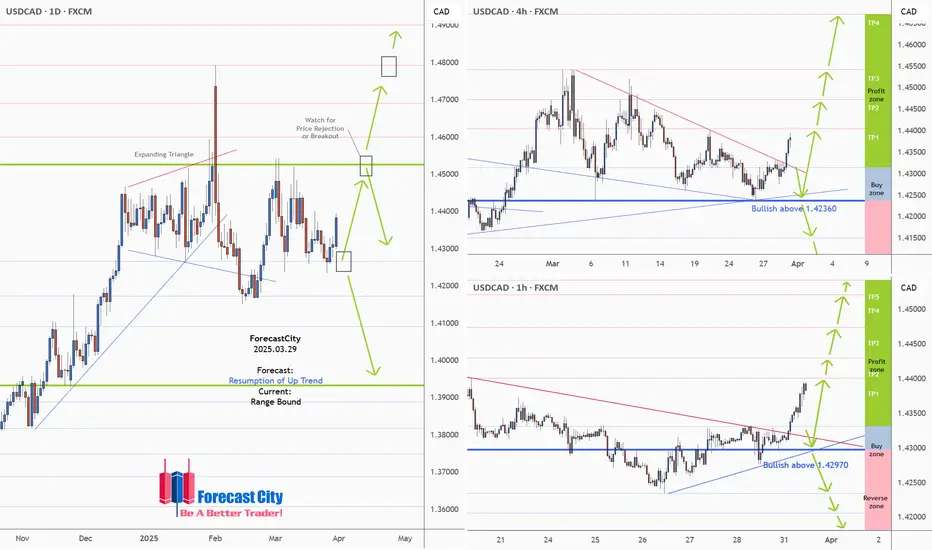
USDCAD -Weekly Forecast,Technical Analysis & Trading Ideas
Technical analysis is on the chart!
No description needed!
OANDA:USDCAD
________________________________________________________________
❤️ If you find this helpful and want more FREE forecasts in TradingView,
. . . . . . . . Hit the 'BOOST' button 👍
. . . . . . . . . . . Drop some feedback in the comments below! (e.g., What did you find most useful? How can we improve?)
🙏 Your support is appreciated!
Now, it's your turn!
Be sure to leave a comment; let us know how you see this opportunity and forecast.
Have a successful week,
ForecastCity Support Team
USD/CHF For Bullishwait for pull-back near by entry point and the go long
general trend is down trend
current phase is pull-back
have fun :)

USOIL: GO short positions during the oscillation at a high levelThe short-term trend of crude oil has been oscillating and declining at a high level. The oil price has broken below the moving average system, and the objective short-term trend has entered a transition period. The bearish momentum is gradually intensifying, and the oil price dropped below 70 in the early trading session. In the 4-hour chart, the objective short-term trend direction within this week still remains upward. The trading strategy for crude oil still mainly focuses on the oscillation and decline at a high level.
Trading Strategy:
Sell@69.8-70
TP:69-68.5
Get daily trading signals that ensure continuous profits! With an astonishing 90% accuracy rate, I'm the record - holder of an 800% monthly return. Click the link below the article to obtain accurate signals now!

XAUUSD:Place short positions during the rebound I conducted resistance tests at the levels of 3,100 and 3,115. However, in the early trading session, the price of gold surged rapidly, soaring all the way to around 3,027. In the later period, choosing to stand by and observe to avoid risks could also be regarded as a sound strategy. Now, the market has approached a stable state. The resistance test at 3,027 has proven to be effective. One can place a short position near 3,025 during the rebound.
XAUUSD Trading Strategy:
sell@3125
TP:3115-3105
Get daily trading signals that ensure continuous profits! With an astonishing 90% accuracy rate, I'm the record - holder of an 800% monthly return. Click the link below the article to obtain accurate signals now!

XAU/USD For Bullishwait for pull-back near entry point and then go long
general trend is up trend
have fun :)

NZD/USD For Bearishwait for pull-back near by entry point and then go short
NZD Under pressure
have fun :)
